
Most successful retailers looking to start a business have an uncanny instinct for a good location because nearby residents will make their business flourish. But there is a new wave of retailers that back up their gut instinct with the latest technology and utilize a scientific approach with hard data to determine the perfect location for a new business. This article explores how they do it.
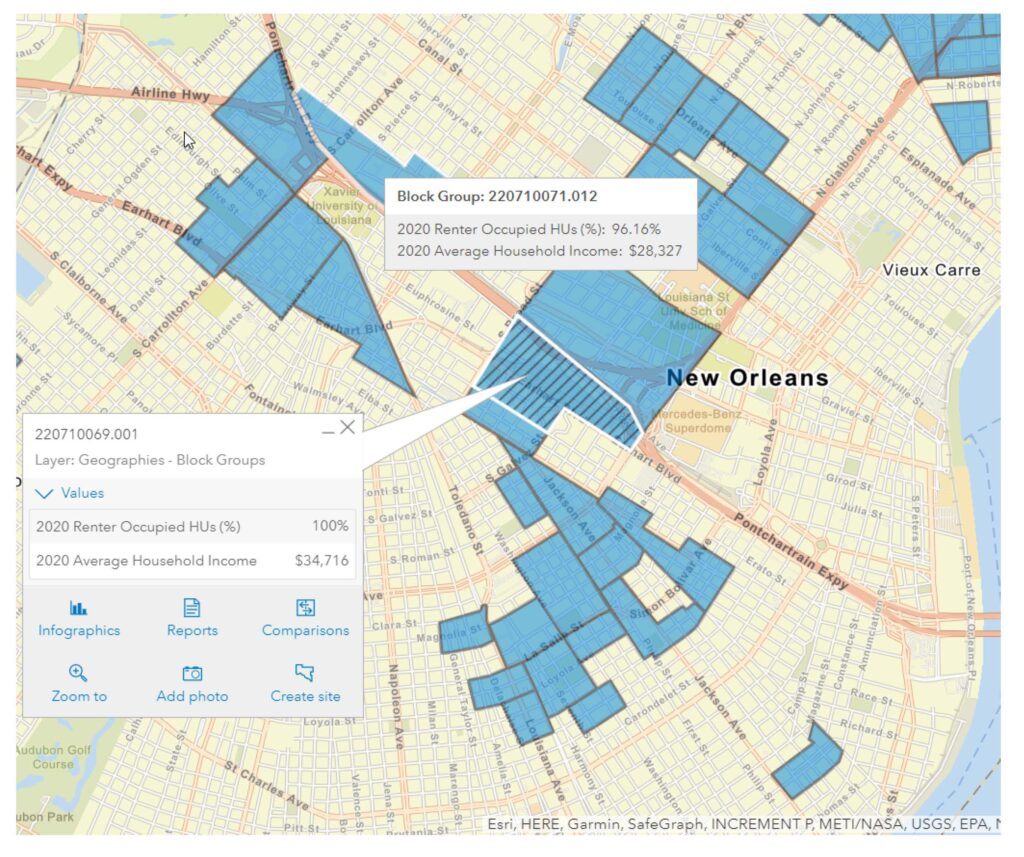
Let’s look at how the owner of a simple business like a laundromat determined what location would be best for them. The business owner first researched who a typical customer is for a laundromat: someone who rents rather than owns a home and has a minimum wage income. We utilized the CCIM Site To Do Business to map all the neighborhoods in New Orleans and identify both criteria: over 60% of the households rent rather than own, and have an income between $20,000 and $35,000. The map shows how the search identified the large areas shown in blue and narrowed the areas down into Block Groups, which are usually between 600 and 3,000 people. Block Groups are submarkets of Census Tracts which are submarkets of Zip Codes, and are used to pinpoint a more precise retail location.

We can also use the data to compare a short list of locations to determine current population density and population growth in the future. Great locations pull from nearby residents with a propensity to buy your goods; however, having a dense population can make up for a lack of demand. Population growth should be a key factor in site selection, and the data is readily available.
ESRI is a research firm that collects data on consumer spending which can show not only spending in various categories but can also drill down into specific items that may be triggers for a business. Old school site selection was as simple as locating near a McDonald's because they spent the money to research the best locations. So just be near a McDonald's. Today, a small business can get the same insightful data from ESRI demographics and make decisions just like big corporations.

The map easily shows the annual coin-op spending per household by block groups with the darker circles spending the most per household. Also depicted is the block group total spending with the larger circles budgeting over $120,000,000 annually.
The best retail locations are not always the wealthiest areas. Dollar General opened 18,000 stores growing to 30 billion in revenues with locations in modest income areas. Get to know your customers and what they need, then develop your own criteria for who your best customer is. Look for areas that have a dense population that meet that criteria but also are growing. There is a lot of data available which can reduce your risk in selecting the perfect location for your business, and much of it can be obtained for free. Just ask a commercial real estate broker with the CCIM designation and access to the ESRI data to help.
For more information on starting a business, read our blog on "What To Know Before Signing a Lease".
Recently Bed Bath & Beyond announced bankruptcy and are closing all their stores. We will miss the 20% off coupons, but you had to go. Going out of business is a normal part of a free enterprise system that rewards creativity, financial sophistication and the ability to listen to your customers. The penalty for free market failure is death and Bed Bath & Beyond was fatally mismanaged. They took on mountains of debt but the stake through the heart was ignoring the obvious shift in how their customers wanted to do business. While BBY was sitting on their hands, Amazon was inventing one-button shopping and prime delivery, Walmart developed a website that sold products they did not have to inventory and Target ramped up same day delivery. Customers voted with their dollars and BBY has to go.
Businesses in a capitalistic, free market economy within a democratic political system can thrive and produce amazing goods and services because of the "invisible hand", coined by Adam Smith, which states an individual's self-interest causes them to work harder and be more creative and produce a better product at a lower cost so that they reap the profits. A modicum of greed really is good. Consumers benefit and the interests of society are advanced.

But what happens to those businesses that can't adapt to new demands by consumers, that can't evolve and can't adopt new technology?
Like the wildebeests who are unable to outrun the lion, they must die to strengthen the species. We should cheer on their death and wish for fast failures which provide more time for success.
Failures stop the destruction of scarce resources and allow the lifeblood of any business, cash-flow, to be redeployed to a higher and better use. Failure and death stops the misallocation of time and money.
It can happen to big businesses and small. For example, in 1902, Schlitz was the largest selling beer, but couldn't stay big enough to stop an acquisition by Stroh and later Pabst.

Eastern was once one of the big four airlines but ran itself into the ground financially by paying 17% to borrow money and was crushed by labor disputes. It was liquidated in 1991.
We feel sad for the businesses no longer here but are still part of our history and fond memories, whether the business was gobbled up because it could not grow to crush its competition, or whether it fell by the wayside because it could not keep up with its customers. There are many examples of both:

TimeSaver stores were ubiquitous, but most of their profits were from gas and cigarettes and in the 1980's when the economy changed and gas price margins shrank, the name disappeared when they failed to diversify.
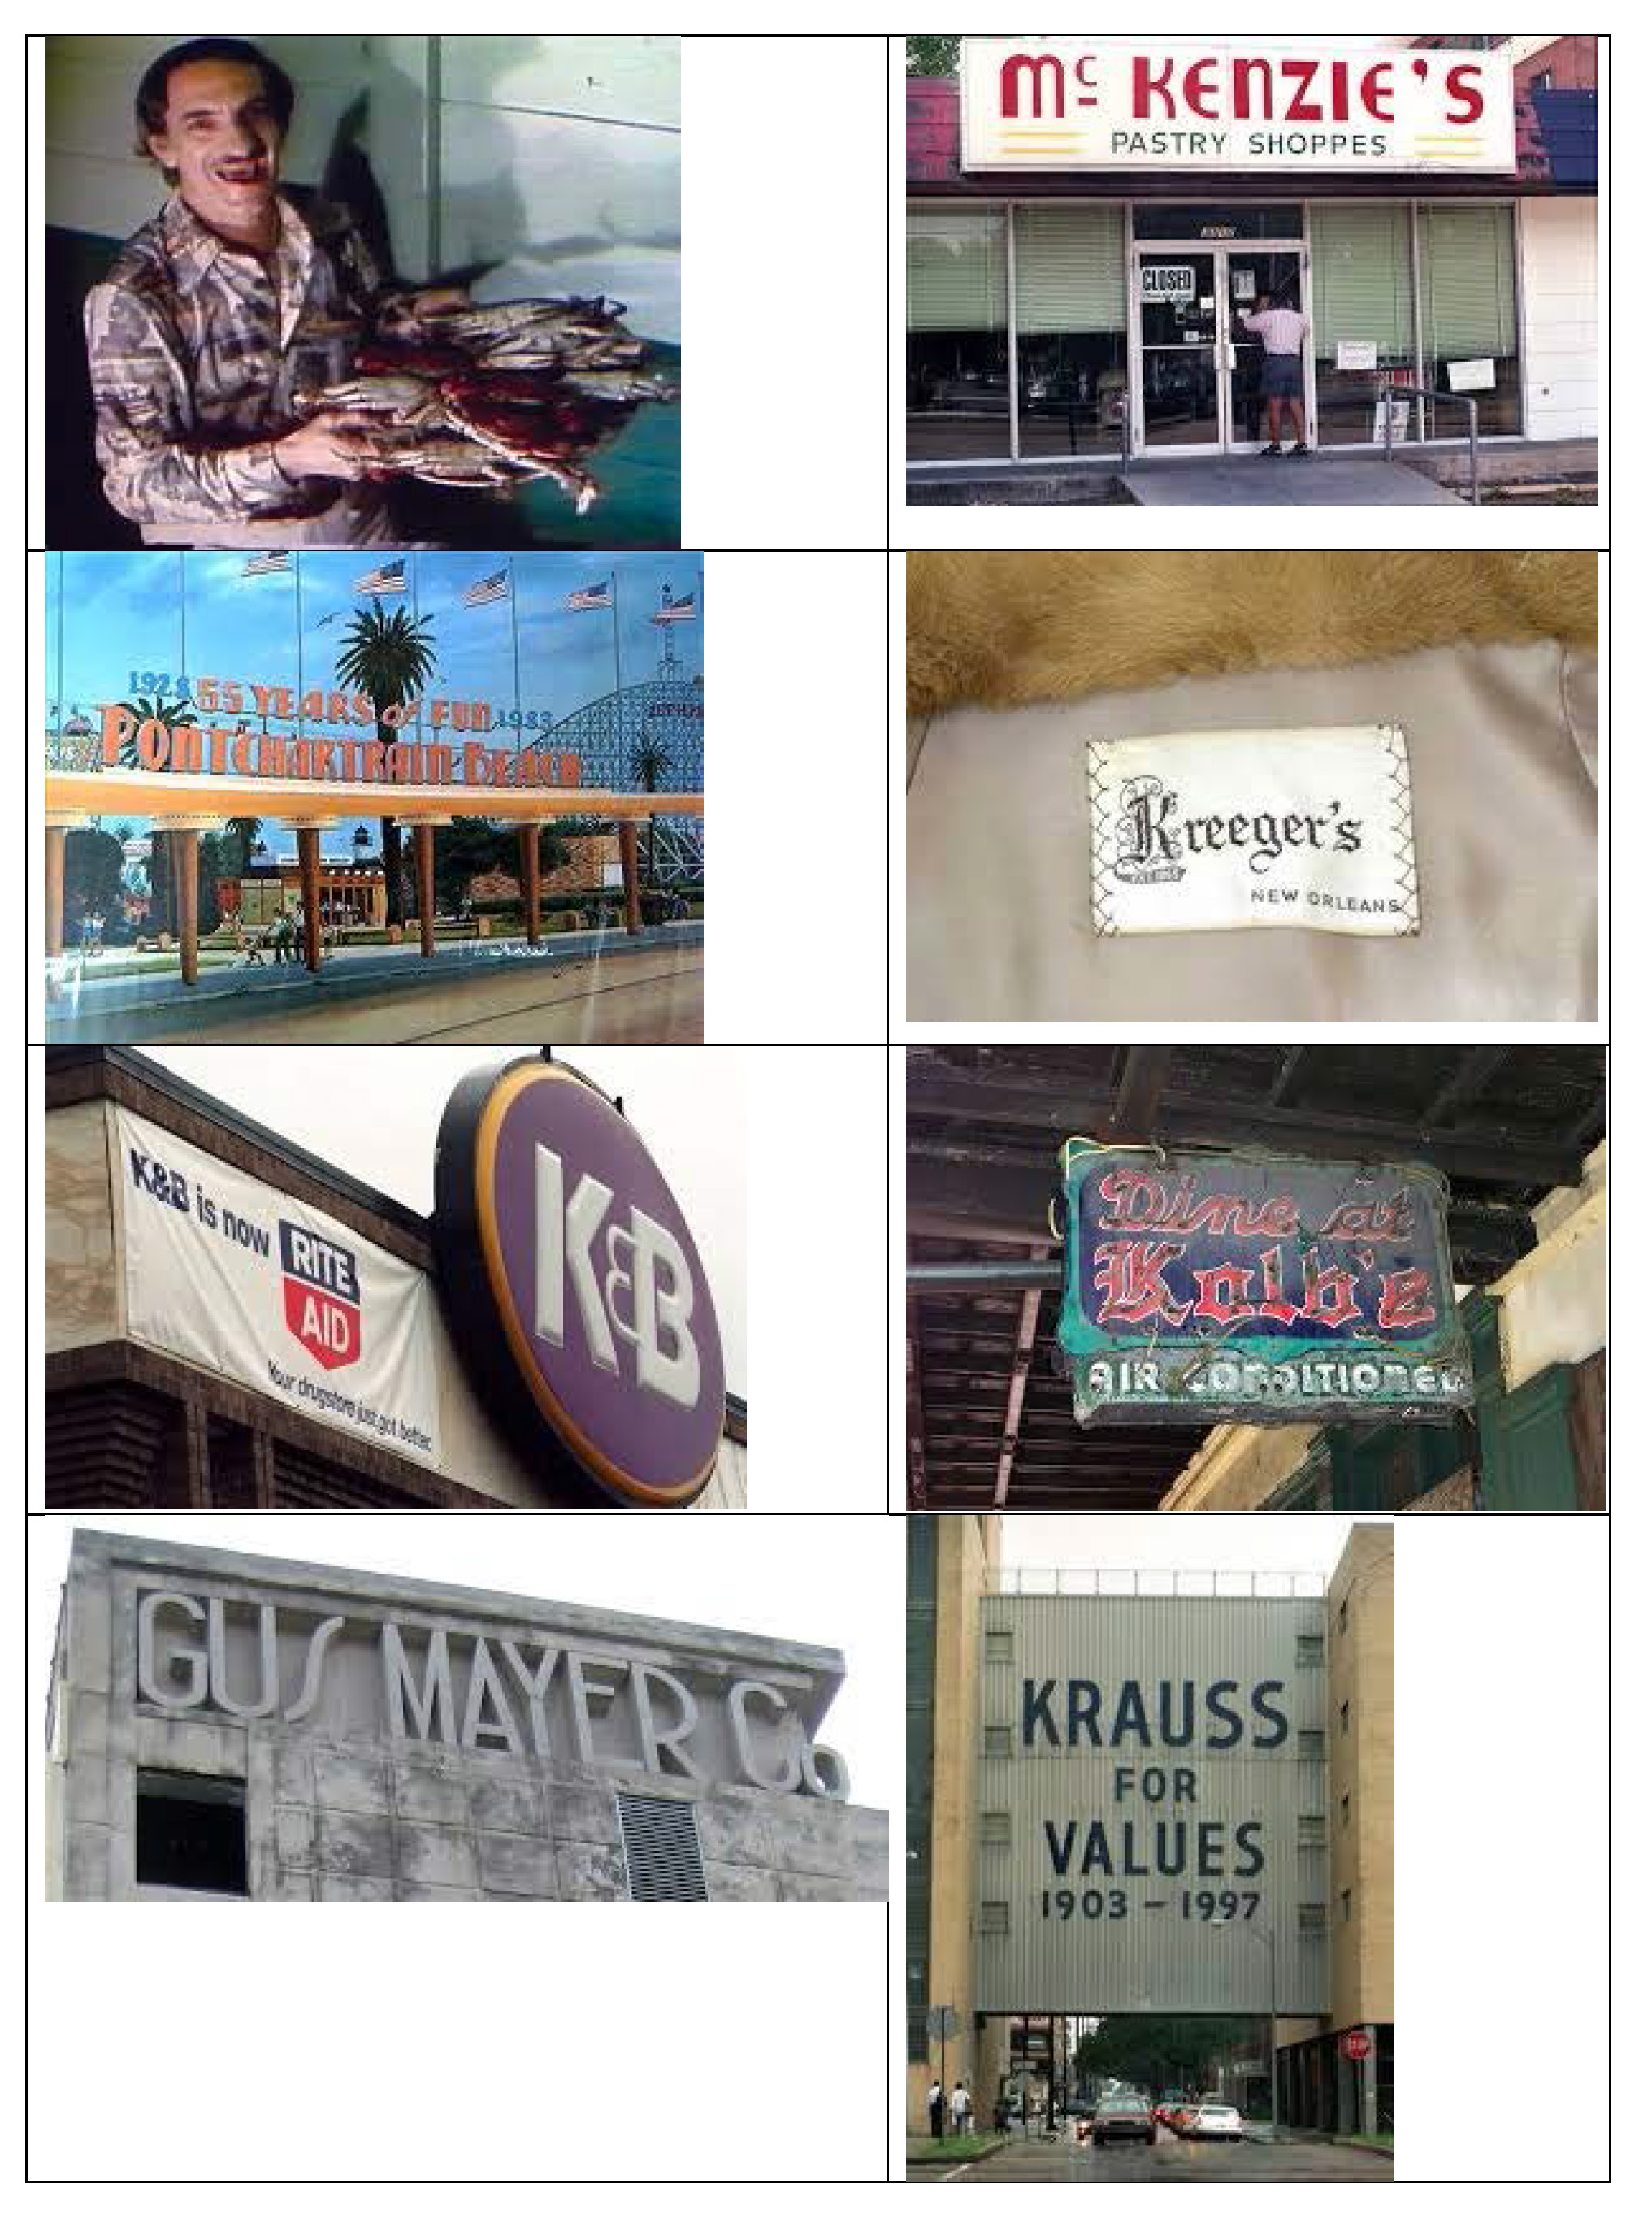
Seafood City once owned the crawfish market and their jingle was on every New Orleanian's lips. Although the commercials were hokey, they were the best word-of-mouth advertising any business would crave. The big store at 1826 North Broad closed in 1994.

The list of local brands no longer around extends to Ponchartrain Beach, McKenzie's, Kreegers, Kolbs, K&B, D.H. Holmes, Krauss and Gus Mayer. They were all great businesses. They just could not evolve and adapt. They got old and sick. Then they died. We miss them fondly, but we now vote with our dollars for their successors and competitors who serve us better.
For more information on economics and commercial real estate, pick from over 150 articles on our blog at Louisiana Commercial Realty.
This blog reviews the sale trends the last 3 years in the 4 major sectors of New Orleans commercial real estate, with an explanation of why some sector prices have remained flat while other sectors have seen price increases.
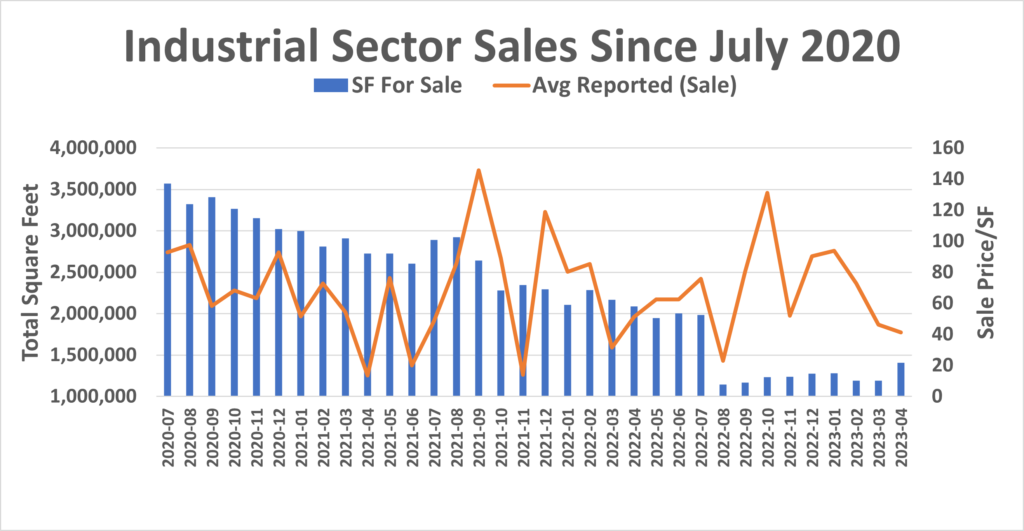
The number of industrial listings for sale has declined the last 3 years from 106 totaling 3.5 million square feet to 54 totaling 1.4 million square feet. There has been an average of 3 sales per month at $70/SF on the market for 316 days and 30,000 SF in size. Prices defied the law of economics since supply declined 50% but average sale prices have not increased. The reason is that while square footage declined, so did demand which went to areas outside New Orleans, missing out on the nationwide explosion in warehouse space driven by Amazon and the ecommerce industry.
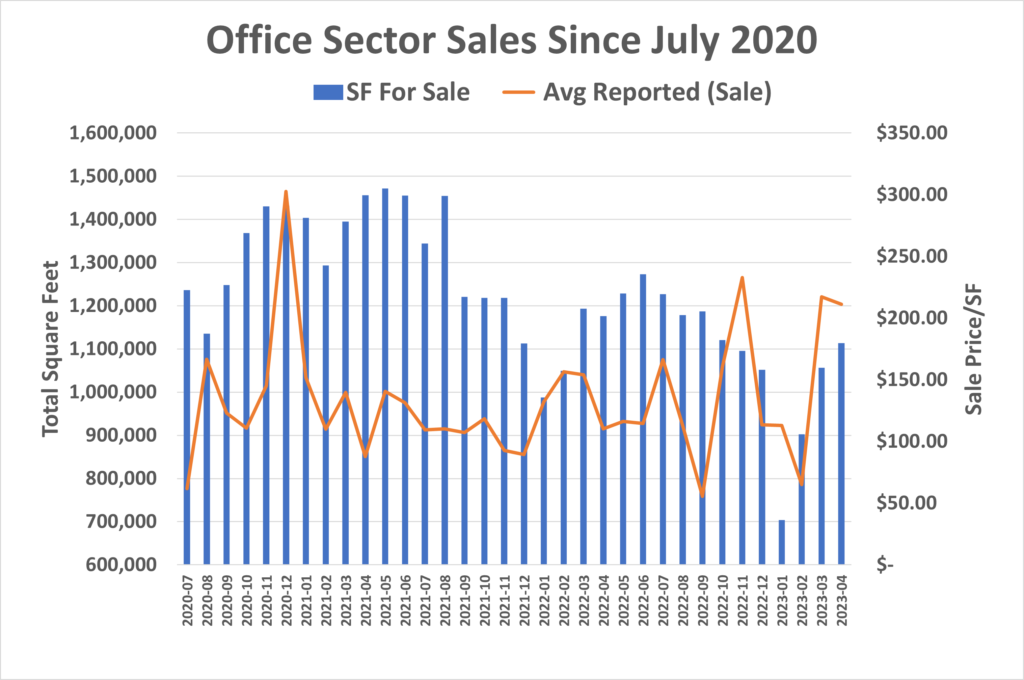
The number of office listings for sale has declined the last 3 years from 135 totaling 1.2 million square feet for sale to 103 totaling 1.1 million square feet, but ranging as low as 700,000 square feet to a high of 1.47 million square feet. There have been an average of 7 sales per month at $133/SF and on the market for 282 days. The average sale size was 10,600 square feet.
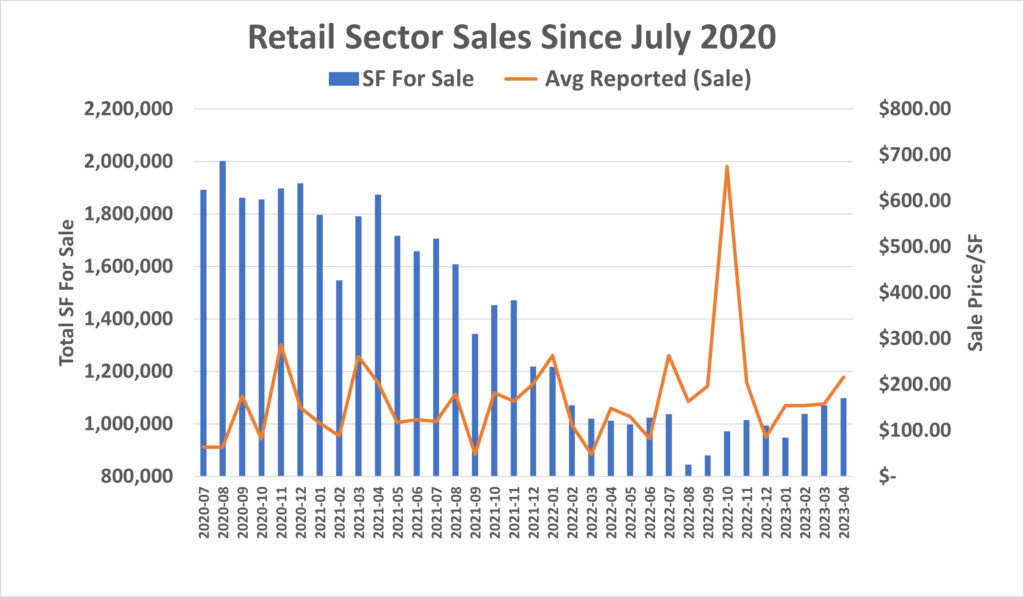
Retail sale listings declined from 174 totaling 1.9 million square feet to 134 listings totaling 1.1 million square feet. The average size was 10,000 SF, on the market 286 days and sold only 6% below the list price. There have been an average of 7 sale transactions per month at $167/SF, but prices have ranged from $47/SF to $200/SF, with an October 2022 outlier peaking with 7 transactions averaging $674/SF.
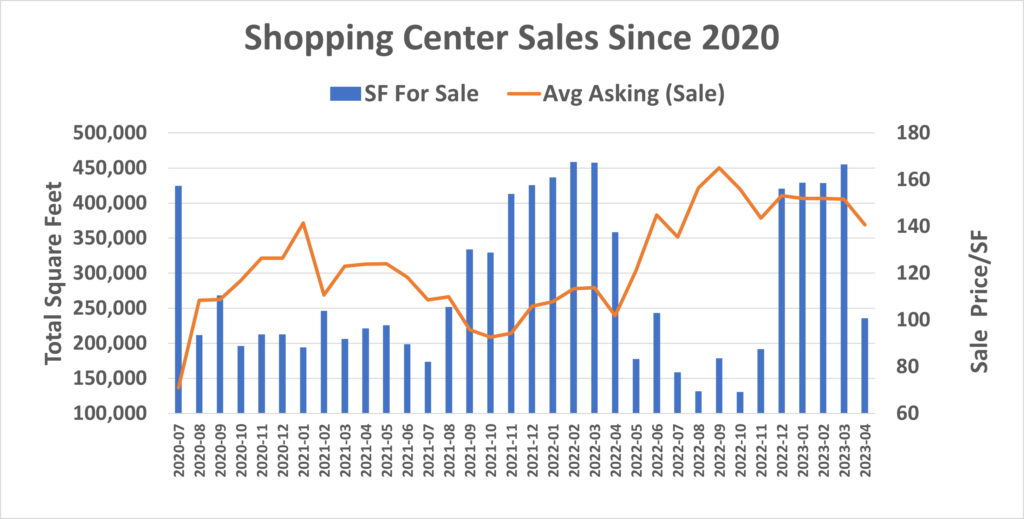
Only 25% of shopping center sale prices are reported, so substituting the list price, the average price was $123/SF for the 17 shopping centers total sold the last 3 years. Listings are scarce, with a monthly high of 15 on the market to a low count of 7 listings available monthly during the summer of 2022. Total square footage averaged 280,000 with the average size shopping center at 26,000 square feet and taking an average of 449 days to sell.
There is no training from LREC or NOMAR on how to use technology to comply with email requirements, but here is how to have your required broker name, city & state and license jurisdiction automatically added to the bottom of every email.
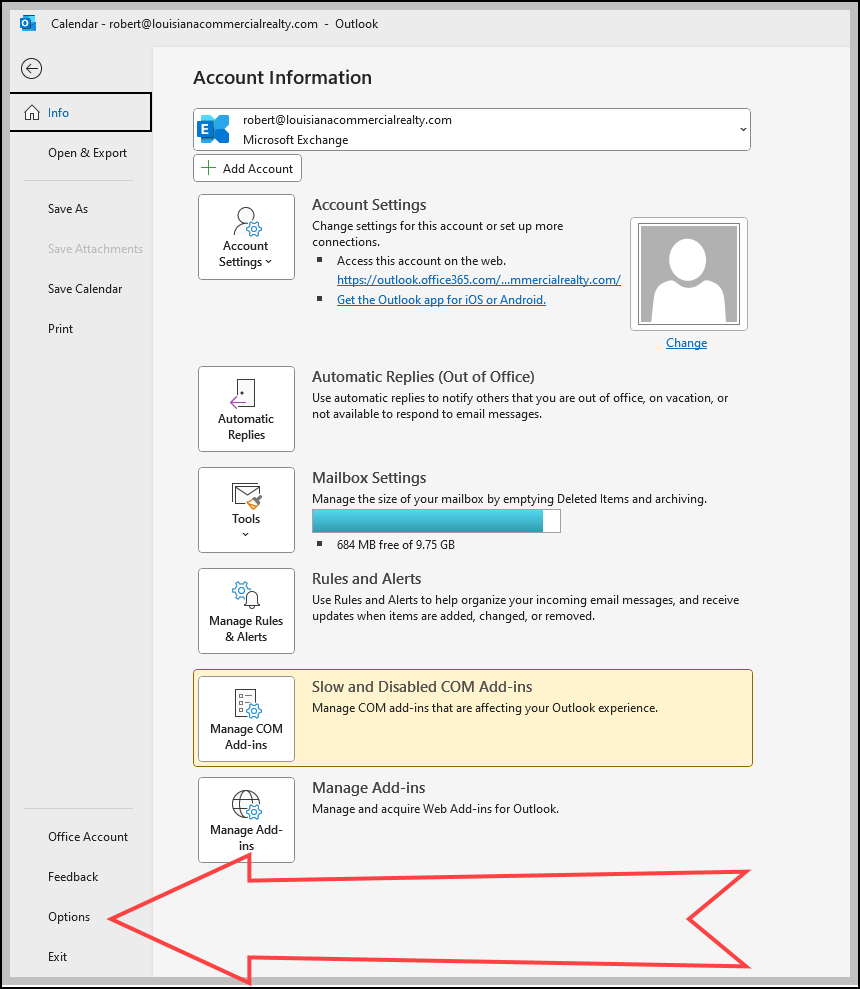
1. Go to File.
2. Then select Options.
3. Then select Mail.
4. Then Signatures.
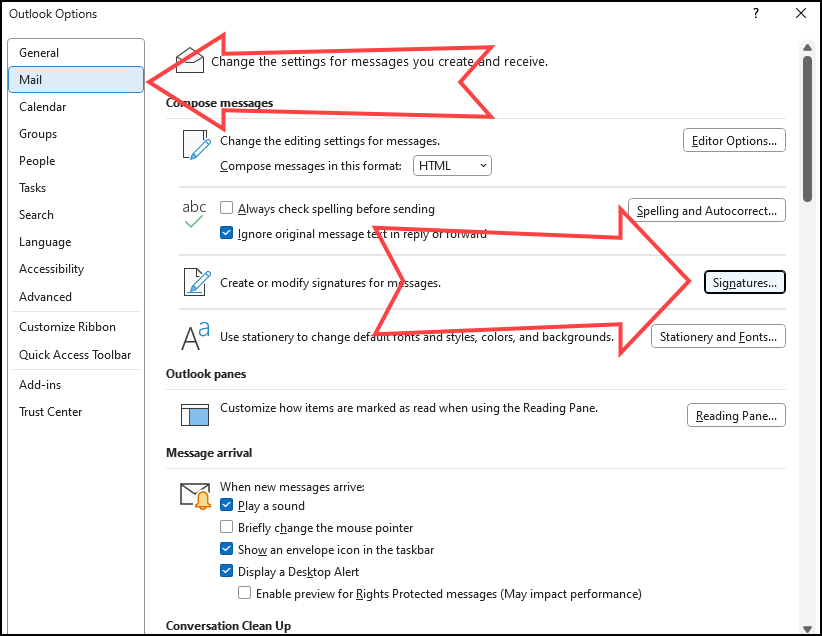
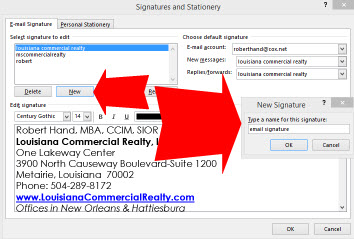
5. Then under the Email Signature tab select the New button.
6. Type in the name for your New Signature.
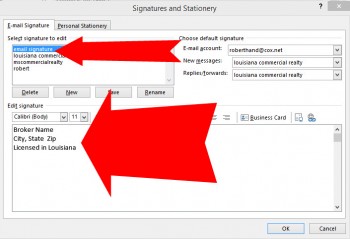
7. Highlight Select Signature To Edit.
8. Type in signature information under Edit Signature box.
9. Click OK then OK.
Now every email you send will automatically add in the required information.
All advertising must contain:
All emails must include on the first or last page:
All website advertising must include on every page:
 The Certified Commercial Investment Member (CCIM) designation is the premier recognition earned by the top 10 % of commercial real estate agents. With 13,000 members in 55 chapters, both in the United States and in 30 countries, the organization provides training in the most complex strategies of commercial real estate. The organization is the PhD of real estate, taking several years to complete and culminating in a 6 hour final exam on every aspect of commercial real estate.
CCIM recently interviewed Louisiana Commercial Realty on the state of the New Orleans commercial market in 2023:
Actually, the New Orleans commercial real estate market has been evolving since the 1970’s. When the oil economy was strong back in the 60’s and 70’s, there were lots of new jobs in the oil industry which created demand for office space over the next decade. In the 1980's, downtown New Orleans saw vibrant new construction of Class A office towers and towns near the Gulf of Mexico witnessed the explosion of industrial space. Our biggest building was One Shell Square, a 51 story, 700 foot tall, office tower.
Then the oil industry started regionalizing and New Orleans downsized while Houston upsized. There hasn’t been a large office tower built since then in New Orleans and even today we have high vacancy rates in Class A office towers. The smart thing city leaders did in the 1980’s was build a large convention center so we were able to compete with tourism based economies like Las Vegas. Basically, we swapped $150,000 petroleum engineers for $35,000 waiters and waitresses, but today we are one of the smaller markets that can feed, board and entertain 25,000 dentists having a national convention. Even though the tourism market has ebbed and flowed, we have the nation’s best restaurants and the perfect work force for tourism, so the hotel and restaurant market has been vibrant despite the Covid hiccup.
You have to be an expert at what drives each market and know what your clients want. You have to be creative. We negotiated one of the largest office leases a while back but the tenant wasn’t an office user. They were a hotel. We figured out how to market 3 floors of vacant office space in a soft market to a hotel franchisee. And last year, one of my competitors, SRSA, figured out how to transition a boring shopping center’s vacant Sears store into a major hospital in a $50 million dollar investment.
Your firm emphasizes its use of new technology and data as a way to gain a competitive edge. How important is it for your business to stay on the cutting edge of tech?
It is vital and I wish we would have caught on to it earlier. There is lots of technology out there for the real estate industry. Wal-Mart, Target and Amazon have it but not mom and pop businesses in small towns. That’s where CCIM can help. We can bring well-thought out analysis to small and mid-sized businesses so they make smarter real estate decisions, using the same technology that the big businesses have.
We heard about a property you handle in New Orleans. How did you leverage technology to help you in this transaction and what insights did you and your clients gain?
Every marketing plan and marketing presentation I do now has CCIM's demographic data jam-packed in it, and clients love the technology because it gives them valuable information they cannot find anywhere else. We can show them what businesses would be successful at any address. That is vital information and many property owners do not know that data exists and do not have access to it. But as a CCIM, we have access to the data that can help client sand tenants make smart real estate decisions.
We had one listing in New Orleans East, which is an unloved area of New Orleans, but there are 30,000 residents within 5 minutes and 60,000 residents within a 10 minute drive time. We used the CCIM database of consumer spending produced by research firm ESRI to show the property owner and also potential tenants that residents spend $20 million annually on food but food businesses only sell $14 million, so $6 million is purchased outside the area by residents. There's more: $5 million is spent on sporting goods by residents but there is no sporting goods store. There's more: $3.7 million is spent on jewelry but there is no jewelry store. From that demographic insight, we know what potential tenants to target and businesses know what the market share would be and can more accurately forecast sales.
With such a broad scope of work across property sectors and a long successful resume in the industry, what would be your advice to other CRE pros looking to grow their business this year?
Be an expert and help your clients by educating them on the market and how to make smart real estate decisions.
On a personal note, your bio mentions a gig you had selling dictionaries door-to-door to pay your way through college. What lessons did you learn back then that you still use today? What would you tell young folks curious about commercial real estate to prepare them for a career in this field?
Selling dictionaries door-to-door paid for my college but required long hours and taught us to work smart. We all wanted to get that award for working 100 hours a week. I got the award but after a week, I wanted to work smarter so I tried using referrals. I would ask my prospect if they knew the neighbor across the street. They would always say yes but we don’t talk much. I would share the names of the families I had sold to. I would say, well the Smiths across the street bought the full dictionary set, the Thomases next door bought the educational set, the Joneses at the corner bought the book on new math, and soon they got the idea that they might be missing out. Today, you can target certain industries and use media like LinkedIn to connect with people you can help. You have to work smarter. (more…)
Whether you rent office space in a Class A office tower, warehouse space to store inventory or retail space for your coffee shop, your lease probably includes terms that are not good for you but that you agreed to anyway. This article exposes common lease mistakes and explains that unless your lease language is clear on every detail, even small mistakes can be very costly.

Here is an example of the lease language used by $2.6 billion market cap Regus PLC in 3,000 locations:
If this agreement is for a term of more than 12 months, the Provider will increase the monthly office fee on each anniversary of the start date. This increase will be by the local Consumer Price Index or such other broadly equivalent index where a consumer price index is not available locally.
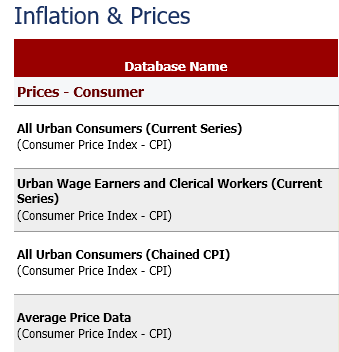
This Regus lease language leaves lots of room for dispute because the consumer price index has several ways of being calculated. The CPI index is produced by the Bureau of Labor Statistics, under the United States Department of Labor and the four types of consumer price indices are:
All Urban Consumers (Current)-Consists of all urban households in Metropolitan Statistical Areas (MSAs) and in urban places of 2,500 inhabitants or more. Nonfarm consumers living in rural areas within MSAs are included, but the index excludes rural nonmetropolitan consumers and the military and the institutional population.
Urban Wage Earners and Clerical Workers (Current)-Consists of clerical workers, sales workers, protective and other service workers, laborers, or construction workers. More than one-half of the consumer income has to be earned from these occupations, and at least one of the members must be employed for 37 weeks or more in an eligible occupation.
All Urban Consumers (Chained)-The urban consumer population is deemed by many as a better measure of the general public because 90% of the country’s population lives in urban areas. Using chained CPI means the rate at which Social Security benefits tick up would be slower, because it reflects substitutions consumers would make in response to rising prices of certain items. It utilizes a basket of goods and services that are measured changes from month to month; much like a daisy chain. If the cost of a certain form of transportation goes up, people might switch to another kind and this kind of “substitution” is part of what is factored into chained CPI.
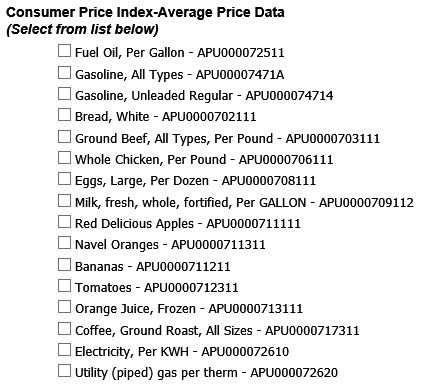
Average Price Data– Calculated for specific items such as, household fuel, motor fuel, and food items. Average prices are best used to measure the price level in a particular month, not to measure price change over time.
The most common CPI Index is the All Urban Consumers Index, but it has two methods used to calculate the numbers: one uses a base period 1982-1984 as 100, and the other method uses a base period of 1967 as 100. Most leases make the mistake of not being clear about which index is used. In addition, the data can be seasonally adjusted or not seasonally adjusted (which is released faster).
Here is another example; this language for a medical property that makes the CPI data source very clear:
Consumer Price Index: It is further understood and agreed by and between Lessor and Lessee that, commencing with the first day of the second year of lease, the monthly rental as set forth above will be adjusted upwards at the beginning of the second lease year, and every year thereafter until expiration or termination of the lease using the all urban consumers (CPl-U) United States City Average, All Items, (1967=100) published by the Bureau of Labor Statistics, United States Department of Labor (referred to as "Consumer Price Index").
| Year | CPI | Rent Annually |
| 0 | 3.00% | $100,000 |
| 1 | 3.00% | $103,000 |
| 2 | 3.00% | $106,090 |
| 3 | 3.00% | $109,273 |
| 4 | 3.00% | $112,551 |
| 5 | 3.00% | $115,927 |
Always compound if you are the landlord and never compound if you are the tenant. When adjusting for the CPI, it makes a difference if you add the inflation rate for each year rather than multiply the rate by the previous year. Assume a 5 year lease renewal where the CPI was 3% each year for the previous 5 years. Some landlords multiply 5 years times 3% to get 15% for the increase. For a large property with rent income of $100,000 annually, the adjusted rent would be $115,000; however, if the lease is written so the CPI is compounded, meaning each new year is applied toward the previous year’s CPI, the result is rent of $115,927 in year 5. Your lease renewal should spell out how the CPI is calculated.

Our economy today is driven by a different wage/price spiral, due to Covid shortages because almost all of our goods are made in China so when they stopped manufacturing, the shortage caused inflation. Inflation hurts landlords and savers. Most leases build in a fixed rate adjustment in addition to a CPI adjustment because the challenge for landlords is that the CPI since 2000 has averaged 2.5% and 2.4% since 2010. Even 3.6% CPI increase the last 5 years doesn’t keep up with skyrocketing medical care increases.
One strategy that benefits landlords is to include lease language stating the rent adjusts based on the CPI or a fixed rate, whichever is higher. The 30 year table shows how a 4 percent increase versus a 3 percent increase in net rents annually can increase the value of property by 10 times the initial year lease income. Your lease should include language with adjustments based on the CPI but also compared to a fixed rate, whichever is higher. This example in the table shows, assuming current rent income of $100,000, if the higher CPI or a fixed rate difference was just 1 percent, that at an 8% cap rate adds $1,020,168 more market value to the property over a 30 year lifetime.
In conclusion, make sure your lease language details how your rent is adjusted. You can design your table data at the Bureau of Labor website and, if you need help, their phone number is shown on the data release. If you call the number on the press release, the analyst who produced the CPI report will answer any questions. If your property is in outlier data cities such as Detroit, Houston or New Orleans, you can even produce a local Consumer Price Index. Remember to make sure your lease is clear about what CPI is used, how it is calculated and whether you compound your rate, which is why many tenants and landlords hire an expert to advise them. Remember, lease mistakes can be costly.
Read our nationally published articles:
Using Technology To Make Better Real Estate Decisions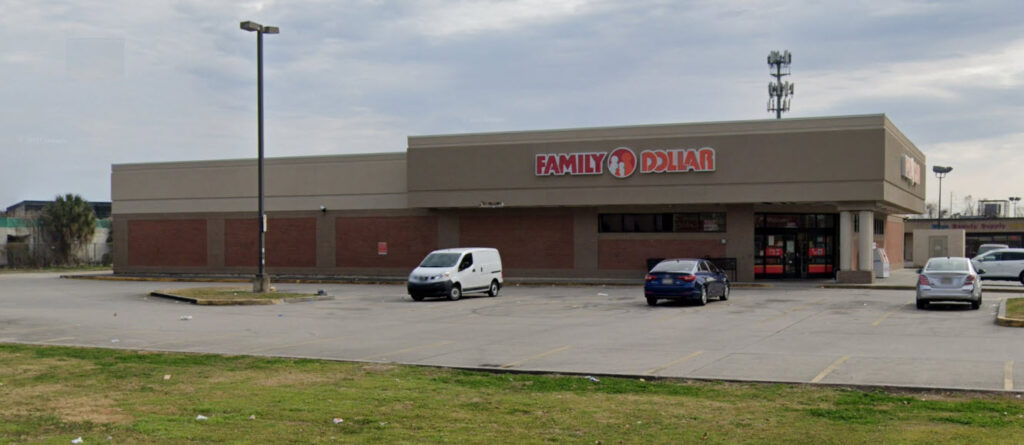
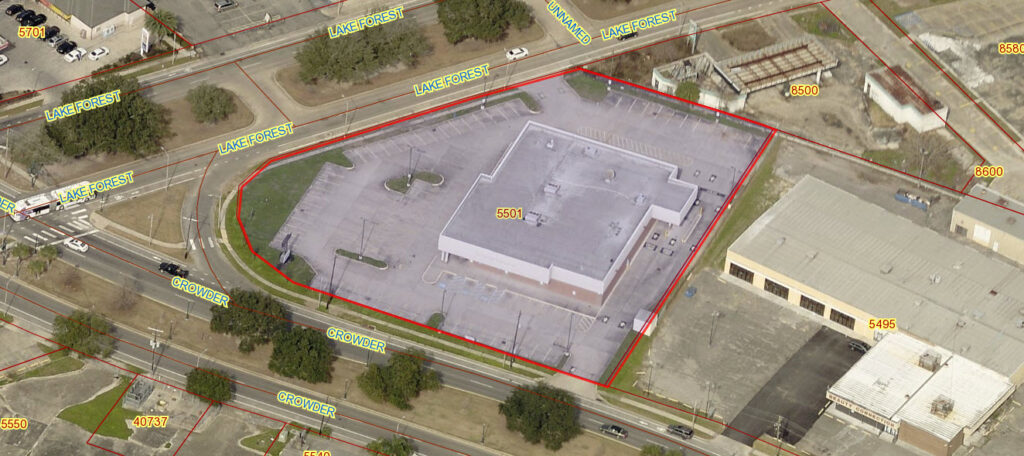
Louisiana Commercial Realty was recently hired to bring a business to the vacating Family Dollar Store at 5501 Crowder Boulevard in New Orleans East, having worked for the last decade to promote and revitalize the area. Commercial broker Robert Hand explains:
"This property is the least expensive 14,000 square foot, good-looking, retail building anywhere from MSY airport to Slidell. The rent is only $12 per square foot for a stand alone structure, plus it offers 70,000 square feet of paved parking. There is opportunity for the right business, and we have utilized the latest technology to research what businesses will do well in this location."
The retail area on Crowder has lots of new tenants including Planet Fitness, Pizza Hut, Dollar General, Subway, Little Caesars, and the largest church in the South: Franklin Avenue Baptist Church. One of the criteria that businesses look for before they invest millions in opening a new location is population: businesses need to know if the neighborhood has enough spending power to make it feasible. Louisiana Commercial Realty provides businesses with that research, including how much nearby residents spend on goods the business sells.
Long gone are the days where a business opened up and hoped they would have customers, because it is very expensive to open a business. There are costs of lease payments, advertising, setting up inventory, plus permits and construction to convert the space into a layout that works. These costs can add up to millions, which makes it a big risk to open a business.
Louisiana Commercial Realty reduces the normal risk in a business trying to revitalize an area by providing a Retail Marketplace Profile, which uses the latest technology to determine consumer spending and retail sales, which determines the supply and demand, and allows a business to look for gaps in spending by consumers (demand) and sales by existing retailers (supply). From that data a business can determine the Leakage Factor which presents a snapshot of retail opportunity.
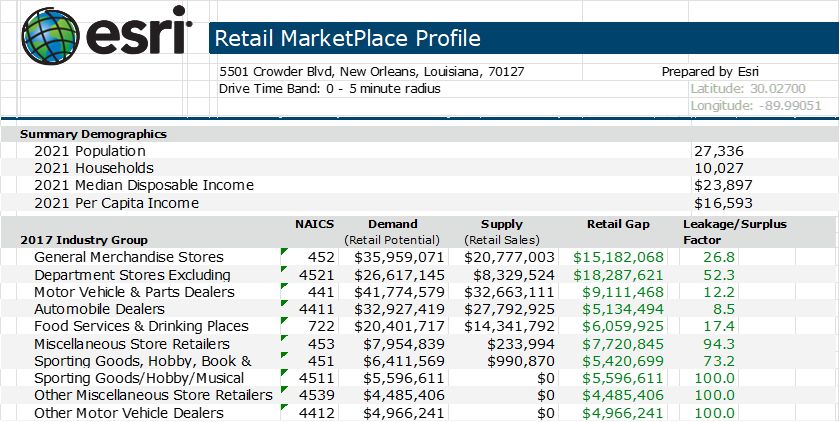
The Leakage Factor is a measure of the relationship between supply and demand that ranges from +100 (total leakage of dollars) to -100 (total surplus). A positive value represents 'leakage' which means consumers are spending money on goods and services but not within the target area, resulting in dollars flowing outside the area. A negative value represents a surplus of retail sales, which means consumers are drawn in from outside the trade area. Leakage presents an opportunity for a business to capture those dollars flowing outside the trade area, and the Retail Gap column in the table shows the difference between demand and supply which can be an estimate of annual sales for a business in this location.
When Louisiana Commercial Realty did the research they found within a 5 minute drive time for 5501 Crowder, that general merchandise stores sell $20 million annually but there is $35 million spent by consumers. That $15 million gap provides an opportunity for that type of business to operate from 5501 Crowder. Within a 10 minute drive time there is enough demand to support a fine jewelry store since $3.7 million is spent annually, and $10 million spent outside the area on sporting goods and musical instruments. The data show that these businesses located at 5501 Crowder will be very successful:

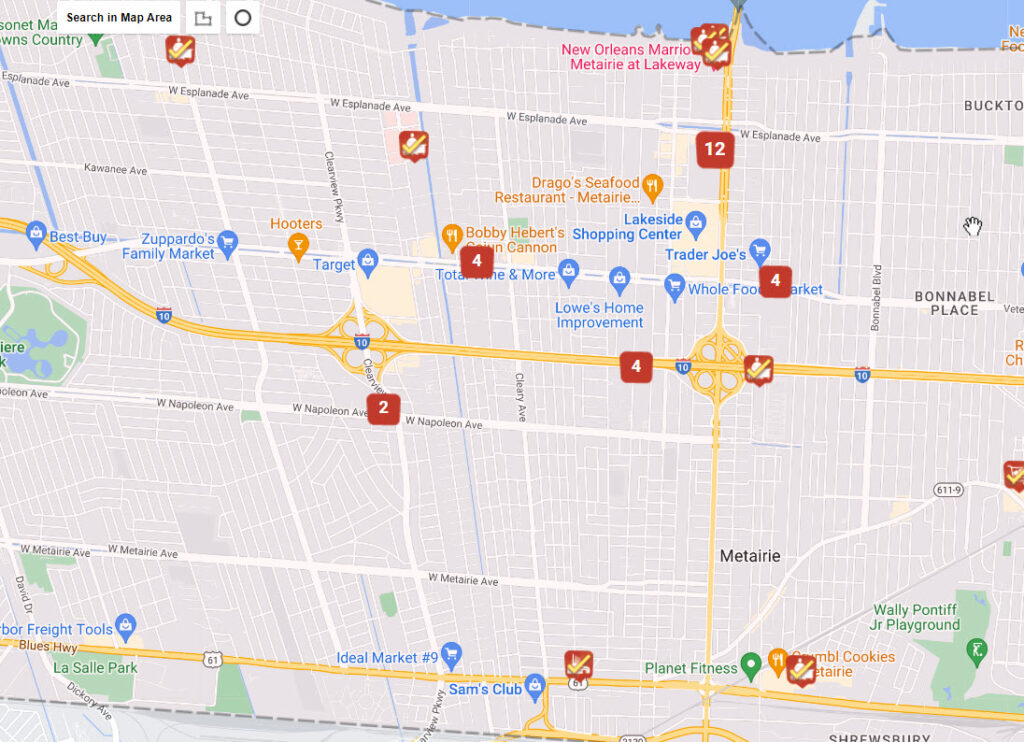
When we analyze demographics, usually we identify 3 areas within a 3, 5 and 10 mile radius from the target site, but this does not work in New Orleans because we have Lake Ponchartrain to the north and the Mississippi River to the south which biases that data. Instead, we utilize drive times, which is the time it takes to drive those distances. In the 5, 10 and 15 minute drive time map, the 5 minute drive time covers between the Industrial Canal and I-610 and above Almonaster Boulevard to the south. The 10 minute drive time extends into Gentilly Terrace to the west and Michoud to the east. The 15 minute drive time extends to include the French Quarter and Veterans Boulevard to Causeway.
Within a 5 minute drive time, the 2022 New Orleans East population of 28,139 has an average household income of $53,864 and a median age of 32. In addition, 31% of households had income over $50,000 and 87% of the 11,914 housing units are occupied with 46% of households owning homes.

The beauty of a free market economy is that you can own a business, grow it and benefit from your work because capitalism allows ownership of property, but it's not like that in other countries. Some still remember how government in Cuba took over property overnight, from homes to casinos, that was never recovered. China and Russia have similar histories, but there is a downside of having a free market economy: owning a business does not guarantee it will survive.
Recently, Covid brought misery to many businesses in our New Orleans tourism-based economy, but it also forced businesses to adapt, learning more about what their customers wanted and thinking outside the box to find a way to stay in business. For every restaurant that closed, there was another who treated staff like family who helped them keep the doors open. For example, the Winn-Dixie on Veterans blocked off part of their parking lot, not for customers, but for employees to get gas.
Restaurants learned to schedule work time according to when employees could promise to show up and work. Some restaurants shed paying for delivery since Uber took away profits, and developed their own delivery service. Other restaurants learned to prepare meals and have containers that kept foods hot during delivery. So the creative businesses must adapt to survive but the unimaginative, set-in-their-ways business fail, and fail they must so not to allocate resources inefficiently. And so was the Esplanade Mall in Kenner, Louisiana.

Esplanade Mall was sick long before it died. Mall owners failed to see a sea of change in demographics after Katrina. Back then, if you needed a roof repaired on your house, you couldn't get it done for months and months. There were not enough roofers to do the work.
Thank goodness we had help from Texas contractors who had the employees willing to do the work. I had contractors asking me to help them lease 20,000 square foot warehouses so they could have space for storage of roofing materials and for 20 roofers to sleep. "That's against code", I reminded them, but it was a clear example of what was happening.
Some of the workers who repaired your roof after Katrina were from Honduras who came here for a better life. They ended up living in Kenner which was the only place you could buy a house for $125,000. Kenner was affordable for the minimum wage residents we had. Thirty years later, we are still struggling to have enough affordable apartments for the minimum wage restaurant workers that drive our tourism economy.

The Esplanade Mall was 20 years old by that time but there was a demographic shift of residents in Kenner, and the Esplanade Mall owners failed to see it and adapt. Anchor tenants then were DH Holmes, Godchaux's, Mervyn's and Macy's a year later. Over the next decade, Macy's, Mervyn's and Godchaux's filed bankruptcy, Holmes was bought out, and the Mall owners failed to see the change in consumer spending and buying power of nearby residents.
Mall owners should have brought in tenants that offered goods and services that residents wanted. But rather than research what people would buy, they brought in tenants that sold what they wanted to sell. The result is that Esplanade Mall had to die.
This month the Esplanade Mall was purchased by Eddie Ni who has 20 years' experience with Windfall Group in Cleveland, Ohio, developing over 6 million square feet of commercial property. Eddie will convert Esplanade Mall into 800 apartments and new retailers. Nola.com asked Louisiana Commercial Realty broker Robert Hand about the $10 million purchase price financed by a $5.2 million loan from the seller:
"The good news for Kenner is that somebody has confidence enough to loan the money for this to happen," Hand said. "And ironically, the only person that had confidence is the person that didn't want the property anymore".
This is a story about property and people but also protecting the income of a retiring couple. In 2010, Louisiana Commercial Realty was asked by a residential agent to help find a buyer for a 2 story commercial retail and office property in Metairie, near Lakeside Shopping Center. We marketed the property and advertised heavily, selling the property for $830,000. Then we helped the new owner lease two vacant spaces, one space to a nail salon and the other to a dentist. Recently, that new owner sold the building for $1.5 million to a working couple investing their retirement savings in hopes of having rental income that would last their lifetime. The income would come from the nail salon and dentist who are still paying rent to this 3rd owner, but missing is the now vacant 2nd floor space, so the retirement income is $82,000 less than expected. The owner reached out to Louisiana Commercial Realty, finding us online and looking to benefit from our higher level of services to property owners. Here is how we started working on the project.
The first step in leasing office space is to put thought into the property to determine what the competitive advantage is. This means determining the strength of the property, which sometimes could be location but also could be the layout of the floor space, or parking, or proximity to highways, or humidity and temperature control, but not price-don't make price the only thing that is attractive.
Looking at this vacant space floor plan, the 13 offices are unusual in today's hyper-cyber work force. Long gone are the private offices because in demand today are open working areas where teams can collaborate and bosses can take a big conference room, put in 3 picnic tables, and have 20 employees working in the space previously for one. So this private office layout is antiquated, but there are industries that still prefer privacy. These 13 offices allow for 7 senior workers and 6 support staff, which is preferred by: attorneys, accountants, insurance and financial advisors. In this 1st step, we prepare a 10 page Marketing Plan which identifies these target markets, how we are going to reach them, and how we can reduce the normal 6 months time of lost rental income.
Take the first target market: attorneys, who we believe don't read their emails, so we snail-mail them a letter. There are 2,300 attorneys in New Orleans so we culled the list down to 600 for those with 7 or less partners and mailed each a letter and followed up with a phone call to let them know the space is available. We execute the same process for all four target markets. We don't know any other commercial real estate firm in the state that offers this accelerated process to their clients.
There are 201 spaces for lease in Metairie that compete for tenants for this vacant space, and the map shows there are 12 properties near Causeway and West Esplanade, three pockets of 4 vacant properties near Veterans and I-10 and 2 available properties on West Napoleon.
A decision on pricing must include an analysis of the market which is every nearby property that a tenant might consider when shopping for commercial property. The most difficult thing for owners to do is put themself in the tenant's shoes. Everyone thinks their kid is the smartest. As advisors, we provide valuable information to help our clients make better decisions, so in step 3 we survey the market and determine every single property that someone might also consider, then condense that data into something easily understandable. The result is a chart of the frequency of rent rates:
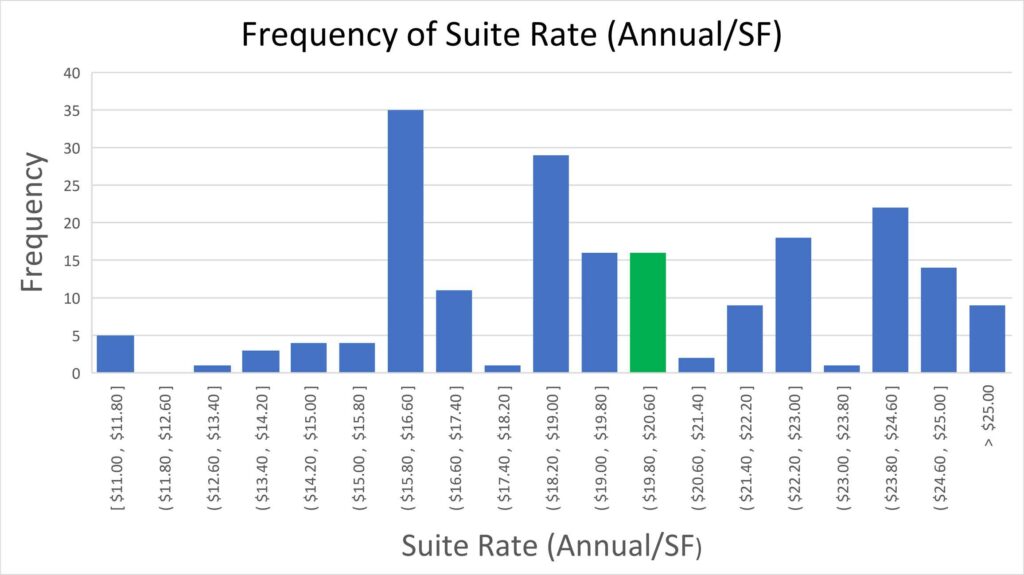
The data show that the lowest rents bundle at $15.80 to $16.60 per square foot, the middle group is around $19 per square foot and the top of the range is $23 to $24 per square foot.
In the Metairie Office market, as of December 2022, there are 255 properties totaling 957,000 square feet for sale at $149 per square foot and for lease at $20.22 per square foot and have been on the market an average of 250 days.

Of the 255 properties, 243 are for lease totaling 884,000 square feet and only 12 are for sale. The month of December saw 8 of those 243 spaces leased at a 5 percent discount or $19 per square foot.

You can reach tenants 90% of the time as they search online for space for lease, and get in their search results on page 1 using these 3 main commercial databases:
The Louisiana Commercial Database (LACDB.com) reaches 1,500 commercial agent members in Louisiana who have posted 8,539 listings, divided into 4,007 properties for sale and 4,532 for lease. The database also has 314 commercial listings in Mississippi, with 187 for sale and 127 for lease. Costs for subscribing to the database are $700 annually and agents must pay approximately $450 annually to join the local Association of Realtors before they can subscribe to the database. This database reaches Louisiana and Mississippi agents and brokers because subscriptions are the least expensive.
Loopnet.com has 1,100,000 properties listed by 300,000 commercial agents nationwide. The marketplace gets 11,000,000 unique visitors monthly. For its massive size, Loopnet.com only has 656 listings for sale and 981 for lease in Louisiana, but this database brings in tenants and investors both locally and nationwide. Loopnet offers subscribers just 10 listings for $8,400 annually and promises subscribers page 1 search results for a diamond subscription of $30,000 annually, making it out of reach for most local agents.
CREXI.com has 1 million commercial real estate agent subscribers but an average 2 million buyers, brokers, and tenants each month exploring over $2 trillion of property value nationwide. Crexi has 2,561 for sale in Louisiana and 3,126 for lease. Crexi Pro cost $2,700 annually.
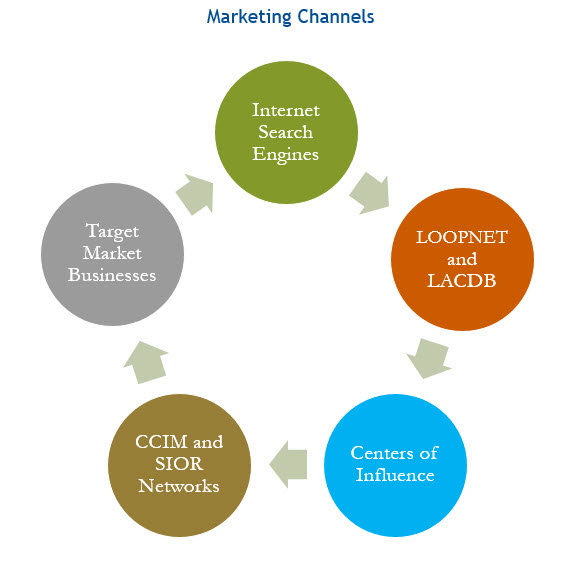
Our 5 core marketing tools, called “channels”, work in a cohesive fashion to bring maximum exposure to commercial property. For example, office tenants reach us about 90% of the time through internet searches so our marketing process drives that traffic to our Louisiana Commercial Realty website, plus commercial databases such as LoopNet, CoStar, Crexi and LACDB. The databases promote your listed space for lease, which gets the space in front of qualified prospects and entices them to ask for more information.
Normally we get your space in front of 4,000 to 5,000 office prospects. We capture the contact information of prospective tenants and follow up. Our direct targeting of prospects in addition to our affiliations with thousands of CCIM and SIOR members, who are the top commercial agents nationwide, tend to shorten the marketing period and deliver results more quickly, saving time and restoring income that normally is lost.
We provide regular reports showing the activity, which brings accountability to the marketing process. Property owners will know how many people are searching for property in this market and, of those, how many have inquired about their property and, of those, how many have reviewed the marketing presentation and toured the space. We update clients whenever the property needs to be toured and we always accompany prospective tenants.
![]()
ICSC is the premier organization for shopping center owners and real estate professionals, with over 70,000 members in 100 countries, so Louisiana Commercial Realty is excited to promote New Orleans at their Dallas conference this week and encourage national companies to bring their business to the Big Easy.
 Over 2,000 shopping center owners, big and small, attend the Texas oriented conference where property owners and prospective tenants are able to connect and discuss doing business together. Almost every city in Texas and these well-known companies are represented:

Since New Orleans is over 300 years old, Louisiana Commercial Realty zeroed in on the "Adaptive Reuse" session, where developers shared their secrets to getting old properties back into commerce. Wildcat Management explained how they were able to buy a historic building from the city for $1 and move it brick by brick to a impoverished neighborhood and put the property back into commerce and make the project feasible. Every developer shared that none of their projects would have been feasible without tax incentives and help from local economic development.
Louisiana Commercial Realty first put Adaptive Reuse into action several years ago with three projects in New Orleans.

Kroger, represented by Rita Williams, Director of Economic Development, shared how grocers are integrating technology into future plans. RFID's are dead because artificial intelligence can now analyze a shopping cart full of items and determine a price of an item by the shape of its box. Grocers all shared they are working to be nimble and always adapt. For example, Kroger is testing a social hour with a wine bar and local music in concert. The hope is to attract shoppers to the store for events they enjoy, and they will end up buying groceries. One challenge to adapting is how to reinvent at 120,000 square foot store.

Kroger explained that labor is still costly and hard to keep, but what employers are learning is how to be flexible, such as asking workers what schedule can they commit to working, and offering tuition reimbursement. Online sales are up 10% at Kroger, but Amazon has exploded with online visit growth 10 times that of Kroger.

It took over two years for Louisiana Commercial Realty to finally sell 18 acres of land in Covington, but there were some big obstacles to overcome including a wetlands determination, city council resistance, lawsuits between family owners and even a breach of an agreement by the city to provide utilities. The $2.2 million sale of the Privette land site at highway 25 and 190 was one of the largest parcels sold that was zoned as Regional Commercial and allowed a wide variety of commercial uses including medical clinics, multi-family, hotels, nursing homes and drive-thru restaurants.
The 18 acres comes with an interesting history, having been part of a 100 acre site owned by Richard Privette and his brother in the early 1900’s and was originally Covington’s first airport. The brothers built an airplane powered by a model T engine and flew it successfully in the 1930’s until it was destroyed by hitting a stump on the land where the Taco Bell now stands.
Grandpaw Privette's Model T Engine Airplane

While the average time it takes to sell vacant commercial land in Covington is 12 months, Robert Hand, a broker with Louisiana Commercial Realty, explains why it took almost 3 years to secure a buyer:
“We started by creating a marketing plan that included advertising the land to developers locally but also nationally. We stressed the strengths of the site, which were the size and demographics. Of the 122 vacant properties for sale, only 6 were this large and zoned for apartment development. We got the property in front of thousands of potential buyers and had the land under contract within six months, but that buyer was not able to secure financing, and after tying up the property for 18 months, they terminated the purchase. The silver cloud is that because we draft our own purchase agreements, we were able to get the buyer to pay $100,000 to our client for time extensions, and they were able to keep that money even though that sale fell through. We then re-marketed the property and were able to bring in two more offers within 8 months.”
The airport is long gone, and the land now is scattered with fast food restaurants, apartments and grocery store shopping centers, as a result of a growing Covington population. One of the common ways to measure population growth is by traffic counts, and the data show the intersection of highway 190 and 25 sees approximately 22,000 cars per day which is the highest count of any highway that feeds from Interstate 12.
Developers looking for potential sites will closely analyze population trends and this makes Covington an attractive location for retail and multi-family development. According to ESRI, a demographic research firm, the Covington population within a 5 to 10 minute drive time of the site is projected to exceed 14,500 in 2023, with 5,434 households that average $58,000 household income.
Covington 5-10 Minute Drive Time Demographics

Since developing a large parcel of land can include apartments, retail stores and shopping centers, with a total investment between $25 and $50 million, buyers first examine population trends to make sure their development is feasible. Broker Hand explains:
“We use the latest technology to determine what developments are feasible by examining consumer spending patterns; for example, within a 5 minute drive time of the site, the population spends more than average on gluten-free labels, asthma and arthritis drugs, contact lenses, and visits the ear, nose and throat doctor or their gastroenterologist more often than others in St. Tammany Parish. We discovered that health care spending was a major expense, with an average $39,000 annually spent on nursing home care, which was not only higher than the parish average but also higher than the national average. That research allowed us to target those markets as buyers.”
Where Do Nearby Residents Spend Their Money?

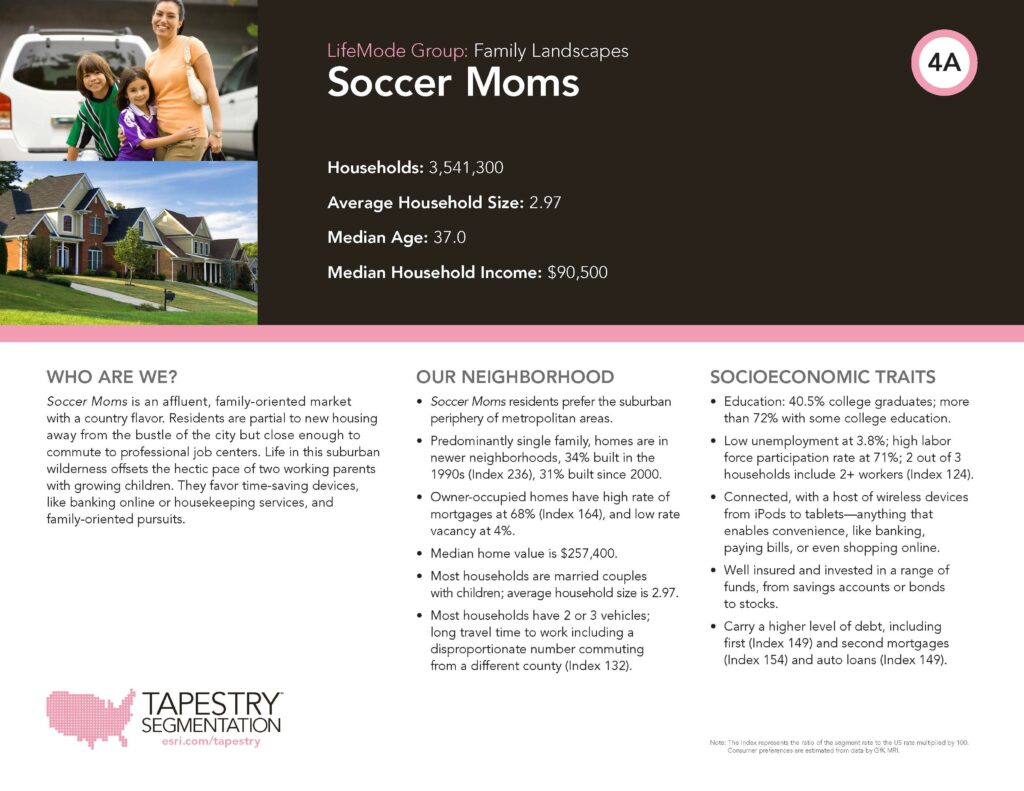
In addition to income, age and population trends, the latest technology allows buyers to understand the lifestyle of the nearby population, which in turn helps visualize what businesses are feasible to serve the existing population and therefore might be the most successful. This technology, called Tapestry Analysis, breaks down the entire U.S. population into 62 categories, depending on leisure activities, spending, interests and a person’s goals and desires. The 3 most common tapestry groups for this site are Soccer Moms, Family Foundations and Salt of the Earth.
Tapestry Groups

Soccer Moms is defined as an affluent, family-oriented market with a country flavor. Residents are partial to new housing away from the bustle of the city but close enough to commute to professional job centers. Life in this suburban wilderness offsets the hectic pace of two working parents with growing children. They favor time-saving devices, like banking online or housekeeping services, and family-oriented pursuits.
What Is A Soccer Mom?
In summary, gone are the days of just putting a sign up to sell commercial property. Today, buyers can use sophisticated technology to determine consumer spending which determines what businesses will succeed, allowing them to be more confident about investing their $50 million.
After a two year search for the perfect location, the owner of Sukho Thai restaurant finally found a permanent home, with some help from commercial real estate broker Louisiana Commercial Realty who researched potential locations and provided data on which neighborhoods spent the most money dining out. Broker Robert Hand with Louisiana Commercial Realty explains how they got started, “We helped Sukho Thai in the past when they wanted to expand to the French Quarter and we negotiated the acquisition of the 2200 Elysian Fields location which has been very successful, so they asked us to help them purchase a building rather than continue to rent space at their Magazine location.”
While many restaurants closed due to Covid and everyone struggled with finding employees, Sukho Thai pivoted and focused on take-out and delivery. During Covid, their revenues actually increased, with take-out and delivery increasing more than in-house dining decreased. They even adapted delivery to in-house since Uber Eats, DoorDash and Waitr costs were shared by the restaurant and almost eliminated any profit.
The search for a permanent home initially included every building listed for sale on Magazine Street and even a few unlisted buildings that Louisiana Commercial Realty knew could be a good fit. After flushing out those possibilities, which took about a year, the search expanded to the Lakeview area with a few possibilities on Harrison Avenue. Negotiations with property owners hit a dead end, so Louisiana Commercial Realty widened the search to Harahan and then to the Kenner area, which showed as having a population that spends less money on dining out annually per family but offers a larger population, so the total spending numbers are attractive for a restaurant. The table below is one example of the research, showing the Williams Boulevard target site as having the lowest household income but has the highest total spending at dinner and lunch due to the higher total population.

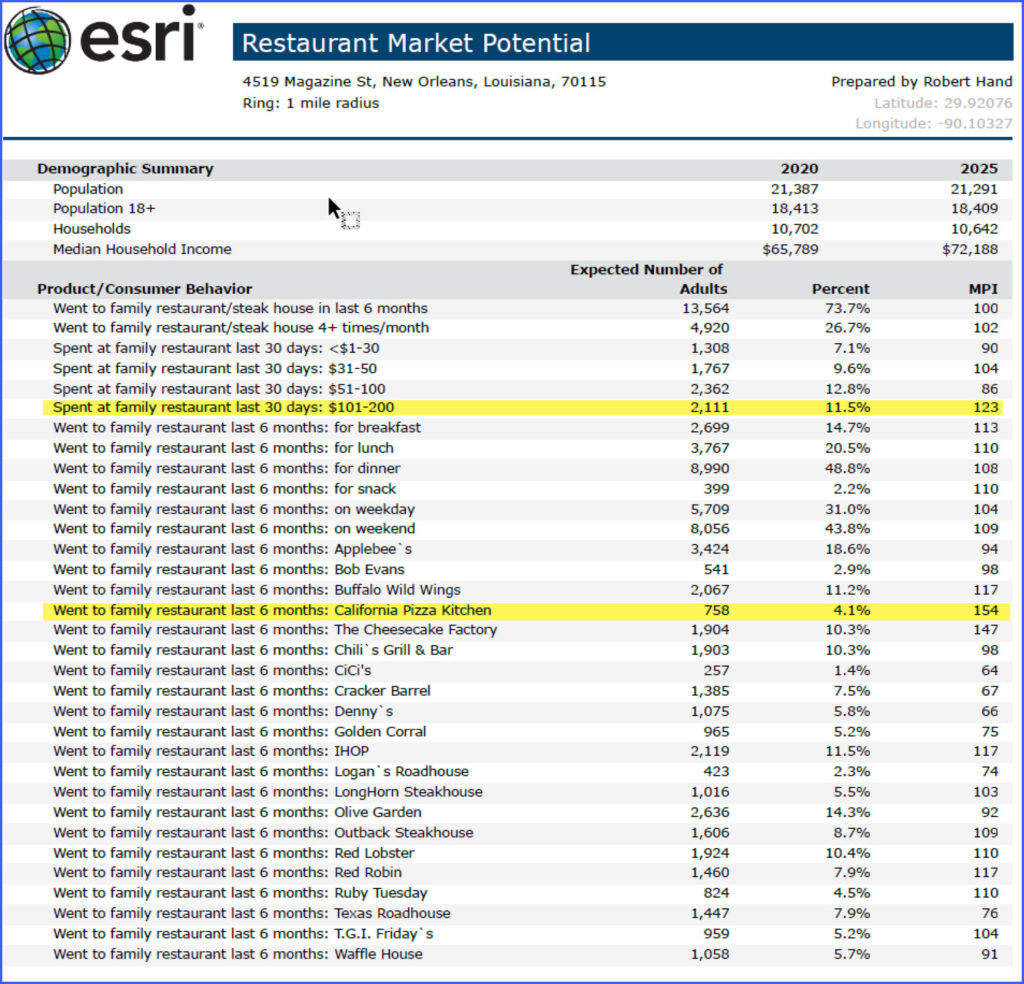
Louisiana Commercial Realty also provides a "Restaurant Market Potential Report" that includes what restaurant brand residents visit most often, how much they spend, and how that compares to a national average. The table below shows an analysis of Sukho Thai's current Magazine Street location. Broker Hand says, "The data available to restaurants today is spectacular. We can not only tell the total spending on dining out, we can discover how many adults visit a restaurant, how much the average family spends per visit, how often they visit, and the brand of restaurant they visit most often, and we can zero in on any 1, 3, 5 and 10 mile radius or drive times for any location."
The data show that at this location, 2,111 adults, which are only 11 percent of the population with one mile, spent $101 to $200 per visit, which was the highest spent at a family restaurant. Also, within the last 6 months, we know that the most popular type of restaurant served pizza. This is measured by the Market Potential Index (MPI) which tells the relative likelihood of the adults in the specified trade area to exhibit certain purchasing patterns compared to the United States. An MPI of 100 represents the U.S. average, so a score of 154 tells us that a pizza type restaurant in this location is visited 54 percent more than average.
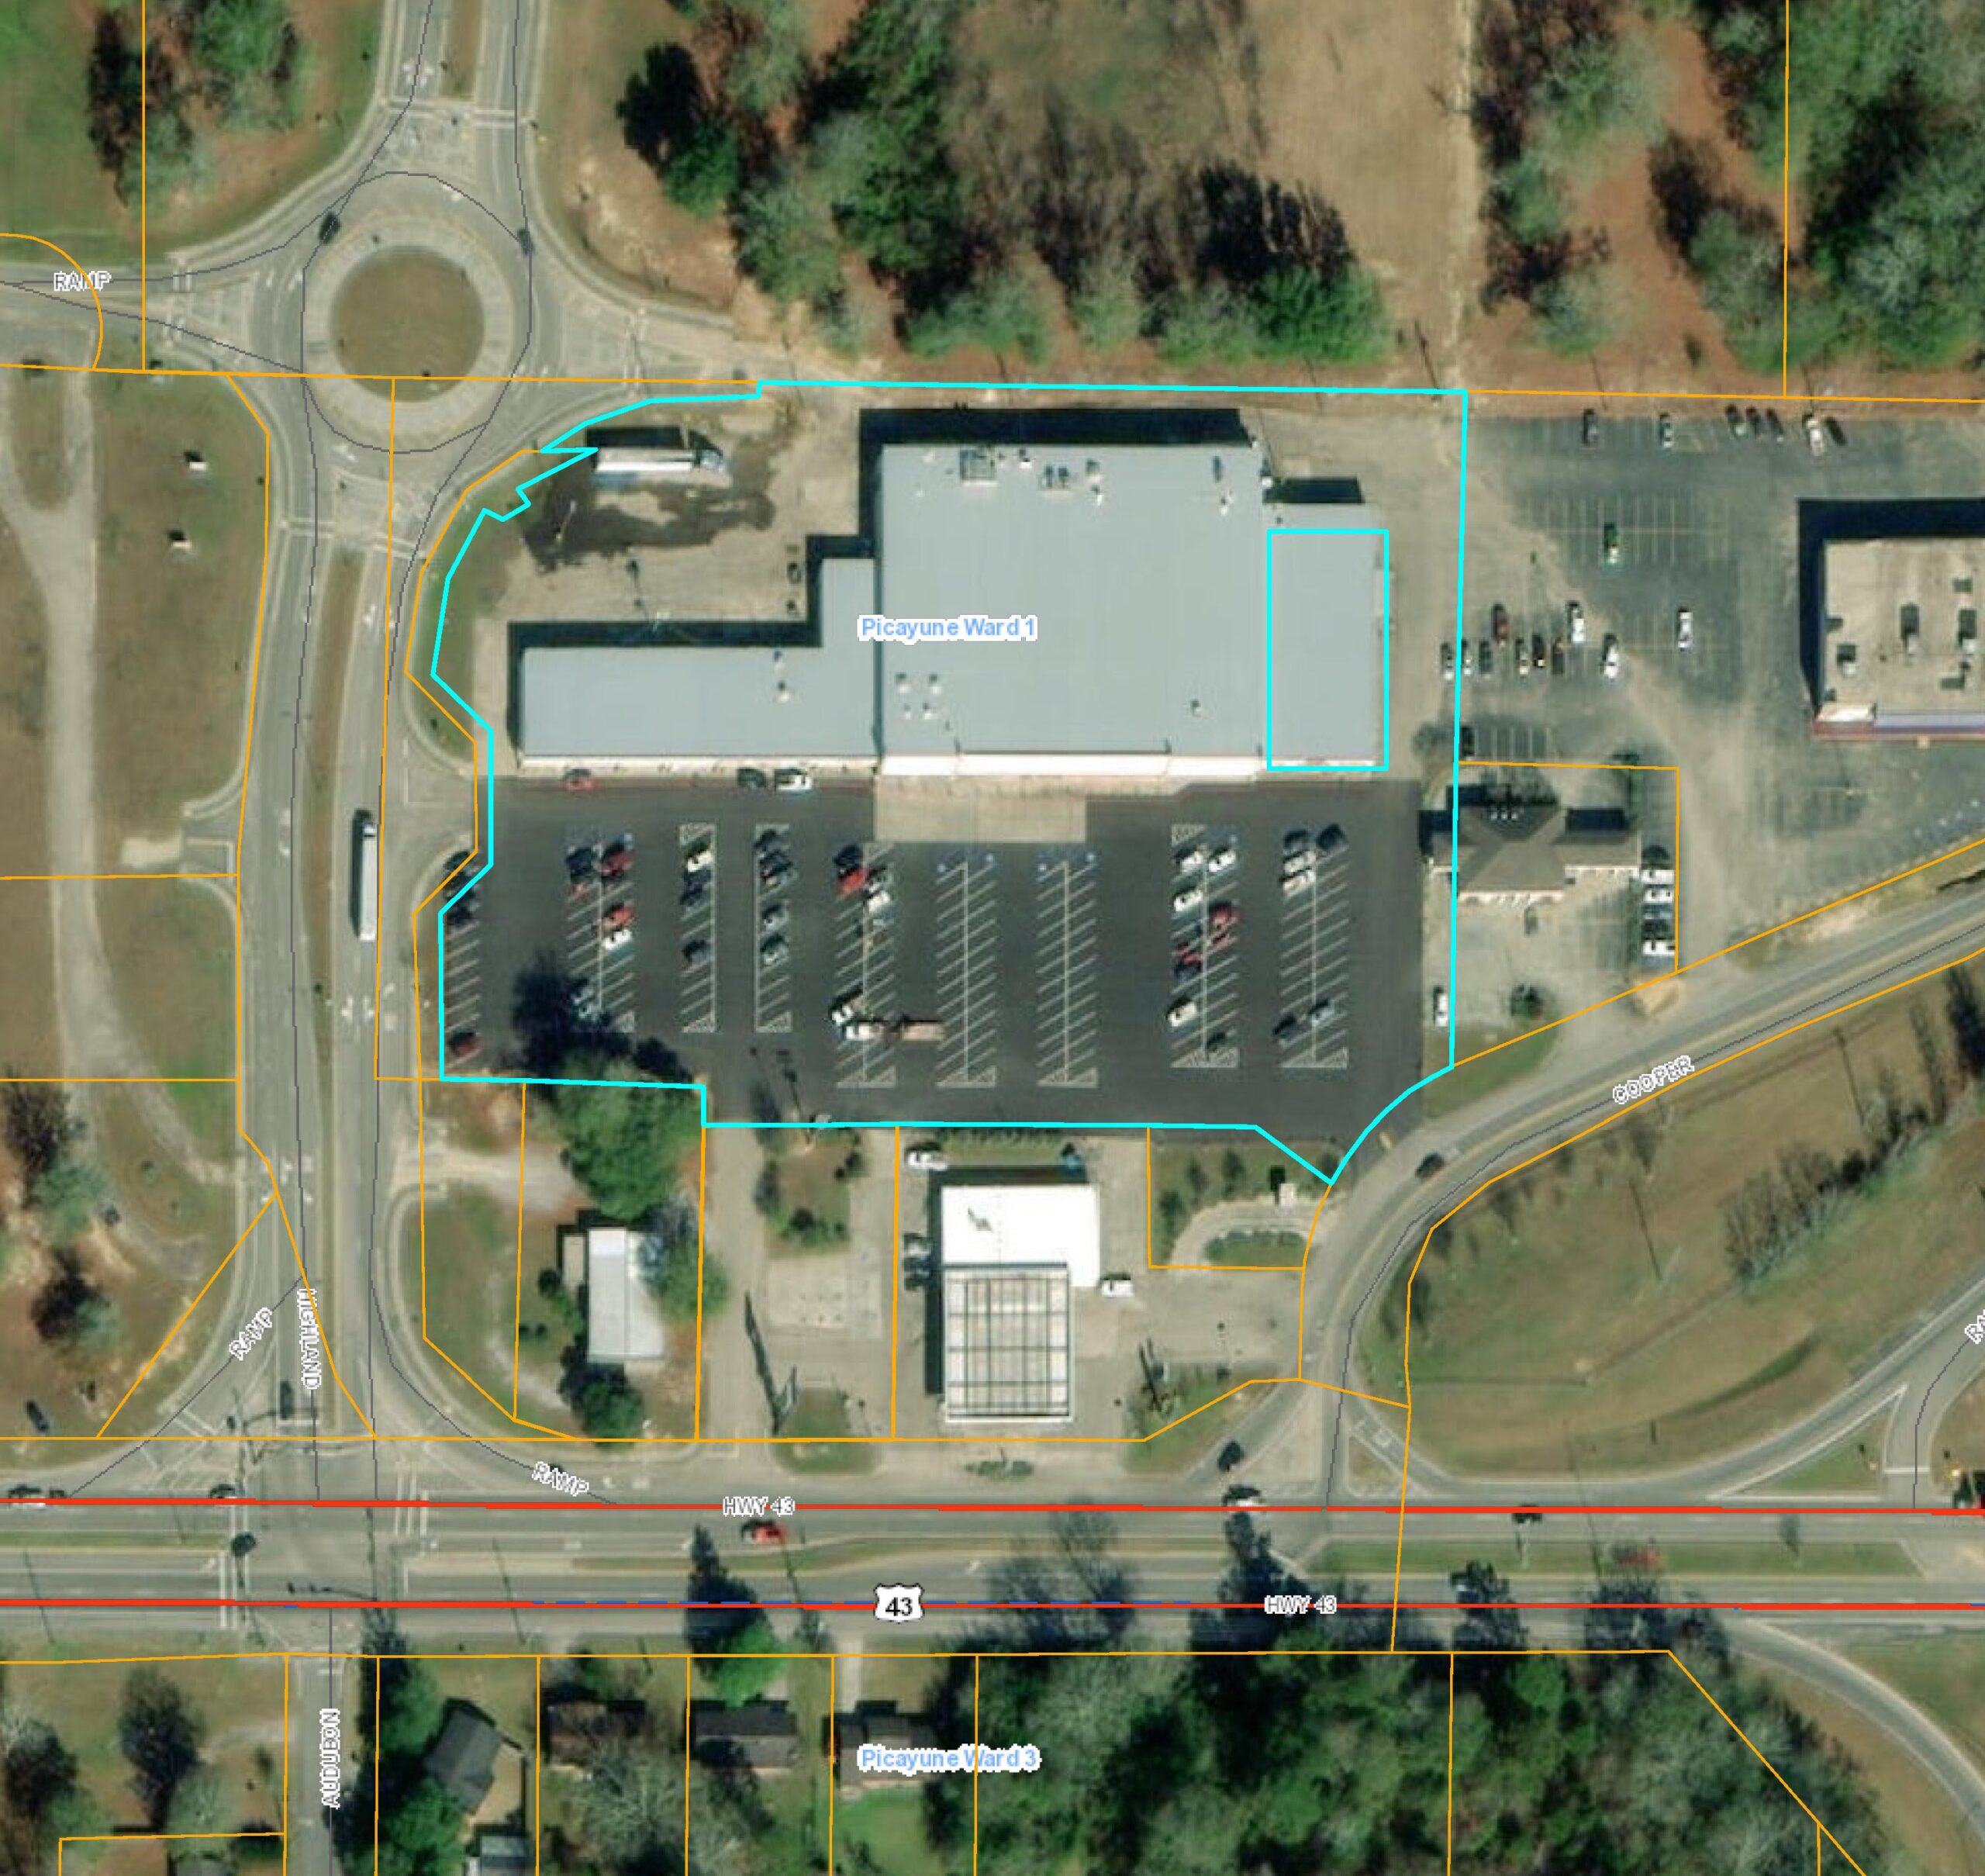
Mississippi Commercial Realty, a Hattiesburg based commercial real estate brokerage firm, announced the sale of the 60,000-square-foot River Ridge Shopping Center in Picayune, Mississippi, to Rouses Markets, which is the fastest growing family-owned grocer in the United States. The Picayune store will be the first venture for Rouses north of the Gulf Coast in Mississippi and adds to Rouses’ 64 stores stretching from Lafayette to Orange Beach, Alabama. The new Rouses Market store will occupy the 36,000 square feet within the property that was previously home to a Winn Dixie grocery store.
The new location was made possible because Winn Dixie closed their Picayune store and the space has been vacant for years. That’s when the shopping center owner, who was unsuccessful in leasing the space, hired Mississippi Commercial Realty to find a tenant. Commercial real estate broker Robert Hand, with Mississippi Commercial Realty, explained how they do things differently: “Gone are the days of just putting a sign up. In this market, the data show the average time to sell or lease commercial property is twelve months, so we offer a more aggressive marketing strategy that tends to shorten that lost time. We use the latest technology to identify the most qualified buyers and tenants. For example, with the Picayune property, our research showed consumer spending within a 15-minute drive time was $56 million in the ‘Food at Home’ category (See Table)”.

How Much Do People Spend On Food Within 15 Minutes Drive Time?
Hand explains, “So we reached out to all the grocers and made sure they knew the vacant space would make a feasible location. Within three to six months after starting, we were able to get two offers to buy the shopping center and also two offers to rent all the remaining space.”
Initially, Rouses was interested in just leasing the vacant space, but when they looked at the value they would create by occupying the vacant space, they realized owning the entire shopping center was a smarter business decision. Rouses plans to make significant improvements to the entire shopping center and expects customers will also enjoy the services of the other stores: Subway, Century 21, CVS Pharmacy, Mississippi Home Care, Ciao King Restaurant and Nail Expressions.
New Orleanians always ask why we can’t get businesses to move here. The answer is that people don't move here. Businesses follow population but population comes first. If you want to revitalize areas such as New Orleans East, you need more people to move there and New Orleans businesses to stop leaving. The numbers are backed up by solid research from The Data Center in their publication: New Orleans Population Shifts.
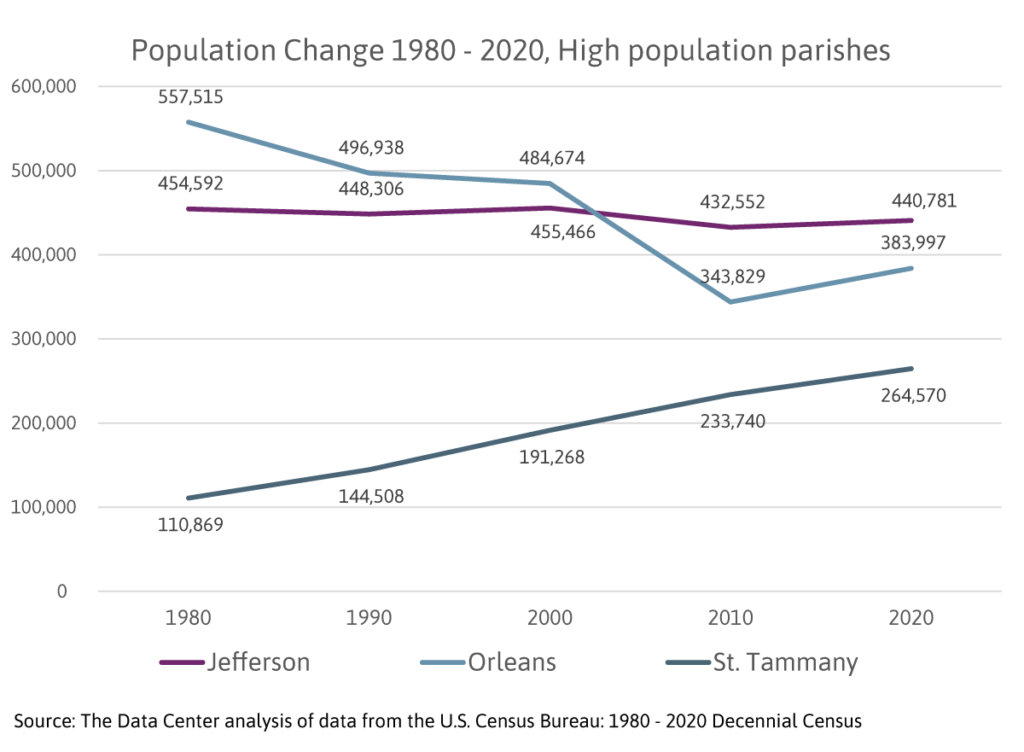
New Orleans has over 150,000 fewer residents than in 2000 and remains at less than 80% of its pre-Katrina population. Jefferson Parish’s population is relatively stagnant, gaining 8,229 residents this past decade but remains just under 15,000 shy of its pre-Katrina total. St. Tammany Parish continues to boom, adding 30,830 residents this last decade after gaining 42,472 between 2000 and 2010.
We need a plan to grow New Orleans. It’s easy to do. We built a tourism economy based on people coming to visit to enjoy our music and food and fun but we aren’t doing what is needed to get them to stay. We just need to do what other cities are doing to attract people and take positive action. If you look at Atlanta, Austin, Houston and Nashville, they are focusing on taxes, crime and education and the results are jobs and population explosion which leads to business growth.
For more information on what businesses are feasible for the new New Orleans, read our article: What Businesses Will Thrive In New Orleans.
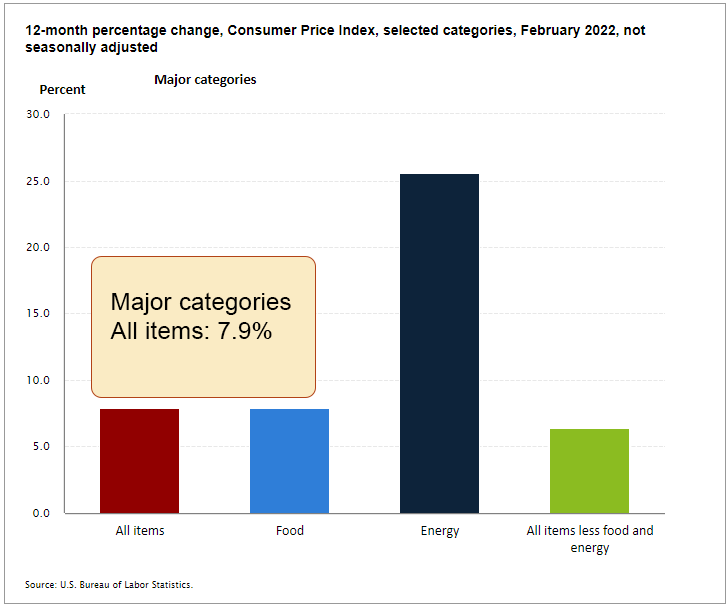
A few weeks ago the U.S. Bureau of Labor Statistics announced inflation rose 7.9 percent from February 2021 to February 2022, the highest increase since January 1982. That was the month Dwayne Wade, Pete Buttigieg, Kate Middleton and the Commodore 64, an 8-bit home computer, were born, and the year Michael Jackson released "Thriller", Epcot opened and the movie ET made its debut. Unemployment in 1982 was 9.7 percent, the prime rate was 17 percent and Ronald Reagan was president. It was 40 years ago, so today's high inflation period is more of an outlier than a persistent trend. In this article, Louisiana Commercial Realty looks at the components of inflation and how the way you quote it can be misleading.
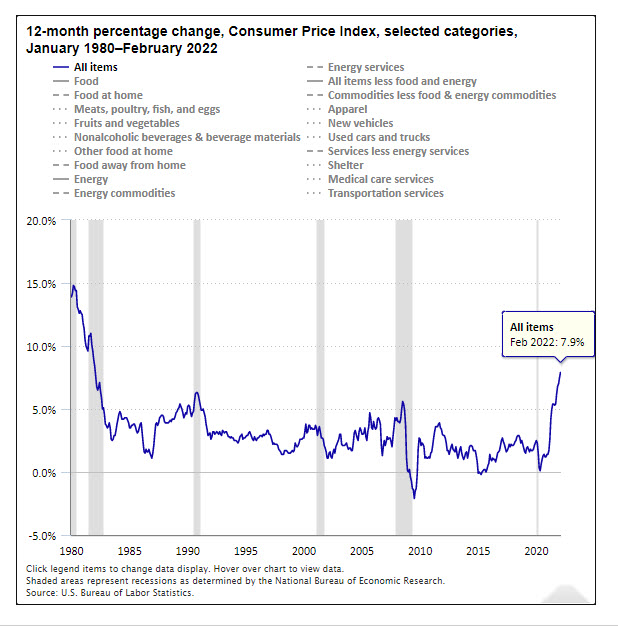
Price increases for gasoline, shelter, and food were the largest contributors to the Consumer Price Index, which is how we measure inflation. The chart above shows inflation over the last 12 months and the major components that comprise the index. Here is how those components have performed:
For the month of February 2022:
For the 12 months ending February 2022:
The table below shows the components of the CPI and their performance each month from August 2021 to February 2022, plus each component's price increase for the last 12 months. Notice how each month can have a wide variety of price increases but can also have price decreases. Don't be misled when your TV news announces an inflation number for one month and extrapolates that into an annual CPI number. You cannot do the math that way.
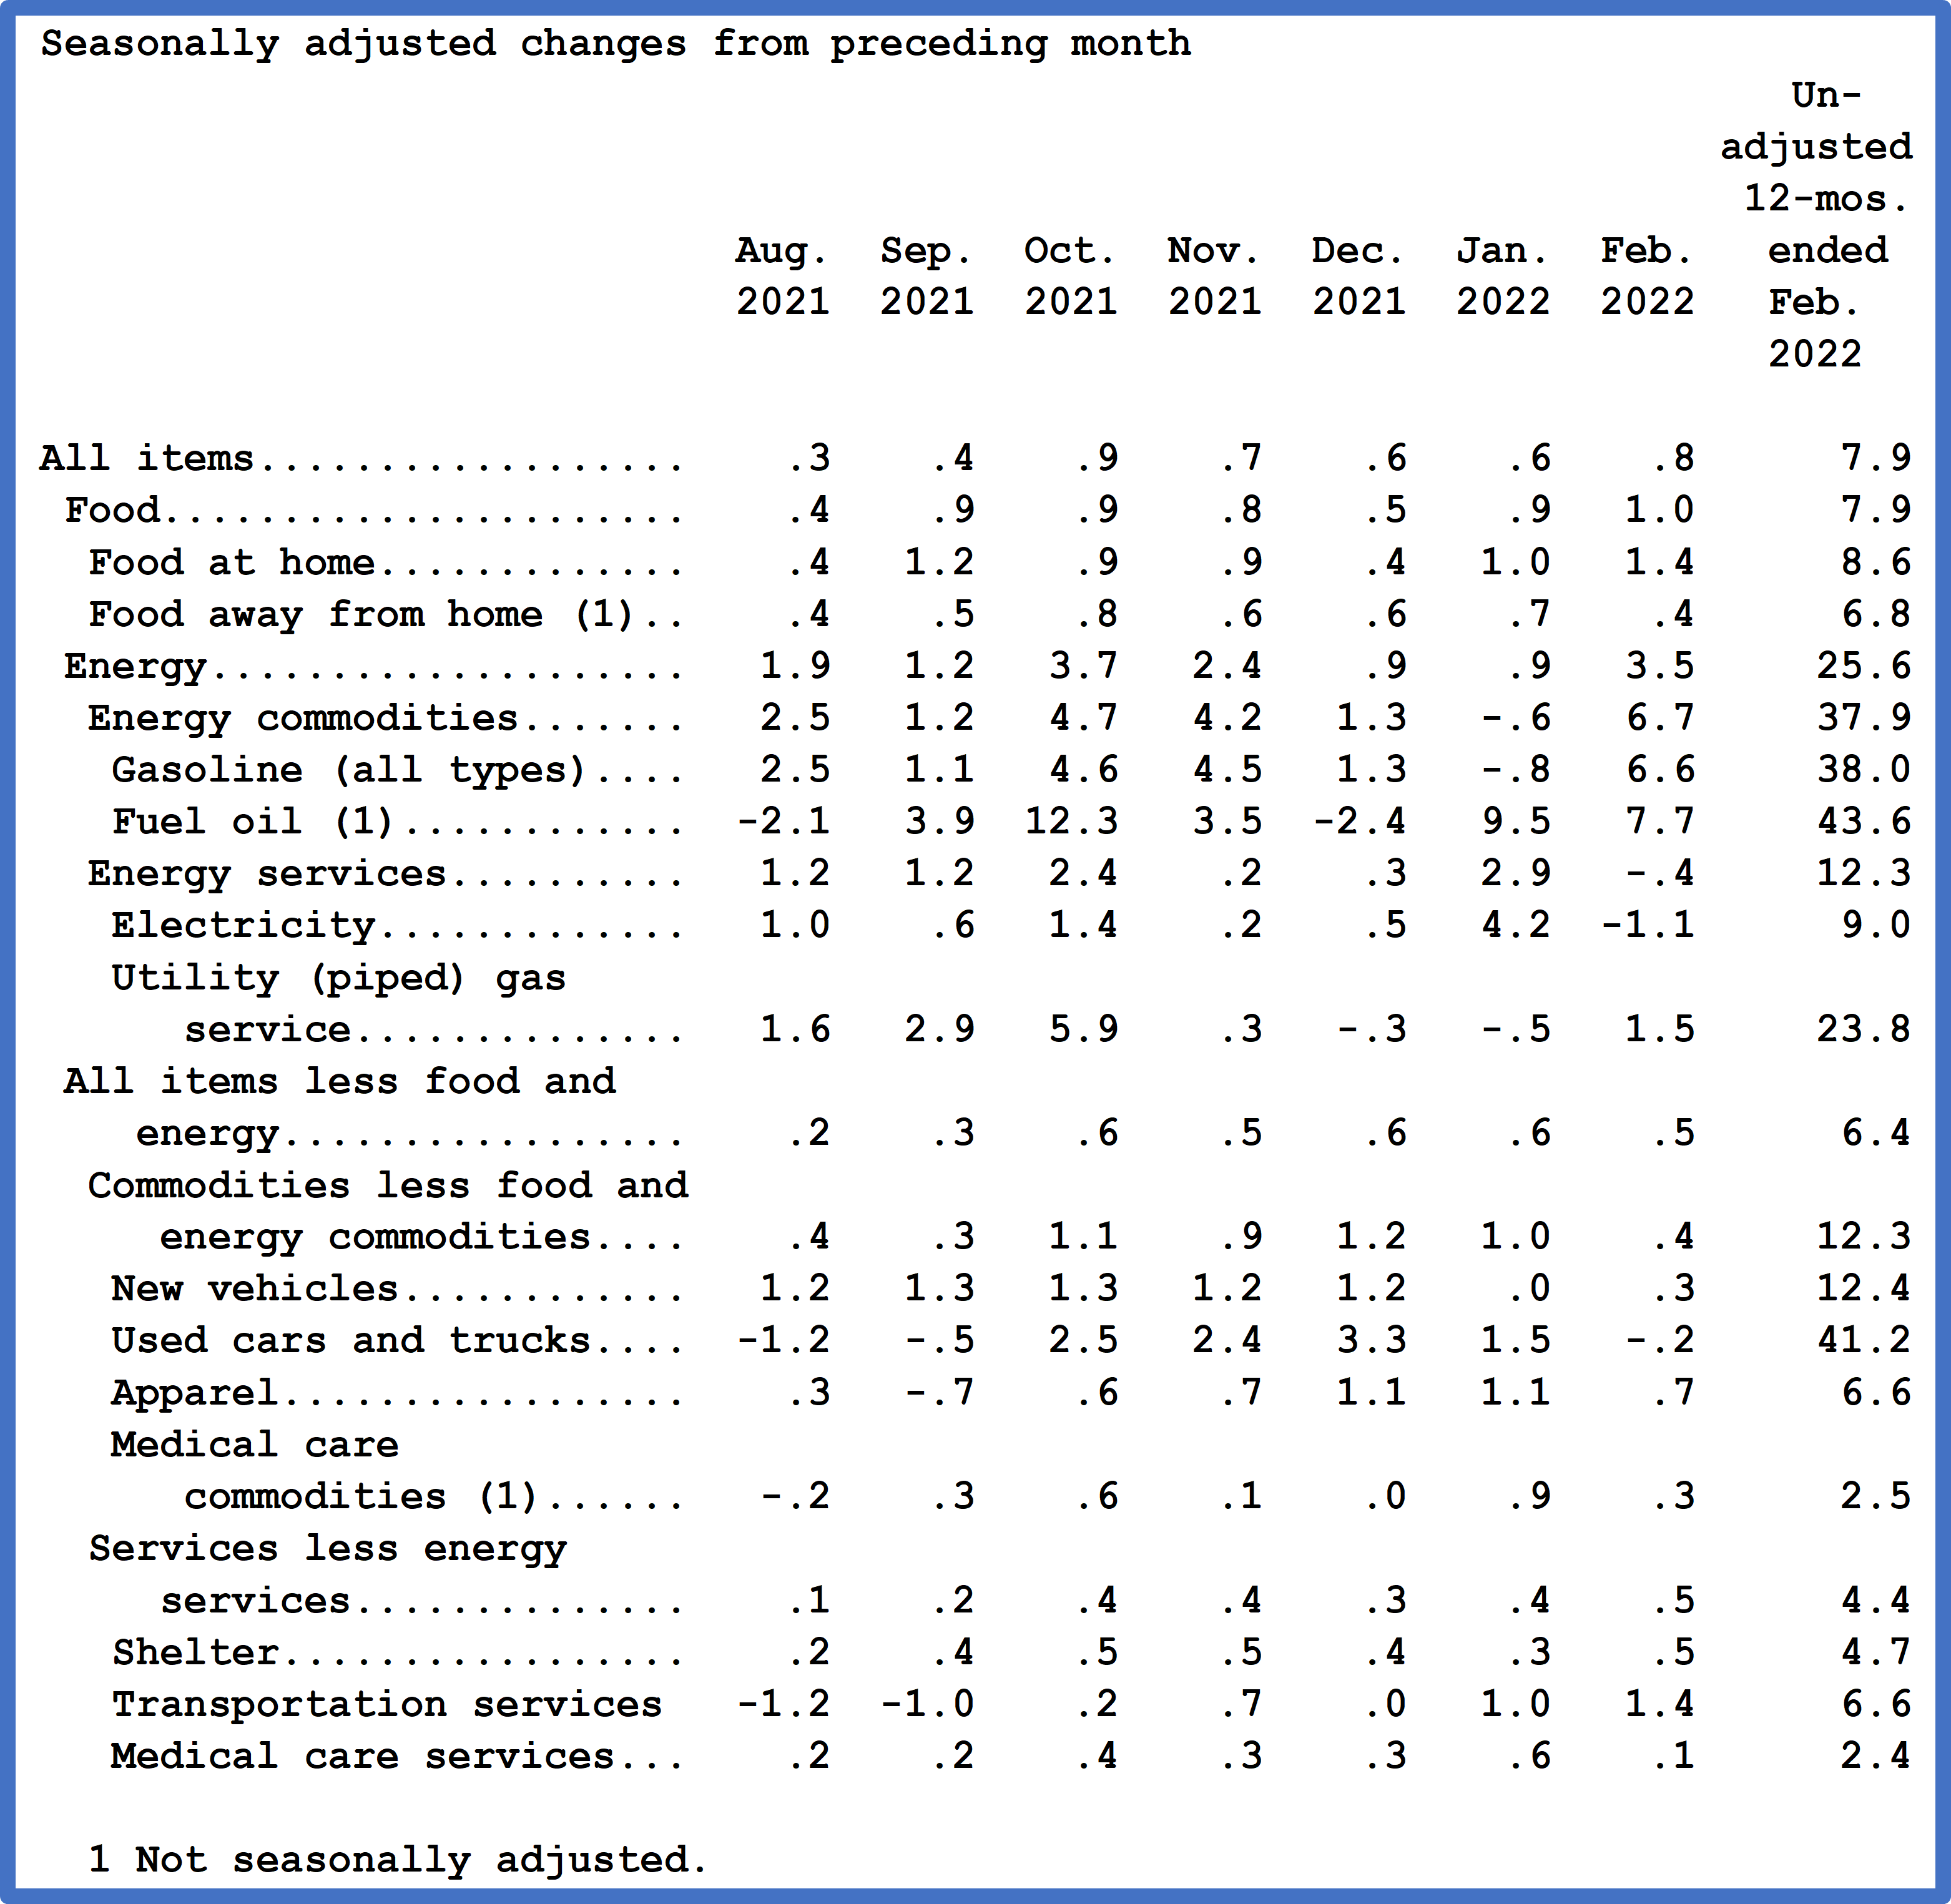
The food index increased 1.0 percent in February and the food at home index increased 1.4 percent over the month. All the major food group indexes increased in February:
Price increases for the month of February varied for these components:
For the last 12 months:
The index for all items less food and energy rose 6.4 percent over the past 12 months, with all of its major component indexes rising. The shelter index rose 4.7 percent over the last 12 months, its largest 12-month increase since May 1991. Several transportation indexes showed large increases over the past year, including used cars and trucks (+41.2 percent), new vehicles (+12.4 percent), and airline fares (+12.7 percent).
For February 2022:
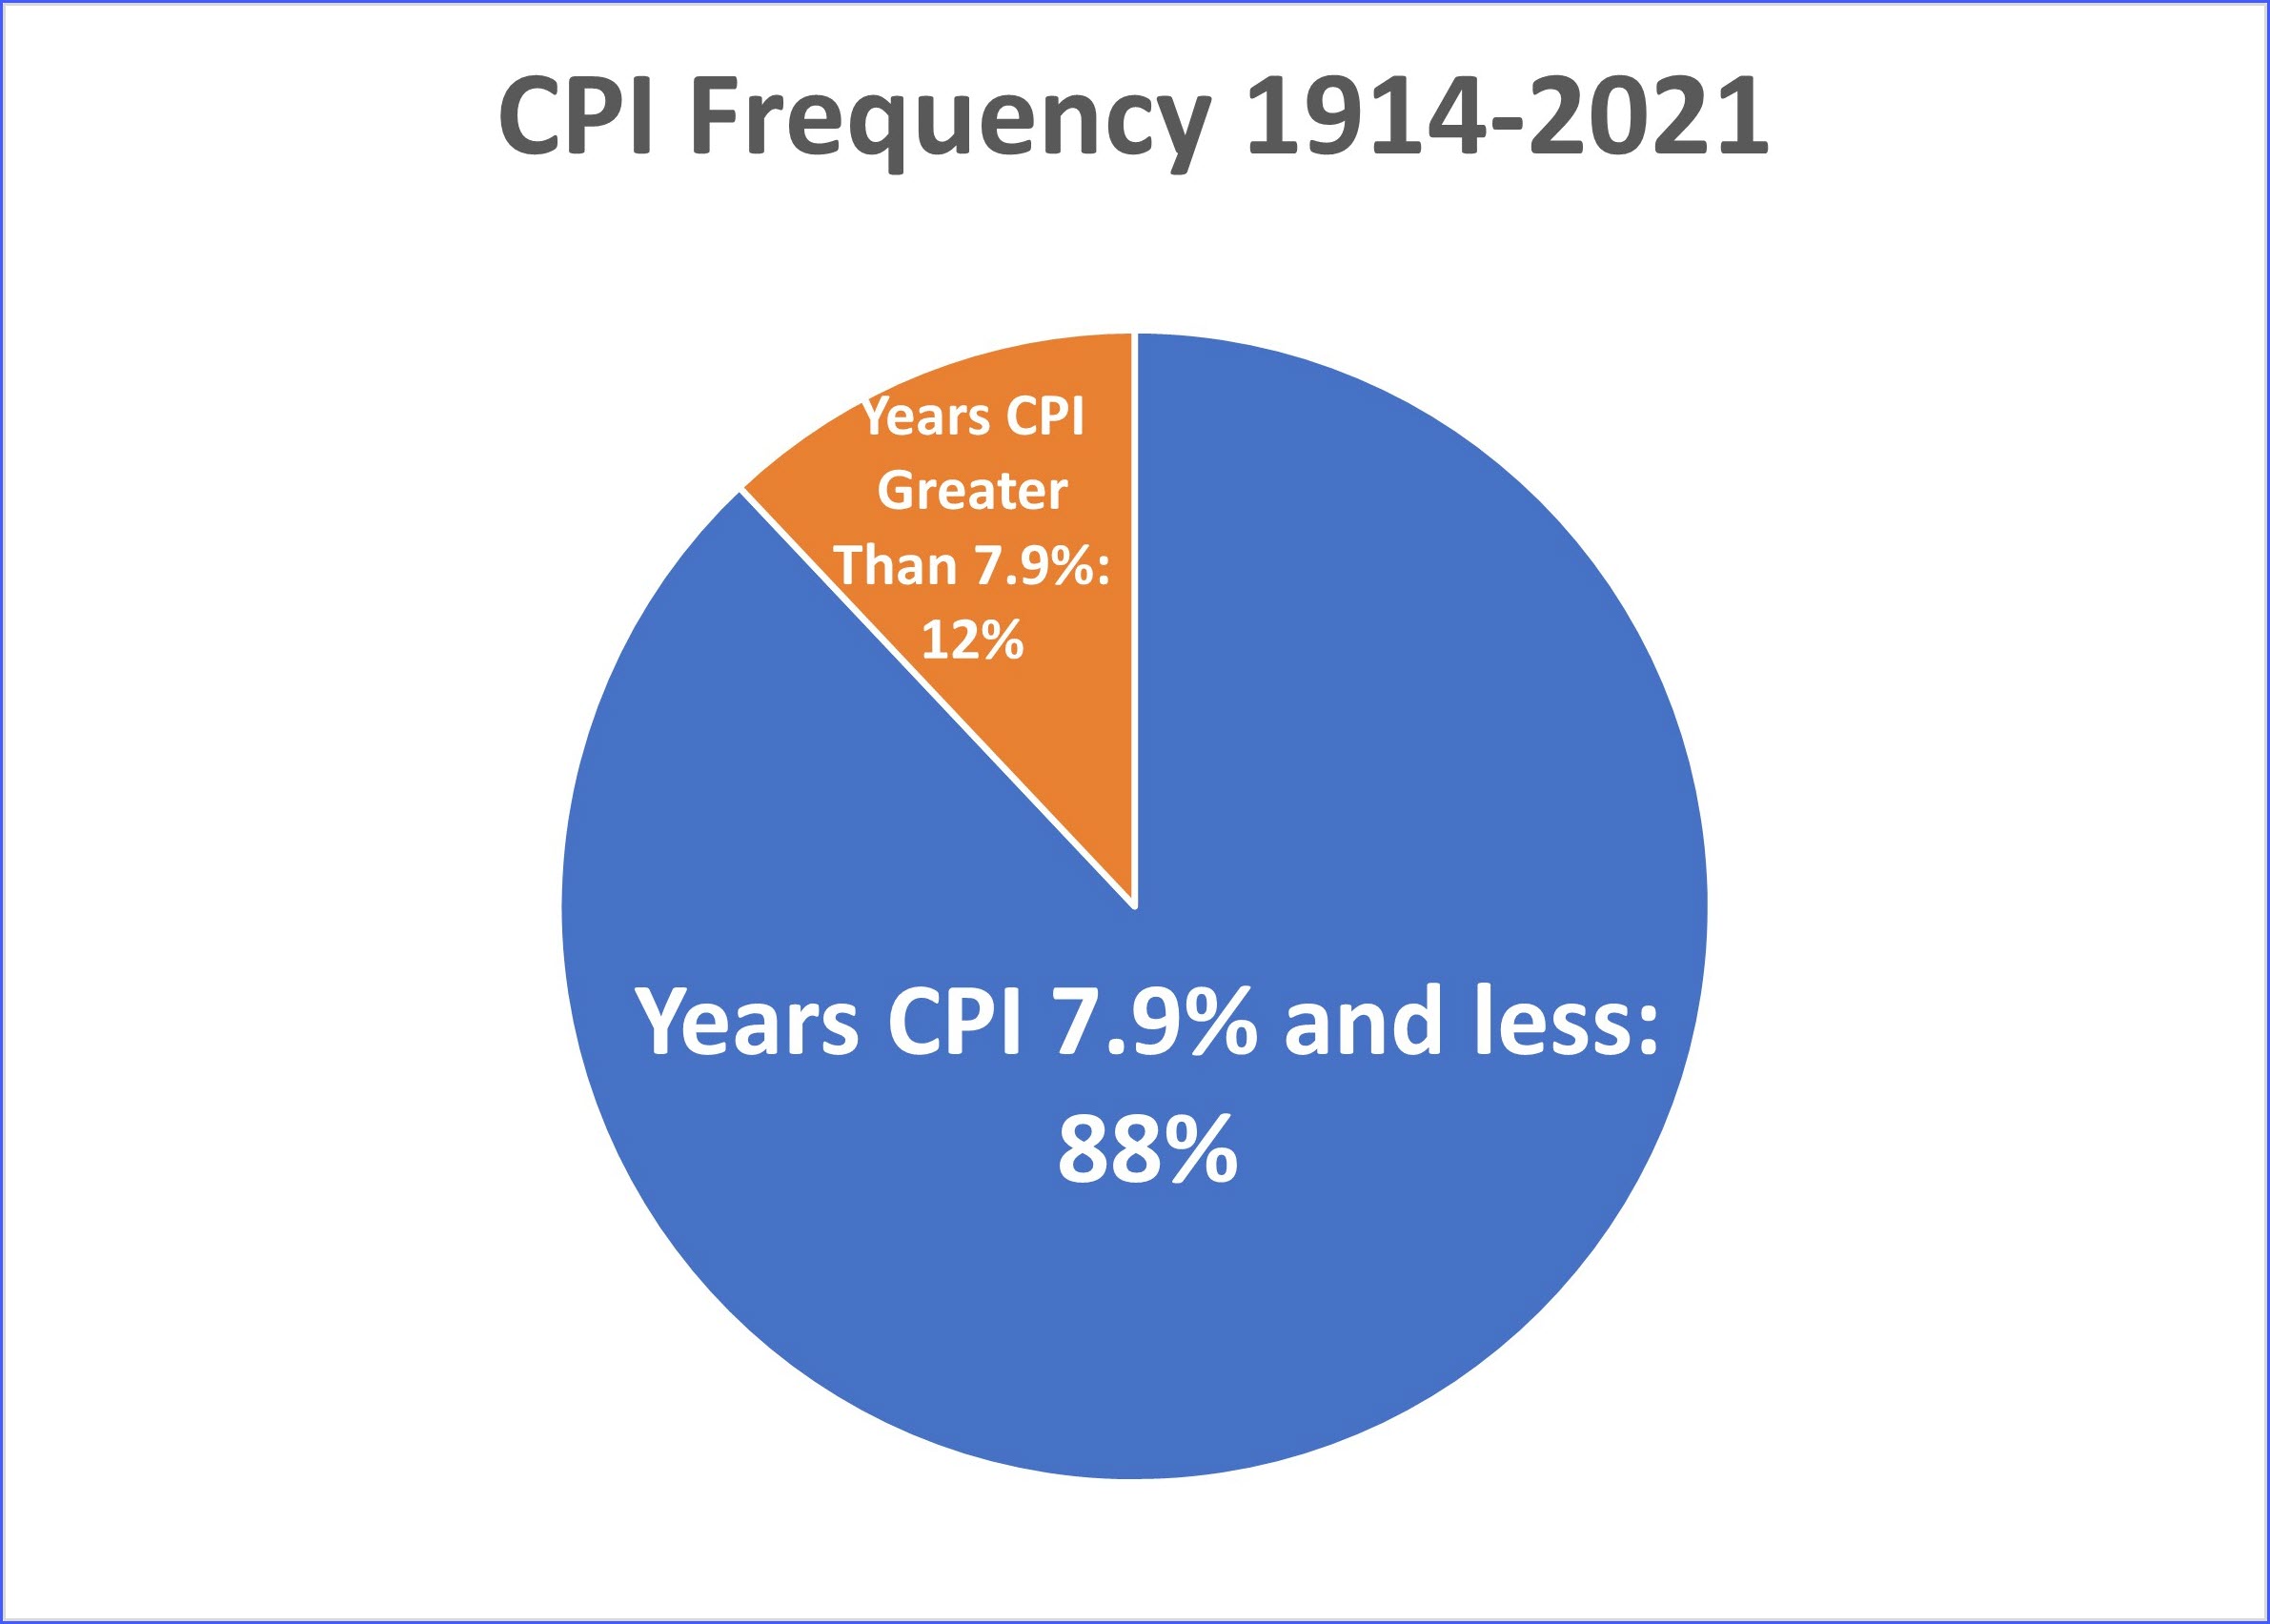
The Consumer Price Index is calculated as a single number but is actually 8,018 items grouped into major components which are each affected by supply and demand in their own way, resulting in some components increasing in price rapidly while at the same time others can decrease in price. Since 1914, the CPI has only been above 7.9 percent 12 percent of the time, so the inflation period we have only experienced the last 6 months will not last much longer. In the last 108 years, there have only been 7 periods when inflation was 7.9 percent or higher, with the average period lasting 26 months. These were all periods experiencing an imbalance of supply and demand due to external forces of world wars or a sudden OPEC oil embargo. The beauty of a free market economy is that these supply and demand imbalances are eventually corrected by entrepreneurs and businesses, each acting in their own best interest and motivated by ownership which provides an incentive to compete to provide the best product at the lowest price, which results in bringing prices back into equilibrium.
For more info on how inflation affects commercial real estate, read our article:
3 Common Mistakes In Every Lease

Whether you rent office space, a warehouse, or a retail store, your real estate lease probably has language that ties the rent you pay to the Consumer Price Index. The idea is meant to benefit only the landlord, and helps the rental income retain its purchasing power. The problem is that there is more than one Consumer Price Index and there are different ways to calculate each, so make sure your lease agreement contains language that is very specific. One example of lease language referencing the CPI is:


Method #1-All Urban Consumers (Current)-Consists of all urban households in Metropolitan Statistical Areas (MSAs) and in urban places of 2,500 inhabitants or more. Nonfarm consumers living in rural areas within MSAs are included, but the index excludes rural nonmetropolitan consumers and the military and institutional population.

Method #2-Urban Wage Earners and Clerical Workers (Current)-Consists of consumer units with clerical workers, sales workers, protective and other service workers, laborers, or construction workers. More than one-half of the consumer units income has to be earned from these occupations, and at least one of the members must be employed for 37 weeks or more in an eligible occupation.

Method #3-All Urban Consumers (Chained)-The urban consumer population is deemed by many as a better representative measure of the general public because 90% of the country’s population lives in urban areas. Using chained CPI means the rate at which Social Security benefits tick up would be slower, because it reflects substitutions consumers would make in response to rising prices of certain items. Therein lies the “chained” part of the name. The metric utilizes a basket of goods and services that are measured changes from month to month; much like a daisy chain. If the cost of a certain form of transportation goes up, for example, people might switch to another kind. This kind of “substitution” is part of what is factored into chained CPI.

Method #4-Average Price Data-Calculated for specific items such as household fuel, motor fuel, and food items from prices collected for the Consumer Price Index (CPI). Average prices are best used to measure the price level in a particular month, not to measure price change over time.

In calculating the CPI, the urban portion of the United States is divided into 38 geographic areas called index areas, and the set of all goods and services purchased by consumers is divided into 211 categories called item strata. This results in 8,018 (38 × 211) combinations.
The CPI is calculated in two stages. The first stage is the calculation of basic indexes, which show the average price change of the items within each of the 8,018 CPI item-area combinations. At the second stage, aggregate indexes are produced by averaging across subsets of the 8,018 CPI item–area combinations.
Percent changes for periods other than 1 year often are expressed as annualized percentages. Annualized percent changes indicate what the change would be if the CPI continued to change at the same rate each month over a 12-month period. These are calculated using the standard formula for compound growth:

The CPI represents all goods and services purchased for consumption by the reference population with all expenditure items divided into more than 200 categories, arranged into eight major groups. Major groups and examples of categories in each are as follows:
The Bureau of Labor Statistics, under the Department of Labor, releases the latest Consumer Price Index numbers, using the All Urban Consumers Index which increased 0.8 percent in February 2022, but this was for only one month. The seasonally adjusted CPI number for the last 12 months increased 7.9 percent, due mostly to an unadjusted 38 percent increase in gas and a 41 percent increase in used car prices.
Some categories increased prices dramatically the last month while other category price increases were small, which is why the CPI can be misleading. The categories of gas and fuel oil increased the most; however, the categories of medical care and food away from home increased only slightly and electricity and used car prices actually fell. These numbers are only for one month, and a commercial real estate lease should use the annual number. The all items index rose 7.9 percent for the 12 months ending February 2022, but the index for all items less food and energy rose 6.4 percent. The food index rose 7.9 percent while medical care prices only rose 2.4 percent.

Inflation is not what it used to be. In the 1980s the CPI approached 20% and the greatest economist alive said it was going to 25 percent. It went to 2 percent. Our economy today has been driven by a different wage/price spiral over the last 40 years, resulting in low inflation which helps borrowers but hurts landlords and savers. Building in a CPI adjustment can still make a difference in a long term real estate lease, as shown in the table below which compares a 1 percent CPI to a 2 percent CPI adjustment over a 25 year time frame. In the scenario below, 1 percent incremental rate increase annually results in $378,000 additional income over the 25 year span, and assuming a 10 percent Capitalization Rate, increases the market value of the property $338,000, or 26%.

In leasing any type of property, whether you are the landlord or the tenant, make sure your lease is clear about what the rent is, and what inflation adjustments apply to the rent. Even though some parties say they use a standard lease, there is no such thing. A lease is an agreement between two parties, and you should revise it to include language that works for you. As always, consult an expert.
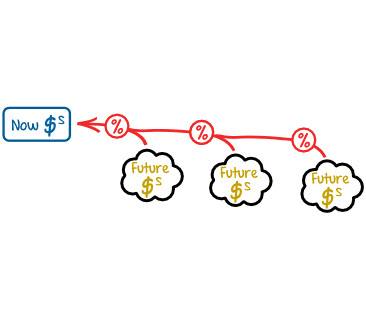 Present Value in Real Estate Allows You To Compare Cash Flows
The best single tool that you can use over and over again in a variety of situations to help you make smarter real estate decisions is a mathematical formula called Present Value. You can use present value in real estate whenever a deposit is made on the property to determine the lost income, or when a buyer agrees to pay money sometime in the future to a seller, or in terminating a lease prematurely, or in determining how rent payments might apply toward a purchase price, or in deciding whether to lease or purchase, or in figuring how much to pay for property that produces income. It works not only in real estate but also in valuing investments and anytime you need to put into current dollars a flow of money that lies in the future.
Present Value is used anytime you have money paid in the future but need to know what it is worth today in order to make the right decision. Present value helps you put different scenarios of cash flows on the same playing field so that you can compare the options. Even though there are templates and apps that can do the work for you, it helps to understand the basics. The Apple Store has dozens of Present Value apps. Even the US government will give you a template to use for GSA contracts. But the best way to understand how the math tool helps is to use a simple spreadsheet.
Let’s set up an example and work it through. One real-life example is how to get out of a lease. A lease commits the tenant to a long-term payment, in return for the predictability of having space in which to operate. Just ask the New Orleans Roly Poly sandwich shop owners, previously on Tchoupitoulas and Jefferson, why a lease commitment is important. You’ll have trouble finding them though because they did not have a long term lease and when the property owner wanted to build a Regions Bank branch, Roly Poly is no more. They shut down Roly Poly entirely, lost their income and the building was demolished by the landlord. So leases are good things to have. The commitment when obtaining a lease is that you will lease the property for several years. More often than not, you will personally guarantee the lease and the property owner will come after any personal assets if you terminate the lease prematurely.
Let’s examine a situation where you lease the property but want to cancel the lease. Maybe you are moving to a bigger space in Elmwood. Maybe you are moving to do more government contracts in Baton Rouge. Maybe you are closing down your business and retiring but don’t want to subject yourself to a lawsuit from the property owner who now will not have income from the lease payments to pay the bank the mortgage on the property and faces the bank coming after his personal property because you no longer can pay the rent.
Present Value is the following formula:

Don’t let the denominator throw you. The Present Value (PV) is the Future Value Payment (C) divided by the Assumed Growth (1+i) where i is the interest rate expressed as a decimal, times the number of periods money is paid (n).
Assume you have a 5-year lease with monthly payments of $10,000 and you want to get out of the lease that started January 1, 2021. You are obligated to make 12 monthly payments totaling $120,000 per year for 5 years or a grand total of $600,000. But you don’t offer to pay the landlord the entire $600,000 now to terminate the lease because he would normally have received that in future monthly payments, and a lump sum now can be invested over the next 5 years to grow to more than $600,000. So how much is $600,000 over the next 5 years worth in current dollars as a lump sum? So our spreadsheet starts like this:

In the Present Value cell, enter the formula: =120,000 ÷ (1+.05) where .05 is 5% which is an assumption of the interest rate or growth rate of that money. Our (n) value equals 1. If you were earning your MBA, the professor would instruct you to use the Treasury Bill rate for n, but we are not in MBA class so in this case it is 5% which is an assumption factoring in risk to come up with an interest rate that the landlord would need to earn on your lump sum to replace the lost income you are no longer paying. So now our formula looks like this:

The result shows the Present Value which is the amount of money it would take today if invested at 5% to grow to $120,000 in 12 months. Double check by multiplying the growth ($114,286 times 5%, or $5,714) and adding it back to the principal ($114,286).
To get more accurate you can compound the cash flows monthly, and assume you get all the income at the midpoint of the year, but in that case you would want to use a template. Now we have to carry this out for 5 years to determine the total amount, so our spreadsheet looks like this:

The only change is that in each subsequent year the present value formula adds another (1+.05) to the denominator.
All you do is add up each year’s Present Value for a total of $519,537. This is the amount in current dollars invested at 5% that grows to $600,000; therefore, this is the maximum amount a tenant would offer a landlord today to cancel a 5-year lease with payments of $10,000 per month.
In 2020 it was reported that the vacant-since-Katrina 197 room Warwick Hotel at 1315 Gravier in New Orleans sold for $8 million, but like so many commercial properties in 300 year old New Orleans, it has a fascinating history including the mysterious death of an owner, a $300 million dollar fraud, Israeli organized crime, a grisly double murder, connections to the president of Israel and also a local prominent attorney, not to mention an uncanny ability to avoid any fines for building code violations for 14 years.

The Warwick Hotel is a 12-story, 120,000-square-foot dilapidated hotel and vacant since Katrina. It was originally constructed in 1952 but renovated in 2000 and previously under the Ramada Inn and Comfort Inn flags. The 176 room property includes 22 oversized one-bedroom suites, 8 junior suites, rooms with one king or two queen beds and handicap-accessible rooms. The hotel is closed and rooms are gutted and some have mold.
The property records date back to 1951 when it was leased to the Warwick Corporation until sold in 1997 by owners Warwick Exchange, LLC and Rosary Hartel O’Neill for $1,300,000 to Warwick Corporation with Rob Mouton as the attorney at that time helping with the purchase. Recently the attorney was changed to Marc Dorsey who is related to a prolific developer in New Orleans owning retail centers in New Orleans East and hotels downtown.


The primary owner of Warwick was Joseph Soleimani, who also owned the Sea Club Resort in Ft. Lauderdale, but in 2013 ownership of the Warwick was transferred to Shimon Levy. Soleimani died the next year. Levy was reported by David Kidwell at the Miami Herald as having ties to Israeli organized crime and spent a year in an Israeli prison. Levy was also convicted of tax evasion. His business partner at the Sea Club was Zvika Yuz who was shot in the face as he parked his car at the hotel. Yuz was an Israeli native who lived in Miami and was instrumental in one of the largest fraud schemes in Florida history, masterminding his 36 employees who bilked 1,800 investors out of $300 million. Yuz was believed to have been connected to the “List of 11”, known as the top 11 Israeli organized crime figures. Yuz’s business partner, Shimon Levy, spent a year in prison in 1981 after he helped hide two top organized crime figures wanted in a grisly double murder in Israel.
Warwick owner Levy was granted a visa to enter the US because immigration officials were unaware of his Israeli conviction as an accessory to murder since former Israeli president Chaim Herzog ordered Levy’s records destroyed.
Shimon Levy decided to let the Warwick Hotel sit vacant for 14 years, willing to forgo millions in lost income if the hotel had been in commerce. The common belief was that the purpose of Levy owning the hotel was simply to park illicit profits from crime and drugs, not so much as to make money.


The daily business operations for the vacant hotel were left to Yoram Moussaieff, who also operated Revolt which was affiliated with Federal Jeans, an outlet in New York with reported $15 million in blue jean sales. Yoram and I discussed putting the property back into commerce several times over several years, and he arranged a tour in 2017. The building was dilapidated with mold and stripped of any copper wiring which was common for neglected buildings after Katrina, but not so common 14 years later. After walking through each of the 12 floors with a contractor, we estimated it would take approximately $10 million to put the 197 rooms back into commerce, so our price for the property was $12 million. The owners thought it was worth $20 million, as-is. So the building sat vacant for another year.
Then the general manager called to report he had an offer for $18 million but would sell for $20 million to anyone else. The numbers just don’t work at that price, but it appeared none of the principals listed by the Secretary of State for the Warwick Corporation (Shimon Levy, Eldad Israel and Yoram Moussaieff) had been to the property in 14 years since Katrina destroyed it, so they were unaware of a realistic value.
As a commercial real estate broker in New Orleans, I regularly analyze financials to determine a property’s appropriate market price. After touring the Warwick and walking through each of the 176 rooms on the 12 floors, I prepared the best and worse case scenario below and other financials. This simple analysis gives you an insight into how a buyer approaches a valuation by working through the numbers backward. First you calculate the revenues you would generate after the project is finished. Then you back in expenses. What is left over is how much you can pay for the property now.

In the worst-case scenario, the most elastic variable is the occupancy rate. For hotels, a bad number is 60%, which we saw a lot of during the 2008 recession. Room rates for high-end hotels can average $150, but during the August hot month, even good hotels drop their rate to $100. This is a $50 drop, which is 33% and a disaster for hotels. So assuming the worst 60% occupancy but keeping the rate at $150 per night, the pro-forma revenues total $5.7 million and expenses average 60% at $2.3 million for a profit of $2.3 million annually. That values the hotel at $28 million, so you never want to have more than $20 million in an investment like that, because you have to allow for at least $8 million as compensation for putting your capital to work in this project versus something like an oil well. Hotels are so risky that recently on a different project, 5 local banks refused to loan $5 million to a buyer who had $1 million deposit on a $6 million dollar renovation loan. So buyers have to be compensated for their risk especially when financing is difficult. That makes this scenario really a break-even transaction which scares most buyers away.

The best-case scenario is what developers hope for but never count on. What if the occupancy rate rose to 80%? They survive on a night when a convention in town, Essence Festival, Jazz Fest, Mardi Gras, or any other reason we hope to have 13 million visitors like we did before Covid. If occupancy rises above 80%, the room rate could climb to $225, then the revenues jump from $5.7 to $11.5 million and the net operating income approximates $4.6 million, valuing the business at $57 million. A well-run hotel can be very profitable, but there are very few who can run one well, which is why no bank wants to loan money to buy one.
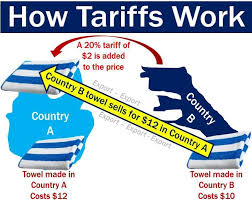
Every college business student learns tariffs are bad for economies that believe in free markets and competition and textbooks are filled with charts showing how tariffs suck money out of consumers’ pockets.
At first glance, imposing tariffs or quotas seems to be the perfect solution to get American industries back on track to prosperity, but the reality is that tariffs steal money out of consumers’ pockets by increasing prices, stifling creativity, rewarding inefficiencies and destroying the competitive drive that allows a free market economy to deliver cheaper, smarter and innovative products to you. If you skipped college or avoided a business degree, you missed the most basic economics course that explains why tariffs and quotas work in communist countries but never work in a free market economy. This article refreshes you on Econ 101 and explains why tariffs in America cost you over $70 billion every year.
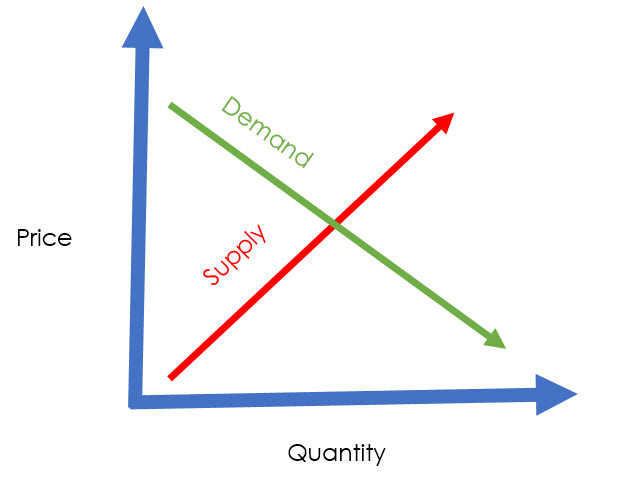
The chart above illustrates the interaction between increased quantity and increased prices for buyers (demand curve) and suppliers (supply curve). The supply curve always rises since as prices increase, providers of goods want to sell more, and the demand curve always declines, since as prices rise, consumers always want to buy less. The intersection of supply and demand tells us the long term equilibrium of price and quantity.
Domestic producers are exempt from the tariff. A quota is a limit on the quantity allowed to be imported. The result of both is an increase in the price of the good, from the market price to the new tariff price. American manufacturers get to charge the new price, but manufacturers overseas receive the market price but pay the tariff to the US government. The government gains area “D” in the chart below (the revenue from the tariff); however, American consumers pay the higher price measured by areas A+B+C+D. Even if the government passes along to consumers the revenue from the tariff, the loss to consumers is still area B+D.

Tariffs and quotas are BAD public policy. Tariffs undermine competitive discipline which forces industries to always reduce cost and increase efficiency, driving creativity and invention. Protectionism has a narcotic effect, allowing sick industries to avoid facing up to their problems. These 3 reports explain in detail how our responses in the past only made things worse:
America has many precedents that teach us tariffs are bad policy, and the most obvious is the steel industry, promoted over the last 4 years as an example that tariffs would help. Going back 70 years, the steel industry was an oligopoly, with just a few manufacturers and little competition, allowing the industry to raise prices 9% annually in the late 1940s (twice the rate of wholesale prices). In the early 1950s, steel prices increased 4.8% annually at a time when the wholesale price index was falling. In the late 1950s, steel prices increased 7.1% annually, three times wholesale prices. In 1969, quotas were imposed and steel prices increased 14 times greater than they had in the previous 9 years, during a time of recession that caused 25% of industry capacity to be idle. The result was a lag in technology. American steel companies failed to introduce the oxygen process and continuous casting which put them at a disadvantage. Their oligopolistic pricing policy kept American companies from competing in the world market and eventually allowed imports to erode their market by producing a better product at a lower price. We can learn from history that tariffs are as un-American as you can get.
Whether you are a landlord or a tenant, lessor or lessee, you need to take action now to keep your business alive in the future and stop events from affecting your lease. First, read your lease. Lock yourself in your bathroom for an hour and don't come out until you finish reading your lease. Twice. No need to call your attorney. Keep them out of it. Tenants, call your landlord. Landlords, call your tenant. Communicate what you want and work out a plan of action.

All leases include language that describes what happens if there is a fire and the time period the landlord has to make repairs. Typically the lease will state " If the Premises or the Building is damaged by fire or other casualty and rendered unsuitable for use...." then goes on to state the landlord makes repairs, usually allowing a 180-day period, and if the landlord cannot make the building inhabitable, the Landlord or Tenant may cancel the lease. Tenants might have a reasonable position that a state-mandated self-isolation renders the space unsuitable. Nobody is going to end up in court over this because it will take years to decide, so the landlord and tenant have to work something out.
The language used, especially if a force majeure is mentioned, could go a long way in affecting your lease. This usually takes effect when there is an unpredictable disaster or Act of God. We saw it during Hurricane Katrina in 2005. This usually allows the landlord to cancel the lease. Big deal. Why cancel a lease when the market doesn't have anyone else lining up to lease your space? Maybe for years.
If your tenant can't pay the rent, your risk is that they will go out of business. Realize you won't have anyone else to rent to, and it may take you several years to get the space leased back up. Reduce the tenant's rent for a portion or all of the term left on the lease. The usual forms of rent reduction are to reduce the base rent, operating expenses, or both.
In this case, the landlord can defer a portion of the tenant's rent but would require them to repay the rent deferred at a later time, either in a lump sum or by increasing subsequent payments. A variation of rent deferral could be to cap or set a base year to operating expenses for a short or extended period of time. Landlords with large retail tenants are asking for a March and April financial statement to show revenues were reduced.

If a tenant is significantly past due on rent payments, a landlord may agree to forgive a certain amount of the past due rent if the tenant remains current thereafter. Rather than abating past due rent, a landlord may agree to convert the past due rent into a loan payable over time. The tenant would, however, continue to pay the current rent.
If the landlord holds a deposit, this amount could be credited against the tenant's current obligations.

Bringing in a new tenant (for part of or all of the rented space) could reduce or eliminate the rent obligations while replacing revenue for the landlord.

What are the basics of your lease? Is the language used affecting your lease? Review your lease to see if your rent is simply base rent or it includes pass-through expenses. How much are these expenses and are they set to increase?
When does your lease end? What constitutes a default of the lease? What tools are available to the landlord in such a case (penalties, eviction, interest, etc.)?

Does your landlord hold a security deposit? Speak to your insurance agent to see what coverages you have.
Arrange a meeting with your landlord and be prepared with data to have an open conversation to identify a solution or combination of solutions.

Retail will see a bifurcated reaction to this economic downturn. Storefronts selling consumer staples - like Walmart, CVS, and grocery stores-will thrive, while dine-in restaurants, for example, could remain closed for the foreseeable future.
Unsurprisingly, hospitality has been decimated by the national response to the pandemic. CCIM Institute Chief Economist K.C. Conway recommends those in the sector ask themselves some basic questions. “For those that own hospitality assets and invest in that space, you need to step back and reflect on what brought you to that property type. Why? Where were you going into this particular period? The market had near record revenues per available room, average daily occupancy, and rental rates. … Whether I'm a hospitality REIT, hotel owner, or I've got properties, I want to negotiate with my lenders for some debt restructuring.”
The office leasing market is likely to suffer in the short-term due to COVID-19 as layoffs diminish tenants' overall need for space and, in many cases, set aside expansion plans they may have had. In addition, tenants who remain in the market for additional space will have a difficult time touring properties. Office workers' pushback against the open office environment is likely to accelerate, as illness is more easily transmitted in an open environment. Many employers already had recognized that in a competition to attract and retain top talent, squeezing workers into increasingly tight spaces was not a sustainable strategy. Now, an emphasis on social distancing and good health practices - continuing in some fashion even after the crisis has passed - may help reverse the densification trend, with less shared space and fewer workers per leased square foot.
Similarly, the multifamily sector could see significant upheavals as unemployment rises. Businesses that are closed employ people who now will struggle to pay rent. It's a similar situation to retail, only in this case the tenant is an individual or family who lost its source of income. Tellingly, Freddie Mac announced a nationwide relief plan for current multifamily borrowers and residents.
Industrial, meanwhile, is in a two-pronged situation similar to the retail sector. Grocery and medical items, for instance, are flying off the shelves, so properties in this supply chain are humming along. But other industrial sectors could be in store for tough times, depending on what areas of the national economy slow or stop.
We can help. We are offering a free lease review and, if needed, help to negotiate your lease so that landlords keep their tenants and tenants keep their business going. Having a commercial real estate broker who is a trained professional negotiator can help you execute your plan and save time and money, while lifting a burden off your shoulders. Knowing what events—present and future— affecting your lease is critical.
Why Negotiating Is Like A Tennis Match
Download the Colliers economist's report, The Coronavirus, the End of the Cycle and US Commercial Property Markets: Early Thoughts.
 Buying, selling and leasing commercial real estate requires lots of different skills, including knowledge of financing, zoning, supply and demand, income statements, and demographics but the most valuable skill is good negotiating. What makes a good negotiator? It is helping all parties involved, who bring to the table different and opposing objectives, agree on the one objective of buying, selling or leasing a property with terms that they may not like but to which they can agree. A good negotiator embraces conflict and works through it, discovering the motivations of each party and helping them achieve goals they may not have initially thought important.
Negotiating has an ebb and flow, a rhythm that is similar to a tennis match. If you make it too short, both parties didn't give their best, but if you make it too long, both parties tire out and make stupid mistakes. Negotiations always have several terms that both parties have to take into account. There is an offer, then a counter-offer and negotiations should never go past the counter-offer. There has to be some agreement at the 2nd change in terms, even if you have to reduce the number of issues under negotiation. This is where a good negotiator can add value to any transaction, by working with each party to identify issues that are minor and those that are deal-breakers. Negotiators need to understand why certain terms are important to people and help them understand the concept that if they can't get one thing they want, maybe they can get a different thing that will also help them.

Any negotiation eventually has conflict, because there are always various interests involved, called stakeholders, that have their own objectives which can often oppose other stakeholder's interests:
The Buyer or Tenant-the buyer and tenant want the property as cheaply as possible and more. Sometimes the buyer wants a long inspection period or time to arrange financing. The tenant sometimes wants the landlord to build out the space and always wants several months of free rent.
The Seller or Landlord-both want as much money as possible with little initial investment. The seller doesn't want to make any repairs on the property being sold, and the landlord doesn't want to give free rent or spend money building out space that may be unusable should the tenant leave in the middle of the night, skipping on the rent.
The Government-whether the property falls under the jurisdiction of a city planning department, city council, mayor, or just the neighborhood association, each group wants to represent its constituents and get credit for any progress. The mayor wants a press conference, city planning wants all zoning laws complied with, and the neighborhood association wants services for their members even if it doesn't make good financial sense.

The easy thing to do when a conflict of interest arises is to walk away. It is the most comfortable and normal reaction for many. But a good negotiator doesn't take conflict personally, stays calm and utilizes 4 strategies, especially when it involves leasing a commercial real estate property:
For more information on negotiation, read our article The Insanity of Inspection Renegotiation and our reality article on Successfully Negotiating the Largest Class A Office Lease.
 You can run the numbers to calculate gains or losses from various scenarios, but there is nothing like a visual depiction of risk/reward tradeoffs, especially when it comes to risk in commercial real estate. The hard part is transitioning numbers to something you can see that displays probability and the risk involved with adopting various strategies that may or may not result in a gain.
Making decisions in commercial real estate often involves more than just calculating a capitalization rate or net present value, because there is always a component of unknown risk. In the office leasing sector, risk is created by local market factors, such as supply and demand for space, asking and effective rents, and absorption rate. Other factors contributing to risk in commercial real estate are the specifics of the situation. Learning how to quantify and illustrate such risks to clients is a challenge, especially in small or mid-size markets where office demand can still be somewhat stagnant.
This article discusses how to quantify the risk of a real-life decision: Should an office tenant write a check for $1.5 million to accept a lease buyout offer, or continue to market a sublease for 56,542 square feet of class A downtown office tower space in New Orleans?
As a byproduct of a merger between two large oil companies, a decision was made to relocate 250 employees from New Orleans to Houston, leaving 75,000 sf -- four full floors of fully furnished class A office space -- vacant with an obligation to pay rent at $18.25 psf for 54 more months.
The situation is compounded by two issues: The space represents the largest contiguous class A office space in New Orleans, and with only 54 months left on the lease, it is not feasible for the lessee to offer any build-out allowance. This means the sublease space cannot compete with market-rate space.
The lessor has presented an offer to take back 56,000 sf -- three full floors -- for a lump sum payment of $1,500,000 rather than the current obligation of $1,022,000 per year. The decision for the tenant is whether to pay the $1.5 million and gain the difference or try to sublease the space to produce a greater income. The dilemma is how to analyze this risk in commercial real estate.
The New Orleans class A office tower market is approximately 9,000,000 sf, with 1,000,000 sf currently available for lease. Building occupancy rates range from 73 percent to 97 percent and 2013 absorption was 133,000 sf, or 13 percent of available lease space. Asking rents range from $16.50 to $21.00 psf, including build-out payments ranging from $10 to $30 psf. In competing buildings, 15,000 sf of sublease space is available at $15.00 psf and 90,000 sf was just renewed at $12.50 psf.
At first glance, the answer appears to be a no-brainer: Accept the offer to pay a lump sum of $1,500,000 rather than pay $1,022,000 annually for 54 months, equal to $4,599,000. However, calculating the numbers on subleasing the space at the average asking rate of $18.50 psf produces a profit of $63,609 for the remaining period. (See Table 1.)

Such numbers are compelling to clients wishing to make the most of a difficult decision. However, just because the market rate is $18.50 psf, we can’t assume that we can immediately lease the entire space at that price. Instead, the analysis should focus on the risk of not paying the $1,500,000 and trying to sublease the space. What price do we need to sublease the space for and how long can we take before we are worse off than just paying the $1,500,000? How do we show a client that risk visually?
Thus, the critical data are how long will it take to sublease the space and at what price. If the current market lease rate is higher than the current obligation net of build-out allowance, the space would command a payment to the lessee rather than a $1,500,000 payment from the lessee. But, like many markets, the New Orleans market has a wide variance, with some class A office tower downtown space subleased at a low of $12.50 psf and listed space quoted up to $21.00 psf.

The best way to analyze the decision is to first examine the worst, average, and best outcomes, as shown in Table 2, which compares the income from a range of lease prices psf compared to various periods remaining on the lease. The three price levels are the actual low, middle, and high rates for class A office tower space in downtown New Orleans.
Each combination of time remaining and assumed sublease price should be compared to the net savings from the buyout offer of $1,500,000. The current obligation is for a lease payment for 54 remaining months at $18.25 psf on 56,542 sf, for a total of $4,643,511. The buyout offer requires a one-time payment of $1,500,000, which is a savings of $3,143,511. ($4,643,511 minus $1,500,000 paid).
If the lessee could sublease the space for $12.50 psf, the space would have to be subleased almost immediately in order to reap more income than the proposed offer. At $15.00 psf, the space would have to be subleased within 12 months, or have 42 months remaining in which to earn enough income. At $18.25 per square foot, the space would have to be subleased within 18 months, in order to have 36 months remaining to produce the same savings.
The information in the table can best aid the decision-making process by illustrating it in chart form, with the dotted line depicting the savings from the proposed offer to buy out the lease.
Chart 1 shows that any situation above the dotted line represents a better alternative than the proposed offer, and any situation below the dotted line represents a worse scenario.
Going one step further to incorporate risk into the analysis produces a more-reliable decision. We might have a higher confidence level that the space will sublease around the $15.00 psf level, but we still don't know how long it will take to get it subleased. Of the 133,000 sf leased last year in New Orleans, the subject space represents 42 percent of that supply. Of the 133,000 sf, only three leases were 17,000-sf full floors. So the decision compares a finite cost of $1,500,000 against several likely outcomes.
Chart 2 further incorporates risk in commercial real estate by comparing the area in a blue box of all possible outcomes above the known savings (which is a better outcome) to a red box of all possible outcomes below the known savings (which is a worse outcome). Since the blue box is smaller than the red box, it is less risky to pay $1,500,000 to terminate the 56,542-sf lease than it is to try to lease the space for more income. By visualizing not only the numbers but the risk of all likely scenarios, you can make complicated decisions easier.
This article was written by broker Robert Hand and is a reprint from the August 2014 national publication Commercial Investment Real Estate, published by CCIM, an organization of the top commercial real estate brokers in the world with a membership of 13,000 in 30 countries.
Read the original publication at CCIM Archive CIRE magazine.
New Orleans commercial real estate developments don't happen without government help which ranges from New Market Tax Credits, Community Block Grants, Tax Exempt Financing, to Digital Media Tax Credit, Bonus Depreciation, and Tax Abatements.
For example, one of the largest developments in New Orleans was a $70 million, 550-unit apartment and retail complex near the Superdome. Here is how the project was financed: New Market Tax Credits provide $4.9 million and Enterprise Zone Rebates provide $806,000, leaving loans from Goldman Sachs providing $55 million and equity of $8.4 million from the developers.
The most common financing vehicle was New Market Tax Credits which was established by Congress in 2000 to spur new or increased investments into operating businesses and real estate projects located in low-income communities. The New Market Tax Credits Program attracts investment capital to low-income communities by permitting individual and corporate investors to receive a tax credit against their Federal income tax return in exchange for making equity investments in specialized financial institutions called Community Development Entities (CDEs). The credit totals 39 percent of the original investment amount and is claimed over a period of seven years (five percent for each of the first three years, and six percent for each of the remaining four years). The investment in the CDE cannot be redeemed before the end of the seven-year period.
The Internal Revenue Service (IRS) published a Notice providing guidance with respect to how certain Targeted Populations of individuals may be treated as Low-Income Communities eligible for investments by Community Development Entities (CDEs) under the New Markets Tax Credit (NMTC) Program. As indicated in the Notice, certain individuals in the Hurricane Katrina Gulf Opportunity Zone, as such term is defined in the Gulf Opportunity (GO) Zone Act of 2005 (Pub. L. 109- 135), are deemed to be a Targeted Population provided that the individuals were displaced from their principal residences as a result of Hurricane Katrina and/or lost their principal sources of employment as a result of Hurricane Katrina. A business that serves these individuals may be a qualified active low-income community business to the extent that:
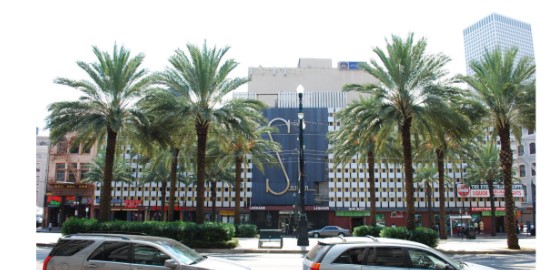
Since New Orleans is almost 300 years old, there is plenty of history behind almost every commercial real estate property, and 426 Canal Street is a prime example of this New Orleans Commercial Real Estate with such a fascinating history that locals refer to it by name rather than the address.
This property has been known by three names: the Friedricks Building in the late 1800's, and the Sanlin Building, or the Morris Cigali Building more recently.
The historic Sanlin Building has a footprint of approximately 49,661 square feet with 130,000 square feet of improvements. Zoning is CBD-3 which allows a height of 85 feet. The property is located adjacent to Harrah’s Casino and near Canal Place Shopping Center, which just announced that retailer tenant Tiffany is taking a large block of space.
The property dates back to the 1840s when African-American clothing merchants Julien Colvis and Joseph Dumas purchased lots and constructed buildings in the block with the expertise of architects Sidle and Stewart. Then in 1850, Colvis purchased 426 Canal from Louis Bararin. Architect James Freret added a 5th floor and the current façade after 1880. The façade has been thought of as historically significant and the building is considered an example of African-American entrepreneurism, which prevented any changes to the outside of the building over a decade ago.
This property is zoned CBD-3 which allows any use permitted in CBD-1 except hotels. Since the zoning does not allow a hotel as a permitted use but as a conditional use, any hotel development must have city council approval and a review by the city planning department in an official site plan review. This requires architectural drawings to be submitted which can easily cost $50,000 to $150,000-a hefty up front expense when no guarantee exist that a project can proceed. Current zoning only allows hotels as a conditional use in a certain area bounded by Canal, Crozat, Iberville and North Peters, as shown in the map below.
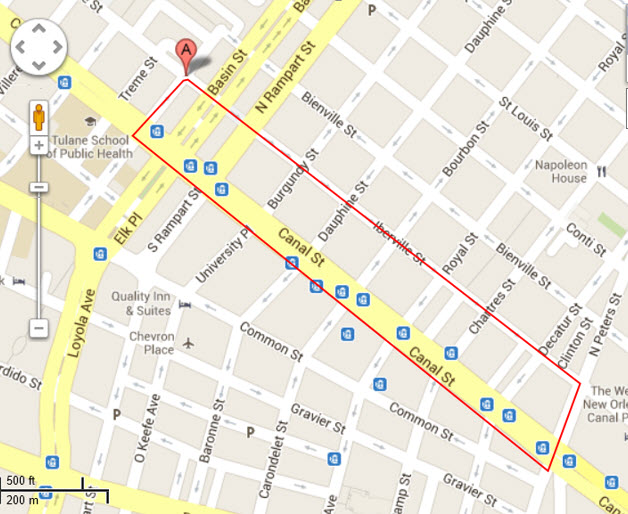
Source: www.louisianacommercialrealty.com, New Orleans Preservation Society Archives.
copyright 2013.

New Orleans is attracting a new industry of media companies, including movie companies and software developers, mostly due to superior tax incentives offered to businesses to relocate to the Big Easy. For example, there is a 25% tax credit for digital media expenditures. That is a dollar-for-dollar tax credit. There is a 50% bonus depreciation and tax exempt financing at a 2% interest rate. There is a tax credit for live performances up to 25% of expenditures. There is a tax credit of 30% which can also be sold on movie expenditures. There is a 39% federal plus a 25% state New Market Tax Credit for development in low-income areas. There is a 25% tax credit for Sound Recording expenditures. Here are the 14 major incentives and a summary of benefits all in one list.
Several leading technology companies have taken advantage of the tax incentives and have come to Louisiana, such as:
On August 15, 2011, Gameloft announced it would open a game development studio in New Orleans and deliver at least one new game title developed entirely at the studio in its first year. Employment will grow to nearly 150 jobs at the New Orleans studio in the next few years, with pay averaging more than $60,000, plus benefits. Electronic Arts ea In 2012, the Electronic Arts moved into the newly-constructed 94,000-square-foot Louisiana Digital Media Center on the LSU main campus. EA now employs nearly 500 workers during the school year. In addition to the LSU students who serve in part-time positions at the center, EA has had success recruiting others in the Baton Rouge area to test children's games and casual games more popular with adult women. Game testers at the center in Baton Rouge coordinate work on a daily basis with studios across the globe, including facilities in Stockholm, London and Bucharest.

In 2012, Electronic Arts moved into the newly-constructed 94,000-square-foot Louisiana Digital Media Center on the LSU main campus. EA now employs nearly 500 workers during the school year. In addition to the LSU students who serve in part-time positions at the center, EA has had success recruiting others in the Baton Rouge area to test children's games and casual games more popular with adult women. Game testers at the center in Baton Rouge coordinate work on a daily basis with studios across the globe, including facilities in Stockholm, London and Bucharest.

"This public-private partnership with LED, IBM and LSU is a powerful example of the triangulation between industry, government and academia that elevates the state's role as a national leader in economic development," said LSU College of Engineering Dean Richard Koubek. "LSU's College of Engineering is committed to developing a mutually beneficial partnership with IBM and LED that stimulates economic growth and helps to meet the workforce development needs of the state." In addition to long-term workforce solutions, LED offered the company a $17 million grant to reimburse relocation, recruitment and internal training costs; a $5.5 million incentive equivalent to the state's Quality Jobs program for a portion of the IBM center's employment over 10 years; a $5 million grant to offset facility operating costs over 10 years; and the recruitment, screening and training services of LED FastStart®. LED offered a $30.5 million performance-based grant consisting of state, local and federal funding to build an eight-floor office building as part of a new, mixed-use urban development on Baton Rouge's riverfront. In addition to new Class A office space and 600 dedicated parking spaces, the development would include an 11-floor residential tower and a private recreational terrace joining the buildings above a multilevel parking garage. Leveraging resources of the Baton Rouge Area Foundation, Louisiana secured BRAF’s commitment to build and manage the $55 million total project through its affiliates, the Wilbur Marvin Foundation and Commercial Properties Realty Trust.

In February of 2012, Brackett Denniston, GE senior vice president and general counsel, joined state and local leaders to announce the creation of the GE Capital IT Center of Excellence in New Orleans. “We took our time to select a location for this important center,” said Denniston. “We looked all over the country but, after much consideration, New Orleans rose to the top of our list.” The center will be home to 300 high-quality technology jobs and serve as a major resource for GE Capital employees across the nation. Executives announced GE Capital will occupy 60,000 square feet of office space in the New Orleans Central Business District.

DXC hired 300 people during 2018, ramping up to 2,000 jobs over five years with an annual payroll exceeding $133 million by 2025. The LSU Economics & Policy Research Group estimates the DXC Technology project will translate to $64.3 million in new Louisiana taxes, $868.4 million in new Louisiana earnings and total economic output of $3.2 billion from 2018 through 2025.
If you rent space for your business, your lease probably has a clause that makes your rent increase as inflation increases, so be ready to automatically pay a lot more in rent. This article explains how inflation in your lease language is calculated and how to know ahead of time how your rent could increase.
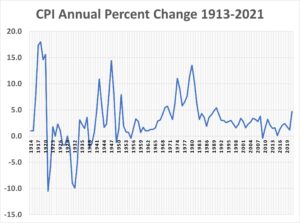
Your lease should have a detailed explanation of how your rent increases with inflation, and lease language always includes these trigger words:
For example, let's say your initial lease term is 5 years and your rent for 10,000 square feet is $20 per square foot per year, adjusted annually for the CPI. Those annual rent adjustments total $45,000, even though the CPI the last 5 years only ranged from 1.2% to last year's high of 4.7%, as shown in the table and chart below. Had you negotiated for a 5 year initial term with a CPI adjustment at the end of the 5 years, rather than annual adjustments, you would have saved $45,000.
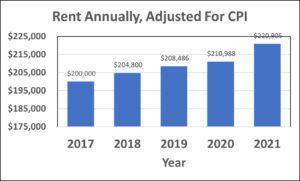
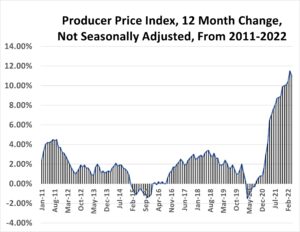
The Consumer Price Index (CPI) measures the change in prices paid by consumers for goods and services, and most leases should use the CPI All Urban Consumer group which represents about 93 percent of the total U.S. population. It is based on the expenditures of almost all residents of urban or metropolitan areas, including professionals, the self -employed, the poor, the unemployed, and retired people, as well as urban wage earners and clerical workers. Prices are collected each month in 75 urban areas across the country from about 6,000 homes and approximately 22,000 retail establishments (department stores, supermarkets, hospitals, filling stations, and other types of stores and service establishments).
Before these items are purchased by consumers, they are produced by manufacturers, and their change in price is tracked by the Producer Price Index, which includes over 100,000 items. The Producer Price Index (PPI) measures the average change over time in the selling prices received by domestic producers for their output, and you can use the PPI to forecast the CPI and your increase in rent.
The Bureau of Labor just announced the Producer Price Index increased 11.0 percent from April 2021 to April 2022. The Index is comprised of both goods and services, with producer prices for goods increasing more at 16.3 percent, while prices for services increased 8.1 percent, as shown in the chart below.
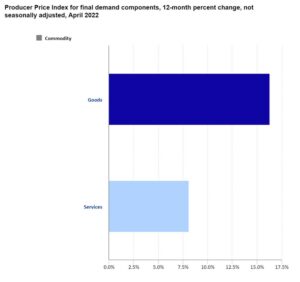
Not all categories increased prices the same, however. Producer prices of goods can be further subcategorized into Foods, Energy and Other, with each component incurring a wide range of price increases. Energy prices topped the list, with gasoline and auto prices increasing 50% over the last 12 months.

The food category can be further subcategorized: vegetables increased 45% but meats increased only 5%. Health and Beauty items only increased 1.4% while securities brokerage and portfolio management prices declined.
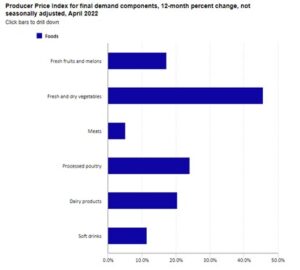
The energy category can also be subdivided, as in the chart below showing jet fuel prices increasing 127% and diesel prices increasing 86%, while electric power prices only increased 10%.

In the Other category, Goods Less Food and Energy, the largest price increase was in the Industrial Chemicals subcategory with price increases of 22% while pharmaceuticals only increased 1.6%.
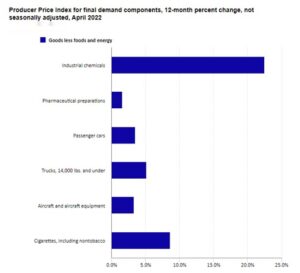
In summary, follow these subcategories of the Producer Price Index to give you an idea of where the Consumer Price Index is going and use this information to negotiate better lease terms for your business. Remember, a lease is an agreement between you and your landlord and can always be amended if you have accurate information and facts to show how it is in the landlord's and tenant's best interest.
For more information on how inflation affects commercial leases, read our articles:

OK, Boomer. If you advertise your business name to 845,000 people, would you think one or two people might call you? Not especially, and this article explores why. If you own a business, you have to leverage social media to promote your business and let people know how you can help them; however, not all businesses are helped by advertising on social media. Recently, Louisiana Commerical Realty spent $11,000 to test an advertising campaign using several media channels: Facebook, LinkedIn, Google and the business publication CityBusiness, and the results were surprising.
First, you will need to know the terminology of social media advertising:
The chart above compares four different media channels and two variables: the amount spent on an ad and how many unique people clicked on the ad for more information which takes them to a website where we can engage visitors and promote our business so they can call or email us. If the orange line in the chart crosses at the top of the blue column, that means for every $1 spent, we get one unique person that clicks on the ad and then visits the website. Results show Google was the most productive and CityBusiness was a bust, delivering only 178 unique clicks for $4,000 spent. What the numbers don't show is that 178 CityBusiness readers might be more valuable than 4,500 Googlers.
Since different ad campaigns had different budgets, we compared the 'Click Thru Rate' of each in order to reduce the bias of spending more on one media than the other. The chart below shows Google and LinkedIn were tops in visitors who were the most responsive to our ad. But notice even the highest ‘Click Thru Rate’ was Google's 1.07%. That means money spent to reach the other 98.93% was wasted. To be effective, advertising has to either reach lots of people, or a smaller number of very valuable people. The chart also compares the 'Cost Per Click' which was 90 cents for Facebook and Google but $22 for CityBusiness. If your business is trying to connect with local people interested in business, then $22 each may be a bargain.
The most valuable test is the 'Keyword Search' which shows what words Googlers search for that causes them to click on the ad and drives traffic to your website. The surprise is that a small change in wording can drive almost 5 times more traffic to your website. For example, using 'commercial real estate for lease' rather than 'office space for lease' as the search keyword generates a 26% Click Thru Rate versus 5.78%. Of the 74 keywords we tested, only 2 had a Click Thru Rate over 10% and only 14 of 74 scored over 5%.
After spending $11,000 on advertising that displayed 845,000 ads that got the attention of 1,762 people but generated zero emails and zero phone calls, the conclusion is that advertising in social media doesn't work for every type of business, but you don't know until you try it. Run a test first to find out what works best for your business.
If you own a small business and need to reach customers, here is a webinar that can help you. Learn how customers find your business online and how to promote your business using Search Engine Optimization and Smart Campaigns in Google Ads. Topics include:
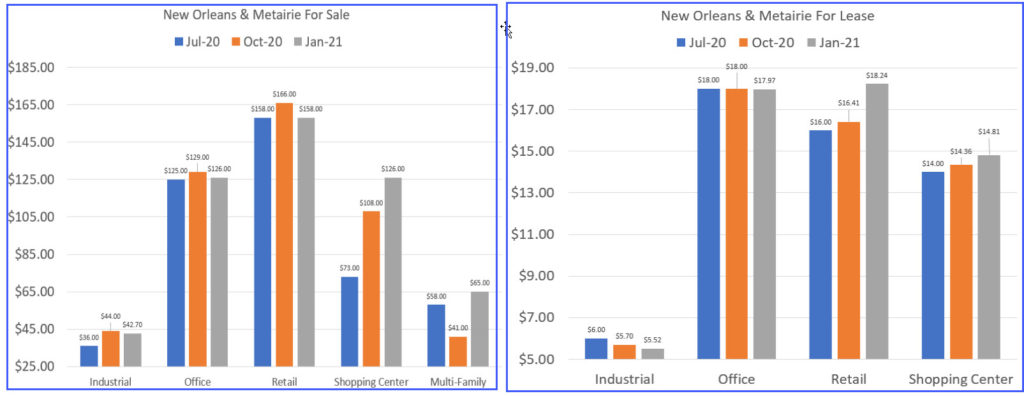
January 2021 commercial real estate prices for the New Orleans/Metairie MSA increased dramatically for the retail and multi-family lease sectors and shopping center sale sector, but prices declined in office and industrial leasing and office, retail and industrial sale sectors. Demand and supply affected each sector differently which creates opportunities for commercial real estate buyers, sellers, landlords and tenants.
Over the last 6 months, over 500,000 square feet has been eliminated from the market for sale but 900,000 square feet added for lease. This change in supply mixed with various demand curves, causes some sectors to incur increasing prices while other sectors witness declining prices. This article examines price changes for the various categories of commercial property and looks for trends and opportunities.

Lease prices for office space in the New Orleans/Metairie Metropolitan Statistical Area averaged $17.95 per square foot, an increase of 26 cents per square foot over the last 6 months with 169 properties for lease totaling 700,000 SF (20 percent) added to the market. The new supply should push lease prices much lower.
Sale prices averaged $124/SF, a decrease of $1/SF, with only 11 properties added. There was unprecedented activity in just the last month with 20 properties leased averaging $15/SF and 11 sold averaging $151/SF.
In the retail store category the last 6 months, there are 17 few properties for lease but 200,000 more square feet and 7 fewer for sale with no change in square feet. The average property is on the market 330 days and last month 15 spaces leased averaging $24/SF even though list prices were $15.82/SF, and 7 properties sold averaging $115/SF while list sale prices averaged $167/SF.

The last 6 months saw 26 more shopping center spaces for lease totaling 144,000 SF averaging $14/SF. The average lease rate increased 83 cents/SF (6 percent) and sale prices doubled from an average of $73/SF to $141/SF, due to 127,000 SF taken off the market, a 40 percent drop in supply.

The industrial market was steady with only 13 fewer properties for lease and 10 fewer for sale. Lease rates decreased 18 cents to $5.46/SF and sale prices decreased $2/SF to $35/SF. Last month there were 3 properties leased at $6.43/SF (15% above average) and 4 high valued properties sold for $51/SF, 45% above the average price.
For comparison charts of prices, see our page Louisiana Commercial Property Price Charts For 3rd Quarter

He has prepared culinary dishes for Queen Elizabeth, Princess Ann, President Carter, Senator Ted Kennedy, Clint Eastwood, Omar Shariff, Sophia Loren, Senator Jack Kemp, Lee Meriwether and Tommy Lasorda. He is Chef Andrea Apuzzo, owner of Andrea's restaurant and voted One of America’s Finest Restaurants & Outstanding Chefs by Chefs in America. But he is also a real estate investor.
Recently Chef Andrea hired Louisiana Commercial Realty to manage leasing for his nearby office building, which is one of the few incubator office spaces available in Metairie, Louisiana. The office building is designed for start-ups and sole proprietorships with 1 or 2 employees, and offers full service amenities and plenty of free parking.

Chef Andrea reached out to Louisiana Commercial Realty to market the office building and find the right tenants to lease several vacant offices. The offices had been vacant for a long time because another real estate firm had been unsuccessful in finding tenants.
Louisiana Commercial's broker Robert Hand explained, "Our firm negotiated the largest office lease in New Orleans, and we take pride in offering a high level of service to big and small office landlords. Size does not matter. This building is a smaller facility, but there is a real need for start-up companies to have office space with free parking in an easy-to-get-to location. So we designed a marketing plan to attract new companies and entrepreneurs who need an affordable office in a great location. In just a few days, we had interest in leasing half the available offices."
Located near Lakeside Mall, the Ridgelake Drive office building offers entrepreneurs the lowest office rates in New Orleans and Metairie, and choices of office layouts from 225 to 750 square feet. Included in the rent are all utilities as well as janitorial services and availability 24/7 without any extra charges.
Commercial broker Hand says, "If you are a small business owner you work hard, often nights and weekends. But every office tower in Metairie and downtown will charge you extra for air conditioning after hours. And it's expensive, sometimes $200 per hour. We think entrepreneurs need a break and when they have an office in Chef Andrea's building, there is no extra charge for air conditioning. It's the right thing to do."
If you want to know more about leasing office space in Chef Andrea's building, click here:

Citybusiness magazine recently reached out to Louisiana Commercial Realty broker Robert Hand, to gain insight into a new type of upscale office development in the heart of once was one of the roughest neighborhoods in New Orleans.
The high-tech, avant garde development, called "The Stables" transformed three small buildings that were historic horse carriage barns into state-of-the art office space for architects, realtors and interior designers. The development hopes to appeal to a new type of office tenant that prefers smaller, upscale office space.

Broker Robert Hand conducted in-depth research into the needs of tenants who lease new office space when he completed the largest Class A office lease in New Orleans. Hand says, "We discovered there was an underserved market of millenials moving to New Orleans because they liked the culture and were starting their own businesses. We saw new business incorporation numbers rising sharply in businesses with less than 10 employees." Hand says companies that compete for top talent need hip office layouts, which often include free break rooms, sofas and game rooms with pool tables.
Rents at The Stables are $28 per square foot, which are higher than Class A office space at $24 per square foot, but the free parking is equal to $3 per square foot, so the space is compatible financially and appeals to upscale businesses looking for a hiring advantage.
Broker Hand says, "The smaller development will appeal to higher income architecture, engineer and tech employees looking to get away from downtown parking but not keen on being outside the city. This is a project that’s common in a techie city like Austin, Texas, but not something you’d see in New Orleans." He expects similar smaller office developments to open in others areas of town such as Bywater and Uptown.
The commercial real estate market in the New Orleans/Metairie MSA has held steady throughout Covid, with prices increasing 5% in the industrial sector, 30% in the shopping center sector and unchanged in the office sector, and decreasing 6% in the retail sector. Over the last 6 months, over 1 million square feet has been taken off the market for lease and an additional 400,000 square feet is now for sale. This article examines the current average price of the various categories of commercial property and looks for trends and opportunities.
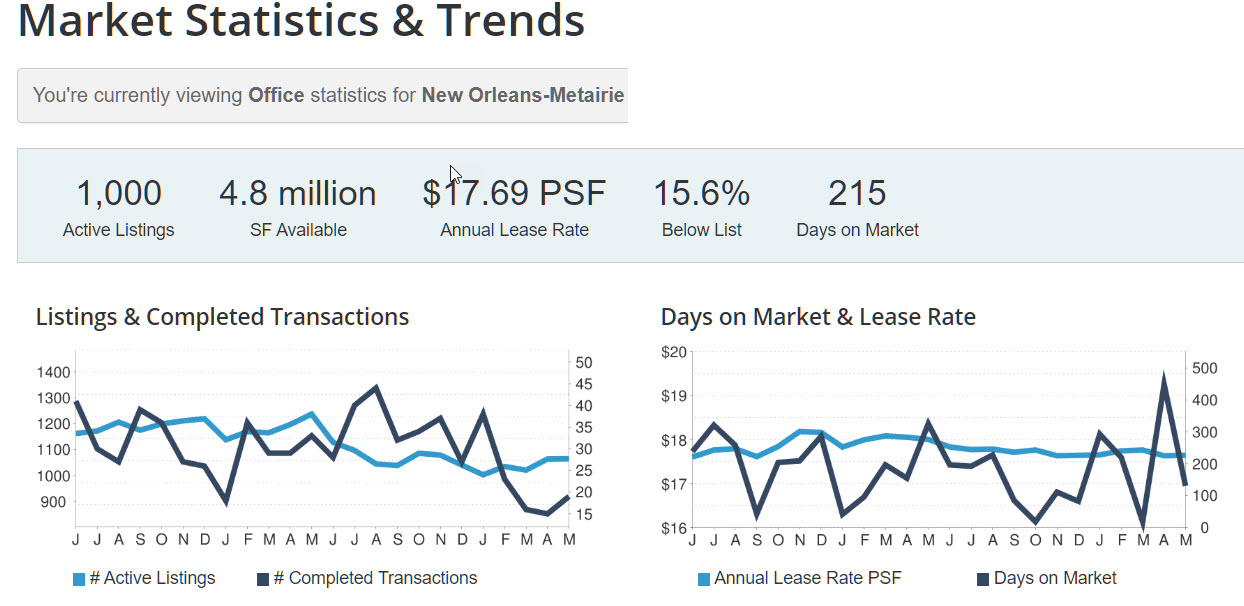
Lease prices for office space in the New Orleans/Metairie Metropolitan Statistical Area averaged $17.69 per square foot but transacted 12% less at $15.76/SF, and sale prices averaged $125 per square foot. There are 1,000 office properties for sale or lease and, of those, 867 are for lease and 133 for sale. Last month 18 office spaces were leased, which is below the average of 25 monthly for the last 2 years. and 1 office properties was sold. The average office property is on the market for 215 days.
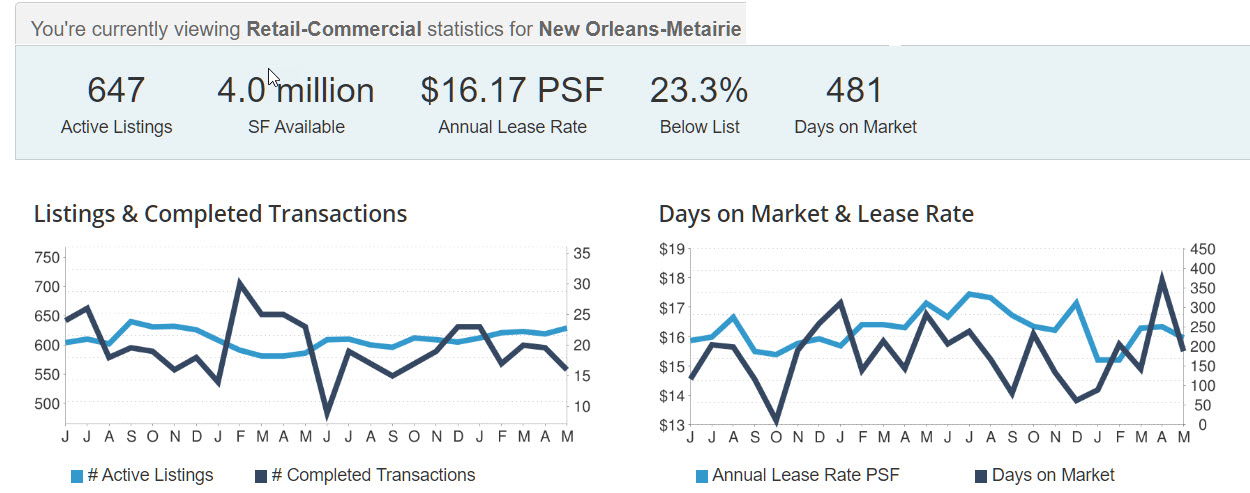
In the retail store category, there are 647 listings, with 473 for lease averaging 2.1 million SF at $16.17/SF but 13 transacted last month at $13.51/SF. There are 174 retail properties totaling 1.8 million SF for sale, listed at an average of $158/SF but 3 sold last month at $113/SF. The average retail listing is on the market 481 days, about 8 months longer than average.
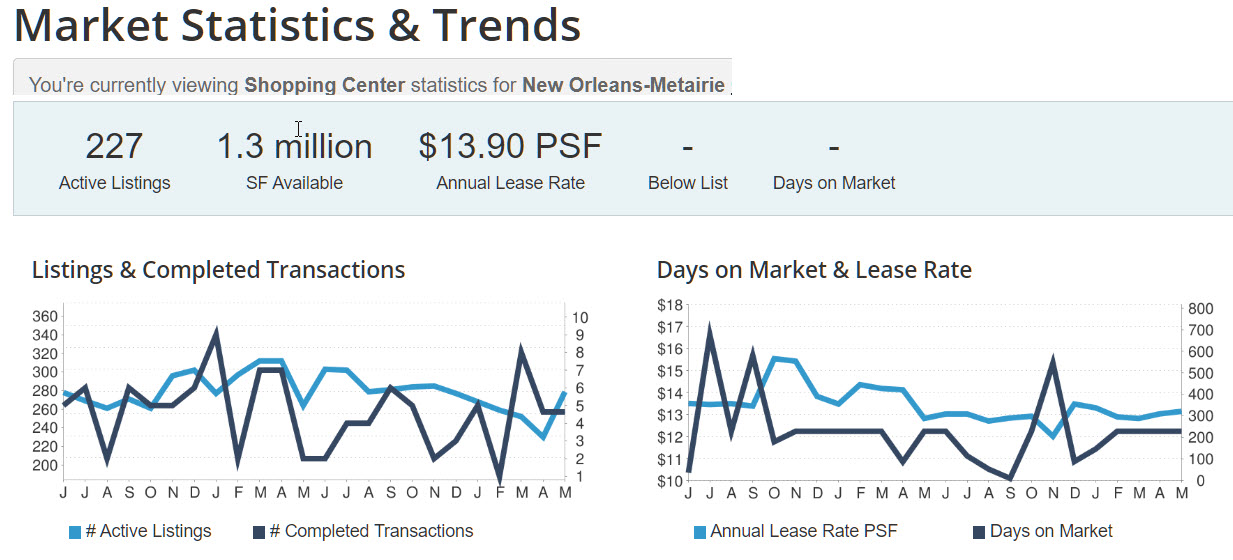
The last 6 months destroyed the shopping center market with sale prices plummeting 30% but helped lease rates which increased 30%. There are 227 shopping center spaces in the New Orleans/Metairie market with 217 for lease totaling 956,000 SF at $13.90/SF and 10 properties for sale totaling 321,000 SF at $73/SF. The lease market has dropped 800,000 SF over the last 2 years while the sale SF remains unchanged. The average shopping center space is on the market 308 days.
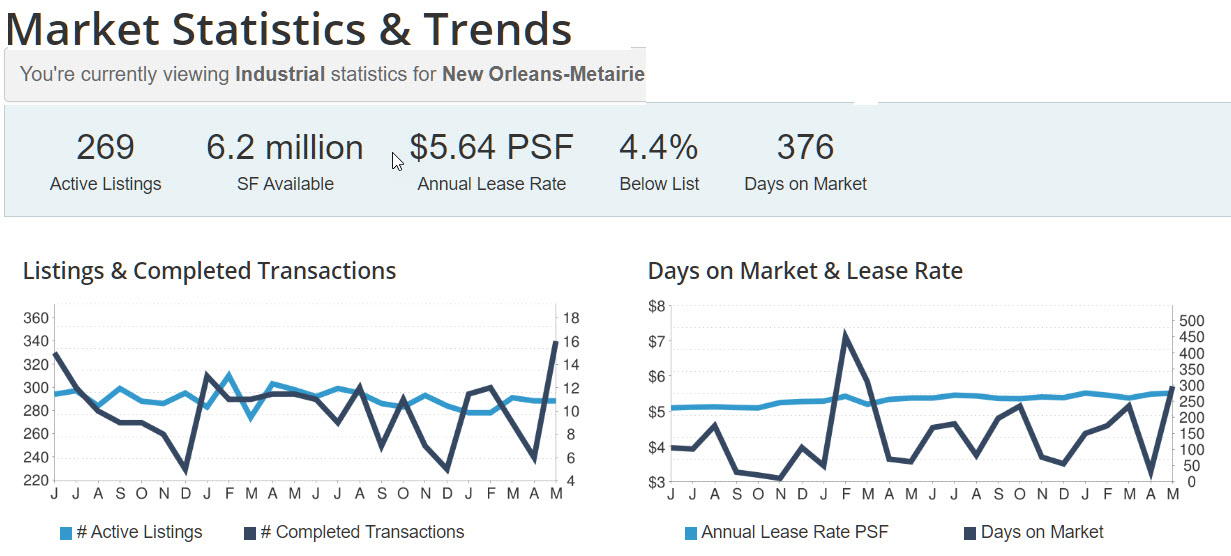
The industrial market has 269 listings totaling 6.2 million square feet, with 173 properties totaling 2.8 million SF for lease averaging $5.64/SF and 96 listings totaling 3.2 million SF averaging $37/SF and on the market 376 days. Six months ago, lease rates were 5% lower at $5.38/SF, and sale prices averaged 18% higher at $46/SF.
For historical comparison, read our article on prices dated August 2019: Commercial Real Estate Market Overview.
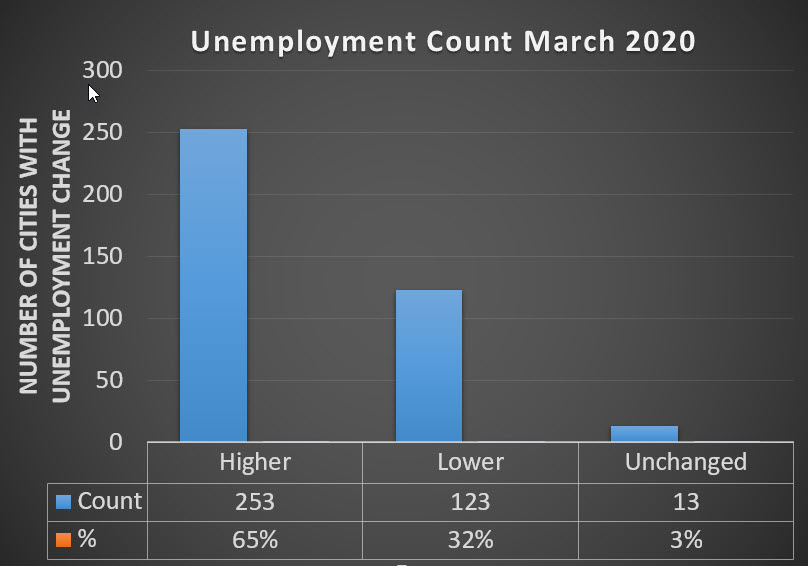
The latest unemployment numbers show, compared to one year ago, 32% of 389 city metropolitan areas actually had lower unemployment rates, meaning a higher percent of workers had jobs, leaving 65% with higher unemployment and 3% unchanged compared to 12 months ago.

The average unemployment rate was 4.5%, and 226 metropolitan cities had rates below average, 150 cities had rates above average and 13 cities equaled the average. The U.S. map shows only the metropolitan cities with the highest unemployment. Louisiana has 8 cities with an unemployment rate 5.6% and higher, including Monroe with the highest at 6.9%, followed by Hammond at 6.8%. Only 3 other states have that many major cities with 5.6% unemployment or higher:
So where are the big cities with the best prospects for work? Not Texas, not California and not New York. The states with the highest number of metropolitan cities with the lowest unemployment rate and the most jobs are:

| Metropolitan Statistical Area | Unemployment Rate |
| Kahului-Wailuku-Lahaina, HI | 2.1 |
| Urban Honolulu, HI | 2.1 |
| Ames, IA | 2.2 |
| Idaho Falls, ID | 2.4 |
| Ann Arbor, MI | 2.4 |
| Madison, WI | 2.4 |
| Boise City, ID | 2.5 |
| Columbus, IN | 2.5 |
| Dover-Durham, NH-ME NECTA | 2.5 |
| Oklahoma City, OK | 2.5 |
| Charleston-North Charleston, SC | 2.5 |
| Champaign-Urbana, IL | 2.6 |
| Manhattan, KS | 2.6 |
| Manchester, NH NECTA | 2.6 |
| Portsmouth, NH-ME NECTA | 2.6 |
| Grand Rapids-Wyoming, MI | 2.7 |
| Fargo, ND-MN | 2.7 |
| Columbia, SC | 2.7 |
| Greenville-Anderson-Mauldin, SC | 2.7 |
| Hilton Head Island-Bluffton-Beaufort, SC | 2.7 |
| Burlington-South Burlington, VT NECTA | 2.7 |
| Huntsville, AL | 2.8 |
| Pocatello, ID | 2.8 |
| Twin Falls, ID | 2.8 |
| Bloomington, IL | 2.8 |
| Elkhart-Goshen, IN | 2.8 |
| Iowa City, IA | 2.8 |
| Portland-South Portland, ME NECTA | 2.8 |
| Lawton, OK | 2.8 |
| Tulsa, OK | 2.8 |
| Spartanburg, SC | 2.8 |
| Nashville-Davidson--Murfreesboro--Franklin, TN | 2.8 |
| Appleton, WI | 2.8 |
| Oshkosh-Neenah, WI | 2.8 |
| Sheboygan, WI | 2.8 |
| Wausau, WI | 2.8 |
| Decatur, AL | 2.9 |
| Lafayette-West Lafayette, IN | 2.9 |
| Lawrence, KS | 2.9 |
| Bismarck, ND | 2.9 |
| Enid, OK | 2.9 |
| Corvallis, OR | 2.9 |
| Logan, UT-ID | 2.9 |
| Charlottesville, VA | 2.9 |
| La Crosse-Onalaska, WI-MN | 2.9 |
| Auburn-Opelika, AL | 3 |
| Birmingham-Hoover, AL | 3 |
| Daphne-Fairhope-Foley, AL | 3 |
| Indianapolis-Carmel-Anderson, IN | 3 |
| Boston-Cambridge-Nashua, MA-NH NECTA | 3 |
| Lansing-East Lansing, MI | 3 |
| Columbia, MO | 3 |
| Staunton-Waynesboro, VA | 3 |
| Fond du Lac, WI | 3 |
| Tuscaloosa, AL | 3.1 |
| Springfield, IL | 3.1 |
| California-Lexington Park, MD | 3.1 |
| Mankato-North Mankato, MN | 3.1 |
| Sioux Falls, SD | 3.1 |
| Midland, TX | 3.1 |
| Harrisonburg, VA | 3.1 |
| Winchester, VA-WV | 3.1 |
| Lewiston, ID-WA | 3.2 |
| Carbondale-Marion, IL | 3.2 |
| Fort Wayne, IN | 3.2 |
| Kalamazoo-Portage, MI | 3.2 |
| Grand Forks, ND-MN | 3.2 |
| Florence, SC | 3.2 |
| Green Bay, WI | 3.2 |
| Dothan, AL | 3.3 |
| Fayetteville-Springdale-Rogers, AR-MO | 3.3 |
| Washington-Arlington-Alexandria, DC-VA-MD | 3.3 |
| Bloomington, IN | 3.3 |
| Evansville, IN-KY | 3.3 |
| Topeka, KS | 3.3 |
| Lewiston-Auburn, ME NECTA | 3.3 |
| Trenton, NJ | 3.3 |
| Milwaukee-Waukesha-West Allis, WI | 3.3 |
| Montgomery, AL | 3.4 |
| San Jose-Sunnyvale-Santa Clara, CA | 3.4 |
| Gainesville, GA | 3.4 |
| Monroe, MI | 3.4 |
| Minneapolis-St. Paul-Bloomington, MN-WI | 3.4 |
| Rochester, MN | 3.4 |
| Amarillo, TX | 3.4 |
| Provo-Orem, UT | 3.4 |
| Richmond, VA | 3.4 |
| Roanoke, VA | 3.4 |
| San Francisco-Oakland-Hayward, CA | 3.5 |
| Danbury, CT NECTA | 3.5 |
| Wichita, KS | 3.5 |
| Baltimore-Columbia-Towson, MD | 3.5 |
| Jackson, MI | 3.5 |
| Portland-Vancouver-Hillsboro, OR-WA | 3.5 |
| Knoxville, TN | 3.5 |
| Austin-Round Rock, TX | 3.5 |
| Florence-Muscle Shoals, AL | 3.6 |
| Santa Rosa, CA | 3.6 |
| Des Moines-West Des Moines, IA | 3.6 |
| Worcester, MA-CT NECTA | 3.6 |
| Jefferson City, MO | 3.6 |
| Billings, MT | 3.6 |
| Asheville, NC | 3.6 |
| Durham-Chapel Hill, NC | 3.6 |
| Rapid City, SD | 3.6 |
| Virginia Beach-Norfolk-Newport News, VA-NC | 3.6 |
| New Haven, CT NECTA | 3.7 |
| Crestview-Fort Walton Beach-Destin, FL | 3.7 |
| Bangor, ME NECTA | 3.7 |
| Battle Creek, MI | 3.7 |
| Great Falls, MT | 3.7 |
| Ithaca, NY | 3.7 |
| Raleigh, NC | 3.7 |
| Sumter, SC | 3.7 |
| Chattanooga, TN-GA | 3.7 |
| College Station-Bryan, TX | 3.7 |
| Lubbock, TX | 3.7 |
| Eau Claire, WI | 3.7 |
| San Luis Obispo-Paso Robles-Arroyo Grande, CA | 3.8 |
| Danville, IL | 3.8 |
| South Bend-Mishawaka, IN-MI | 3.8 |
| Sioux City, IA-NE-SD | 3.8 |
| Niles-Benton Harbor, MI | 3.8 |
| Lincoln, NE | 3.8 |
| Jackson, TN | 3.8 |
| Ogden-Clearfield, UT | 3.8 |
| Salt Lake City, UT | 3.8 |
| Cheyenne, WY | 3.8 |
| Anniston-Oxford-Jacksonville, AL | 3.9 |
| Jonesboro, AR | 3.9 |
| Hartford-West Hartford-East Hartford, CT | 3.9 |
| Gainesville, FL | 3.9 |
| Coeur d'Alene, ID | 3.9 |
| Peoria, IL | 3.9 |
| Hagerstown-Martinsburg, MD-WV | 3.9 |
| Springfield, MA-CT NECTA | 3.9 |
| Midland, MI | 3.9 |
| Kansas City, MO-KS | 3.9 |
| Springfield, MO | 3.9 |
| Missoula, MT | 3.9 |
| Charlotte-Concord-Gastonia, NC-SC | 3.9 |
| Bend-Redmond, OR | 3.9 |
| Cleveland, TN | 3.9 |
| Lynchburg, VA | 3.9 |
| Napa, CA | 4 |
| Boulder, CO | 4 |
| Bridgeport-Stamford-Norwalk, CT NECTA | 4 |
| Miami-Fort Lauderdale-West Palm Beach, FL | 4 |
| Naples-Immokalee-Marco Island, FL | 4 |
| Muncie, IN | 4 |
| St. Louis, MO-IL | 4 |
| New York-Newark-Jersey City, NY-NJ-PA | 4 |
| Hickory-Lenoir-Morganton, NC | 4 |
| Wilmington, NC | 4 |
| Winston-Salem, NC | 4 |
| Eugene, OR | 4 |
| Salem, OR | 4 |
| Abilene, TX | 4 |
| San Angelo, TX | 4 |
| Blacksburg-Christiansburg-Radford, VA | 4 |
| Janesville-Beloit, WI | 4 |
| San Diego-Carlsbad, CA | 4.1 |
| Norwich-New London-Westerly, CT-RI NECTA | 4.1 |
| Kokomo, IN | 4.1 |
| Dubuque, IA | 4.1 |
| Leominster-Gardner, MA NECTA | 4.1 |
| Muskegon, MI | 4.1 |
| Joplin, MO | 4.1 |
| St. Joseph, MO-KS | 4.1 |
| Albany-Schenectady-Troy, NY | 4.1 |
| Burlington, NC | 4.1 |
| Johnson City, TN | 4.1 |
| Bremerton-Silverdale, WA | 4.1 |
| Mobile, AL | 4.2 |
| Fort Smith, AR-OK | 4.2 |
| Fort Collins, CO | 4.2 |
| North Port-Sarasota-Bradenton, FL | 4.2 |
| Orlando-Kissimmee-Sanford, FL | 4.2 |
| Tallahassee, FL | 4.2 |
| Athens-Clarke County, GA | 4.2 |
| Atlanta-Sandy Springs-Roswell, GA | 4.2 |
| Augusta-Richmond County, GA-SC | 4.2 |
| Savannah, GA | 4.2 |
| Warner Robins, GA | 4.2 |
| Davenport-Moline-Rock Island, IA-IL | 4.2 |
| Kankakee, IL | 4.2 |
| Terre Haute, IN | 4.2 |
| Cedar Rapids, IA | 4.2 |
| Waterloo-Cedar Falls, IA | 4.2 |
| St. Cloud, MN | 4.2 |
| Kingston, NY | 4.2 |
| Gettysburg, PA | 4.2 |
| Kingsport-Bristol-Bristol, TN-VA | 4.2 |
| Morristown, TN | 4.2 |
| San Antonio-New Braunfels, TX | 4.2 |
| Wichita Falls, TX | 4.2 |
| St. George, UT | 4.2 |
| Cape Coral-Fort Myers, FL | 4.3 |
| Jacksonville, FL | 4.3 |
| Pensacola-Ferry Pass-Brent, FL | 4.3 |
| Tampa-St. Petersburg-Clearwater, FL | 4.3 |
| Brunswick, GA | 4.3 |
| Flint, MI | 4.3 |
| Cape Girardeau, MO-IL | 4.3 |
| New Bern, NC | 4.3 |
| Myrtle Beach-Conway-North Myrtle Beach, SC | 4.3 |
| Memphis, TN-MS-AR | 4.3 |
| Dallas-Fort Worth-Arlington, TX | 4.3 |
| Sherman-Denison, TX | 4.3 |
| Walla Walla, WA | 4.3 |
| Morgantown, WV | 4.3 |
| Racine, WI | 4.3 |
| Gadsden, AL | 4.4 |
| Little Rock-North Little Rock-Conway, AR | 4.4 |
| Palm Bay-Melbourne-Titusville, FL | 4.4 |
| Panama City, FL | 4.4 |
| Rome, GA | 4.4 |
| Decatur, IL | 4.4 |
| Hattiesburg, MS | 4.4 |
| Omaha-Council Bluffs, NE-IA | 4.4 |
| Greensboro-High Point, NC | 4.4 |
| Greenville, NC | 4.4 |
| Columbus, OH | 4.4 |
| Lancaster, PA | 4.4 |
| State College, PA | 4.4 |
| Odessa, TX | 4.4 |
| Valdosta, GA | 4.5 |
| Michigan City-La Porte, IN | 4.5 |
| Lexington-Fayette, KY | 4.5 |
| Louisville/Jefferson County, KY-IN | 4.5 |
| Saginaw, MI | 4.5 |
| Jackson, MS | 4.5 |
| Santa Fe, NM | 4.5 |
| Goldsboro, NC | 4.5 |
| Albany, OR | 4.5 |
| Tyler, TX | 4.5 |
| Waco, TX | 4.5 |
| Olympia-Tumwater, WA | 4.5 |
| Casper, WY | 4.5 |
| Oxnard-Thousand Oaks-Ventura, CA | 4.6 |
| Denver-Aurora-Lakewood, CO | 4.6 |
| Greeley, CO | 4.6 |
| Macon-Bibb County, GA | 4.6 |
| Rockford, IL | 4.6 |
| Pittsfield, MA NECTA | 4.6 |
| Cincinnati, OH-KY-IN | 4.6 |
| Medford, OR | 4.6 |
| Bellingham, WA | 4.6 |
| Phoenix-Mesa-Scottsdale, AZ | 4.7 |
| Sacramento--Roseville--Arden-Arcade, CA | 4.7 |
| Hinesville, GA | 4.7 |
| Bay City, MI | 4.7 |
| Grand Island, NE | 4.7 |
| Rochester, NY | 4.7 |
| Hot Springs, AR | 4.8 |
| Columbus, GA-AL | 4.8 |
| Chicago-Naperville-Elgin, IL-IN-WI | 4.8 |
| Harrisburg-Carlisle, PA | 4.8 |
| Clarksville, TN-KY | 4.8 |
| Deltona-Daytona Beach-Ormond Beach, FL | 4.9 |
| Lakeland-Winter Haven, FL | 4.9 |
| Port St. Lucie, FL | 4.9 |
| Punta Gorda, FL | 4.9 |
| Detroit-Warren-Dearborn, MI | 4.9 |
| Duluth, MN-WI | 4.9 |
| Elmira, NY | 4.9 |
| Syracuse, NY | 4.9 |
| Jacksonville, NC | 4.9 |
| Dayton, OH | 4.9 |
| Providence-Warwick, RI-MA NECTA | 4.9 |
| Killeen-Temple, TX | 4.9 |
| Fairbanks, AK | 5 |
| Vallejo-Fairfield, CA | 5 |
| Waterbury, CT NECTA | 5 |
| York-Hanover, PA | 5 |
| El Paso, TX | 5 |
| Prescott, AZ | 5.1 |
| Riverside-San Bernardino-Ontario, CA | 5.1 |
| Sebastian-Vero Beach, FL | 5.1 |
| Dalton, GA | 5.1 |
| Gulfport-Biloxi-Pascagoula, MS | 5.1 |
| Utica-Rome, NY | 5.1 |
| Grants Pass, OR | 5.1 |
| Philadelphia-Camden-Wilmington, PA-NJ-DE | 5.1 |
| Houston-The Woodlands-Sugar Land, TX | 5.1 |
| Victoria, TX | 5.1 |
| Anchorage, AK | 5.2 |
| Tucson, AZ | 5.2 |
| Ocala, FL | 5.2 |
| Albany, GA | 5.2 |
| Owensboro, KY | 5.2 |
| Buffalo-Cheektowaga-Niagara Falls, NY | 5.2 |
| Lebanon, PA | 5.2 |
| Laredo, TX | 5.2 |
| Mount Vernon-Anacortes, WA | 5.2 |
| Spokane-Spokane Valley, WA | 5.2 |
| New Bedford, MA NECTA | 5.3 |
| Reno, NV | 5.3 |
| Albuquerque, NM | 5.3 |
| Longview, TX | 5.3 |
| Kennewick-Richland, WA | 5.3 |
| Bowling Green, KY | 5.4 |
| Baton Rouge, LA | 5.4 |
| Toledo, OH | 5.4 |
| Chambersburg-Waynesboro, PA | 5.4 |
| Texarkana, TX-AR | 5.4 |
| Seattle-Tacoma-Bellevue, WA | 5.4 |
| Wenatchee, WA | 5.4 |
| Colorado Springs, CO | 5.5 |
| Dover, DE | 5.5 |
| Cumberland, MD-WV | 5.5 |
| Barnstable Town, MA NECTA | 5.5 |
| Glens Falls, NY | 5.5 |
| Fayetteville, NC | 5.5 |
| Rocky Mount, NC | 5.5 |
| Santa Maria-Santa Barbara, CA | 5.6 |
| Lake Charles, LA | 5.6 |
| New Orleans-Metairie, LA | 5.6 |
| Binghamton, NY | 5.6 |
| Akron, OH | 5.6 |
| Springfield, OH | 5.6 |
| Longview, WA | 5.6 |
| Los Angeles-Long Beach-Anaheim, CA | 5.7 |
| Elizabethtown-Fort Knox, KY | 5.7 |
| Houma-Thibodaux, LA | 5.7 |
| Lima, OH | 5.7 |
| Corpus Christi, TX | 5.7 |
| Salisbury, MD-DE | 5.8 |
| Atlantic City-Hammonton, NJ | 5.8 |
| Allentown-Bethlehem-Easton, PA-NJ | 5.8 |
| Reading, PA | 5.9 |
| Charleston, WV | 5.9 |
| Mansfield, OH | 6 |
| Sebring, FL | 6.1 |
| Lafayette, LA | 6.1 |
| Canton-Massillon, OH | 6.1 |
| Huntington-Ashland, WV-KY-OH | 6.1 |
| Altoona, PA | 6.2 |
| Pittsburgh, PA | 6.2 |
| Grand Junction, CO | 6.3 |
| The Villages, FL | 6.3 |
| Alexandria, LA | 6.3 |
| Vineland-Bridgeton, NJ | 6.3 |
| Shreveport-Bossier City, LA | 6.4 |
| Bloomsburg-Berwick, PA | 6.4 |
| Sierra Vista-Douglas, AZ | 6.5 |
| Homosassa Springs, FL | 6.6 |
| Parkersburg-Vienna, WV | 6.6 |
| Lake Havasu City-Kingman, AZ | 6.7 |
| Chico, CA | 6.7 |
| Carson City, NV | 6.7 |
| Las Vegas-Henderson-Paradise, NV | 6.7 |
| Beckley, WV | 6.7 |
| Redding, CA | 6.8 |
| Hammond, LA | 6.8 |
| Yakima, WA | 6.8 |
| Pine Bluff, AR | 6.9 |
| Pueblo, CO | 6.9 |
| Monroe, LA | 6.9 |
| Erie, PA | 6.9 |
| Weirton-Steubenville, WV-OH | 7 |
| Flagstaff, AZ | 7.1 |
| Youngstown-Warren-Boardman, OH-PA | 7.2 |
| Farmington, NM | 7.3 |
| Cleveland-Elyria, OH | 7.3 |
| East Stroudsburg, PA | 7.4 |
| Scranton--Wilkes-Barre--Hazleton, PA | 7.4 |
| Williamsport, PA | 7.4 |
| Brownsville-Harlingen, TX | 7.4 |
| Las Cruces, NM | 7.5 |
| Watertown-Fort Drum, NY | 7.5 |
| Beaumont-Port Arthur, TX | 7.5 |
| Wheeling, WV-OH | 7.6 |
| Johnstown, PA | 7.7 |
| Santa Cruz-Watsonville, CA | 7.9 |
| Modesto, CA | 8.3 |
| Stockton-Lodi, CA | 8.3 |
| McAllen-Edinburg-Mission, TX | 8.5 |
| Yuba City, CA | 10 |
| Madera, CA | 10.5 |
| Fresno, CA | 10.8 |
| Ocean City, NJ | 11.4 |
| Salinas, CA | 11.8 |
| Bakersfield, CA | 12 |
| Hanford-Corcoran, CA | 12.3 |
| Merced, CA | 12.9 |
| Visalia-Porterville, CA | 14.5 |
| Yuma, AZ | 14.8 |
| El Centro, CA | 20.5 |
For more information on jobs, Louisiana and our economic drivers, read our articles:
February 2020: Unanticipated Consequence of Reduced Affordable Housing
November 2019: New Orleans At The Top Of The Jobless List
October 2019: States Have Worse Than Average Unemployment Rates
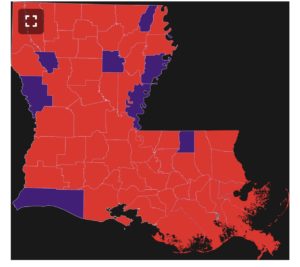
3,315 positive cases with 137 deaths due to COVID19.
Number of adults in Louisiana.
Have the virus. If you go to Home Depot today, you are around approximately 150 people. Per trip.
In the hospital that have the virus.
On ventilator that are in the hospital.
Dead that were on the ventilator.
If you remember your statistics class in business school, the math says if you get the virus, the odds of dying is the sum of 1/3 times 1/3 times 1/2.5 or one in twenty-five.
 The Tax Cuts and Jobs Act of 2017 substantially reduced corporate taxes, from 35 percent to 21 percent. Some commentators and practitioners have voiced concerns about how the new tax law will affect demand for Low Income Housing Tax Credits (LIHTC), America's primary mechanism for producing new housing. According to Dawn Luke, chief operating officer with Invest Atlanta, the lowering of the corporate tax rate continues to present challenges to the market in terms of LIHTC pricing, with credit prices being lowered by as much as 16 cents on the dollar for projects in the near-term pipeline. Luke says this means that several affordable housing projects could become bottle-necked as developers scramble to find subsidy to fill this gap. In addition, this firm expects that declining demand for LIHTCs will generate 20,000 fewer low-income housing units a year, a roughly 15 percent decline.
 It's worth taking a few moments to review how the LIHTC actually works. The LIHTC program, created as part of the Tax Reform Act of 1986, allows developers to receive tax credits in exchange for committing to rent their units for 30 years to households earning less than 50 to 60 percent of the area's median income. Private developers apply to receive an LIHTC subsidy through their state housing authorities, and are allocated a subsidy equal to a percentage of construction and eligible soft costs. Developers awarded an allocation receive a 10-year annuity of nonrefundable tax credits that they can use to offset positive future federal income tax liability. For example, through the program, the developer of a $10 million apartment building could receive up to $1.17 million a year for 10 years. (This assumes that the developer would receive a 9 percent allocation and the project would be located in either a sufficiently low-income neighborhood or a high-rent metro area.)
Due to the rental restrictions, it is virtually impossible for LIHTC properties themselves to generate enough tax liability to claim the full value of allocated tax credits, so developers need to have either sufficient other federal income tax to offset or the income tax of a limited partner. These outside investors, usually organized through a partnership called syndication, would contribute a fixed dollar amount to the developer upon completion of the subsidized property in exchange for 99.9 percent of the equity, including allocated tax credits, of the project. The allocated tax credits themselves offer a dollar-for-dollar reduction in future tax liability, so changing the corporate tax rate does not directly reduce their statutory value.
 First, the recent tax cuts reduce the pool of firms with sufficient tax liability. If a business has less tax liability than it has tax credits, that business would effectively leave money on the table. The business would have to at least wait until it had enough tax liability to claim the subsidy. Several past investors in LIHTC properties, including Fannie Mae, learned firsthand how illiquid their LIHTC investment actually was after the 2008 financial crisis. With the lower corporate rate and other favorable provisions that are coming out of the new tax law, some firms that previously may have found the investment profitable may well reconsider. Even firms that expect to have large profits may now have greater uncertainty about their future taxes as they work through the 1,100-page bill. The increased risk could cause firms to value less any future reductions in their tax liability.
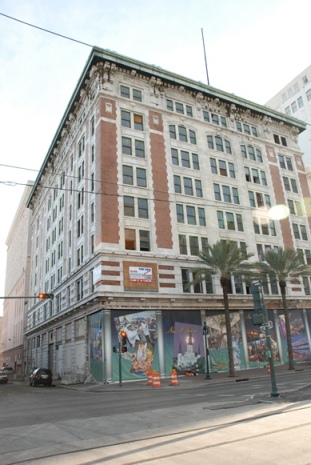 The owner of an LIHTC project, like owners of all residential buildings, gets to deduct the building’s depreciation over a 27.5-year schedule. These depreciation allowances, coupled with LIHTC rental restrictions and relatively high operation costs due to compliance with those restrictions, often result in large expected tax losses that go beyond the allocated tax credits. For example, the $10 million apartment building mentioned above would be expected to generate more than $290,000 in depreciation allowances a year that outside investors not limited by passive-loss restrictions (such as C corporations) could use to offset other taxable income. The reduction in the corporate rate from 35 percent to 21 percent would lead to about a $626,000 decrease in outside investors’ willingness to pay developers for those deductions under reasonable assumptions. (A potential headache is that depreciation allowances are subject to recapture if the project is eventually sold for more than tax basis. This provision rarely needs to be enforced.) This represents a 5.9 percent reduction in the overall valuation of the investment, which could require additional debt on the property and perhaps make some projects no longer feasible.
At the same time, lower taxes should expand the supply of market-rate housing. Only a small fraction of low-income households occupies newly built, rent-capped homes produced under the LIHTC. Most of these households use their own earnings or HUD vouchers to pay the market rents for older, existing apartments. A recent study by Stuart Rosenthal in the American Economic Review showed that while newly constructed units are often unaffordable for most households, they eventually supply the majority of future low-income affordable housing. This "filtering down" occurs as a result of physical depreciation or shifts in style or location preferences. If lower taxes generate new market-rate construction—and thus increase the aggregate supply of housing—these lower taxes should lower rents throughout the market or increase landlord participation in HUD voucher programs.

After Hurricane Katrina, the Crystal hot sauce manufacturing plant, located in a residential neighborhood near Carrollton Avenue, was demolished and new affordable apartments constructed.

The Preserve Apartments now stand where a previous industrial site once produced hot sauce. New Orleans worked with developers to change the zoning code and today the apartments are in high demand.
Eriksen and Lang suggest two changes to the LIHTC program that would increase the supply of affordable housing produced under the program without increasing tax expenditures. The first, and most immediate, would be simply to make the allocated tax credits through the LIHTC program refundable, because uncertainty about future tax liabilities reduces both the pool of otherwise eligible investors and the market value of allocated tax credits. Making this change would also give some developers at least the option of claiming the credit themselves rather being forced to partner with outside investors. The second change would allow developers to claim an actuarially equivalent subsidy over a shorter time period than the currently required 10 years. Developers and LIHTC investors are thought to have a much higher cost of capital than the federal government. In the extreme, allowing developers to claim the full value of refundable tax credits when projects are completed would give them the greatest flexibility in financing their projects.
Increasing the supply of housing affordable to low-income families could be achieved using other policies that focus on reducing other barriers to increasing housing production, like state and local zoning laws that limit the location and density of multifamily housing.
Tax Incentives Can Revitalize New Orleans East
Researching construction activity across 382 metropolitan markets in the United States, data show new office-construction projects were double office renovations from 2003 to 2008, but then everything changed when financing dried up for new construction projects due to the mortgage industry meltdown and collapse of financial institutions. The surprise is that this 2008 trend still affects the office market today.
Chart 1 shows the composition of office starts, comparing new office construction starts to office renovation starts. Office renovation starts include additions, alterations and conversions from one property type to another. Nationwide statistics come from Dodge Data & Analytics, formerly known as McGraw Hill Construction, which collects project-level data and identifies the type of construction including new construction, addition, alteration, and conversion. Results show that new construction has dropped from 65% to 30% of total construction and office renovation is now around 70% of all office construction.
In chart 2, the blue line represents the number of new office construction starts, and the orange line represents the number of office renovation starts. New office construction starts increased sharply from 2003 until 2005, when the number of projects leveled off. Office renovation starts increased during the same period, though at a much more modest pace, then also leveled off in 2005. New office construction starts began to drop in the first few months of the recession and fell sharply until the middle of 2010, while office renovation starts appeared to continue at a steady pace until halfway through the recession before softening a bit. Both new office construction and office renovation starts flattened out and continued at an unchanged pace throughout the early years of the recovery. New office construction starts experienced very little in the way of an uptick until 2016. Office renovation starts, on the other hand, began to rise at a fairly quick pace starting in 2015.
Office demand nationwide has been steady and is somewhat correlated to GDP but can vary widely by market. In major cities, Class A office space is in high demand, but in smaller markets, office rates are often offset by substantial free rent and tenant improvement allowances. Until financing for new construction becomes more available, new office construction will continue to decline. Eventually this will lead to higher lease rates, which will, in turn, lead to new construction. The free market system will always drive toward equilibrium, so keep on eye on lease rates which will trigger the trend change.
For more information on the office market, read our articles:
Office Space For Lease Defies Law of Economics
Office Lease vs Sale Prices In New Orleans and Metairie
At year end, there are 284 industrial properties totaling 6.3 million square feet for sale and for lease, comprised of 3.3 million square feet in 193 (67%) properties for lease at $5.38 per square foot and 2.9 million square feet in 91 properties (33%) for sale averaging $45.69 PSF. The average property has been on the market 238 days. At the beginning of the year, there was one less property listed than at the end, but the total was 5.7 million SF, so 2019 witnessed 600,000 net square feet come on the market, entirely in the leasing market.
The was no change in the square footage for sale. Asking lease rates increased from $5.28 PSF to $5.38 PSF and asking sale prices increased from $41.63 PSF to $45.69 PSF. The numbers defy traditional economics since with no additional supply, sale prices rose and lease prices also rose even though supply increased 15%. The explanation is that newer and more attractive buildings came on the market for sale and for lease, driving prices higher.
Commercial real estate agents reported 48 sale transactions in the New Orleans/Metairie MSA industrial sector during 2019, totaling $35 million and 550,000 square feet, with 13 transactions ranging from $1 million to $2.5 million, and the remaining 35 transactions below $1 million. The average price was $800,000 for a 14,000 square foot building, or $64 per square foot, and was on the market for 234 days. Sales were concentrated on the West Bank (35% of total) and in Elmwood (30% of total).
There were 97 completed leases totaling 800,000 SF reported in 2019, mostly in the Elmwood area and 25% in the airport area. Lease rates ranged from $3.50 PSF to $13.58 PSF. The leases averaged $7.29 PSF for an 8,000 SF building and were on the market for almost 10 months.


| Metropolitan area | September 2019 Unemployment Rate |
| Lake Charles, LA | 3.70% |
| Baton Rouge, LA | 4.20% |
| New Orleans-Metairie, LA | 4.20% |
| Houma-Thibodaux, LA | 4.40% |
| Lafayette, LA | 4.50% |
| Shreveport-Bossier City, LA | 4.90% |
| Alexandria, LA | 5.00% |
| Hammond, LA | 5.10% |
| Monroe, LA | 5.10% |


Tariffs are bad. Tariffs are passed along to consumers in the form of higher prices which takes money from consumers and gives it to the government. Government spends the money eventually, but it is always an inefficient spender. It used to be that the Republican Party was against making government bigger and always wanted individuals to have control over their money, but things have changed. And this change is bad for business.
The SIOR Report, a magazine for the commercial real estate industry focusing on the office and industrial markets, recently interviewed Louisiana Commercial Realty broker, Robert Hand, for thoughts on how tariffs will affect the commercial real estate market. SIOR is the most prestigious commercial real estate trade organization, established in 1939 with 3,300 of the top commercial real estate members in 685 cities and 36 countries.

Hand provides some background on the latest tariff news: "Tariff negotiations have been going on for almost 2 years, but on September 1st, Trump imposed a 15% tariff tax on goods purchased by Americans that were made in China. Trump imposed the tariffs on nearly all of the $550 billion in U.S. imports from China because negotiations the month before fell apart. The tariff was then delayed to take effect on December 15th with the idea that by doing so, it would not dampen the economic impact of Christmas sales because the tariff applied to cell phone, toys and computers. As of today, Trump has agreed to cancel $250 billion of tariffs if China will purchase more soybeans and grains and improve protection on intellectual property."
Broker Robert Hand is in the trenches, since his clients are looking to build warehouses to store inventory and lease office space to manage growth into a new territory, so he sees effects of tariff talk on businesses who stop expanding during the uncertainty.
Hand explains, "Tariffs steal money from consumers' pockets by causing prices to increase. Tariffs steal creativity, reward inefficiencies and destroy the competitive drive that allows a free market economy to deliver cheaper, smarter and more innovative products."
For more information on tariffs, read Hand's article, "Every Economics Textbook Teaches Us Tariffs Are Bad".
Not all states are enjoying the benefits of September's 3.5% national average unemployment rate; in fact, 50% of the states have worse unemployment than the average and about 25% have much worse. Only 3 states enjoyed an increase in nonfarm payroll employment: Kentucky, Idaho and Hawaii.

Alaska is suffering the highest unemployment at 6.2%, with Mississippi next in line at 5.4%. Louisiana ranks 9th from bottom at 4.3%. Michigan and Ohio also fall in this category, voting their dissatisfaction.

California is a $3 trillion dollar economy, ranked the 5th largest in the world, so it's 4% unemployment puts a drag on the national average. Pennsylvania and New York are also strategic voting states and fall in the slightly worse job category.
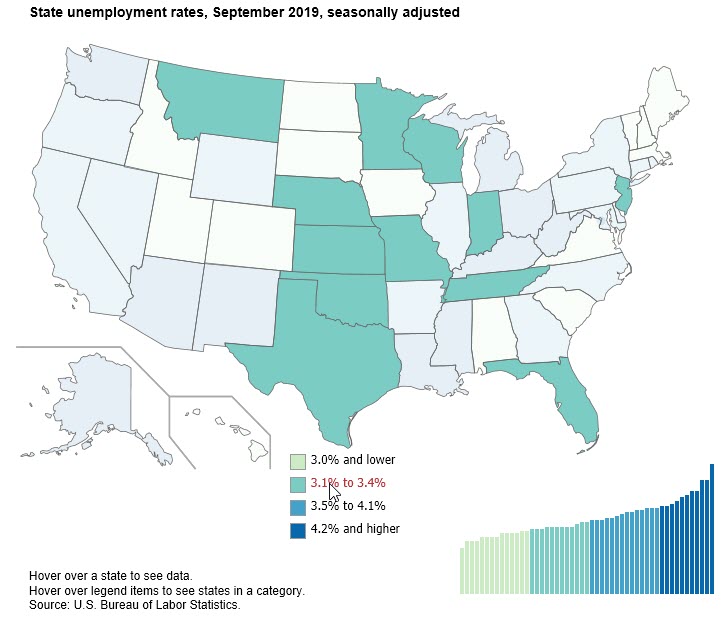
Texas has no state income tax and is business friendly which helps increase population which leads to jobs. When you add in Florida, Minnesota and Wisconsin plus the middle America states, you can see why better off voters can vote Trump another 4 years.
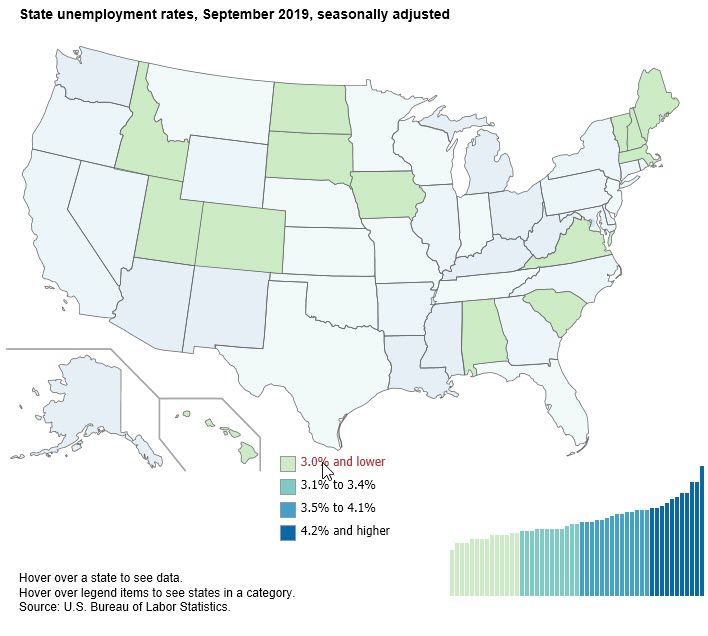
Vermont had the lowest unemployment rate in September 2019, at 2.2 percent. Something powerful is happening in Alabama, Colorado, and New Jersey which had the largest over-the-year unemployment rate decreases (-0.8 percentage each).

Mississippi's unemployment rate is the 2nd worst in the nation at 5.4%, but it hasn't always been that way. It's been worse. Since 1976 when the Bureau of Labor first reports data, Mississippi only had an unemployment rate below 5% in 2 out of the 43 years: from October 2017 to August 2019.


Mississippi's labor force increased steadily from 1976 at 961,115 to year 2000 at 1,252,180, then stagnated to 1,287,413 in September 2019. That's essentially zero growth in the labor force the last 20 years, even though the unemployment rate is near it's lowest level in 40 years.
Compared to the national labor force which increased 72% from 1976 to 2019, Mississippi sucks hind teat at 30%. Had Mississippi kept pace with the national average, the labor force would be higher by 365,000, or 30% more workers. Mississippi just need more people moving into the state.
In summary, the unemployment rate is a misleading indicator of health. A steadily growing labor force is a better indicator since it means the population is increasing which leads to more jobs, higher production of goods and services, higher tax revenue for government spending and higher wages which leads to higher consumer spending which further drives new business formation and continues the domino effect.

WWL reporter Caresse Jackman just completed a stunning 4 part series called "The Forgotten East: a view into the past, present and future of the largest neighborhood in New Orleans", and at the end of the last segment, WWL invited Louisiana Commercial Realty to join civic leaders and city councilwoman Cyndi Nguyen for a roundtable heart-to-heart discussion of how to rebuild New Orleans East.
Louisiana Commercial Realty president, Robert Hand, had just completed an update to his 2010 report, "What Businesses Are Needed in New Orleans East" for the East New Orleans Business Development District, and discussed the strengths of the east and specific ideas to bring people and businesses to the area.
I'm in the trenches, says Hand, since I'm the first person people call when they want to find the perfect location for their business. My research shows the east needs grocery stores, furniture stores and restaurants, and the technology to determine what businesses will thrive is pretty amazing. We harvest data from the government and consumer spending databases so we know the east spends $82 million a year at grocery stores, but we also know of the 1300 businesses in the east that only $53 million is sold by grocery stores located in the east, so there is a gap of $29 million in spending by residents living in the east who travel outside the east to shop at grocery stores. That means it is a real opportunity for a grocery store to open a location in the east and capture part of that $29 million in existing grocery spending.
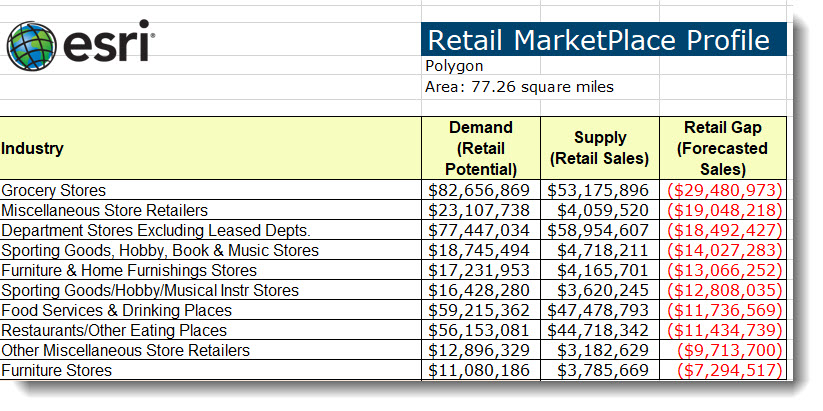
For summary on what businesses are needed in the east, read the Louisiana Commercial Realty report, "Feasibility of Business Development In New Orleans East".


Lease prices for office space in the New Orleans/Metairie Metropolitan Statistical Area averaged $17.78 per square foot, and sale prices averaged $137 per square foot. There are 1,045 office properties for sale or lease and, of those, 895 are for lease and 150 for sale. Last month 32 office spaces were leased, which is above the average of 25 monthly for the last 2 years. and 5 office properties were sold. The average office property is on the market for 327 days.
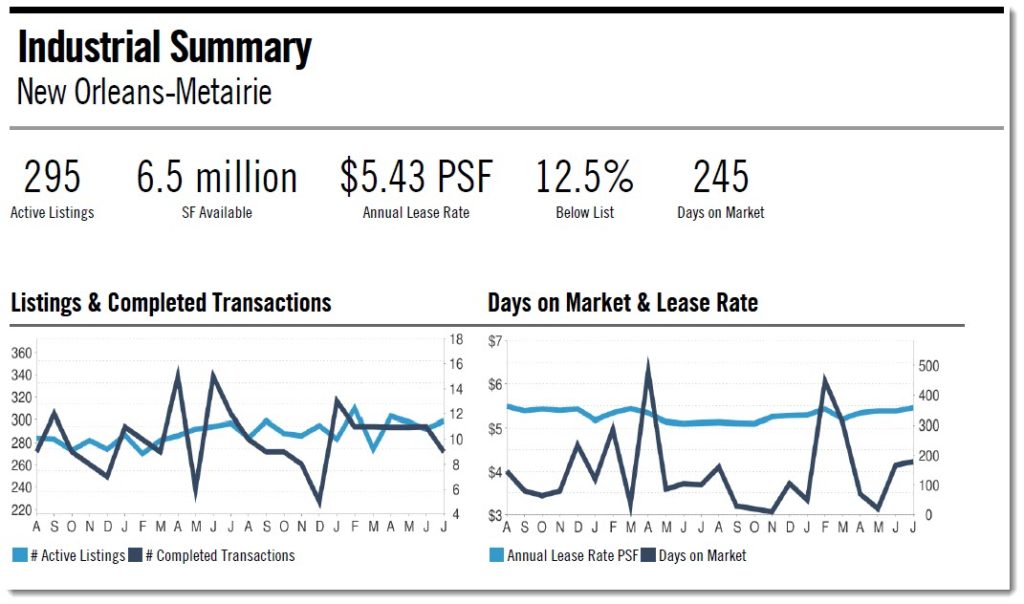
Of the 201 warehouses available for lease totaling 3.2 million square feet in the New Orleans/Metairie Metropolitan Statistical Area , 7 were leased averaging $6.98 per square foot, and of the 94 warehouses totaling 3.3 million square feet, 2 sold averaging $86 per square foot. There are 295 industrial properties for sale or lease totaling 6.5 million square feet. The average office property is on the market for 245 days.

Of the 600 retail spaces available totaling 3.7 million square feet in the New Orleans/Metairie Metropolitan Statistical Area , 448 totaling 2 million SF are for lease and 152 totaling 1.6 million SF are for sale. Last month, 15 were leased averaging $18.62 per square foot, and 2 sold averaging $98 per square foot. The average retail property is on the market for 308 days.

Of the 332 shopping center spaces available totaling 2.3 million square feet in the New Orleans/Metairie Metropolitan Statistical Area , 312 totaling 2.0 million SF are for lease and 20 totaling 338,000 SF are for sale. Last month, 3 were leased averaging $20.32 per square foot, and 1 sold averaging $139 per square foot. The average retail property is on the market for 177 days.
For more information on commercial real estate prices, read our previous articles:

Every college business student learns tariffs are bad for economies that believe in free markets and competition. Every economics textbook charts out how tariffs suck money out of consumers' pockets. Every MBA class learns it and they even teach it at Wharton. So if there is any government leader out there who attended Wharton and is promoting tariffs, someone needs to verify your degree.
At first glance, imposing tariffs or quotas appear to be the perfect solution to get American industries back on track to prosperity, but the reality is that tariffs steal money out of consumers’ pockets by increasing prices, stifling creativity, rewarding inefficiencies and destroying the competitive drive that allows a free market economy to deliver cheaper, smarter and innovative products to you. If you skipped college or avoided a business degree, you missed the most basic economics course that explains why tariffs and quotas work in communist countries but never work in a free market economy. This article refreshes you on Econ 101 and explains why tariffs in America cost you over $70 billion every year.

The price of a good is the intersection, or equilibrium, of the demand and the supply. The chart above illustrates the interaction between increased quantity and increased prices for buyers (demand curve) and suppliers (supply curve). The supply curve always rises since as prices increase, providers of goods want to sell more, and the demand curve always declines, since as prices rise, consumers always want to buy less. The intersection of supply and demand tells us the long term equilibrium of price and quantity.
A tariff is a tax on imports, paid to the government. Domestic producers are exempt from the tariff. A quota is a limit on the quantity allowed to be imported. The result of both is an increase in the price of the good, from the market price to the new tariff price. American manufacturers get to charge the new price, but manufacturers overseas receive the market price but pay the tariff to the US government. The government gains area “D” in the chart below (the revenue from the tariff); however, American consumers pay the higher price measured by areas A+B+C+D. Even if the government passes along to consumers the revenue from the tariff, the loss to consumers is still area B+D.

Tariffs and quotas are not sound public policy. The Congressional Budget Office's 95 page report explains in detail. And the Organization For Economic Cooperation and Development Report explains how our responses made things worse. And there is the Brookings Industry Report. Tariffs undermine competitive discipline which forces industries to always reduce cost and increase efficiency, driving creativity and invention. Protectionism has a narcotic effect, allowing sick industries to avoid facing up to their problems.
America has many precedents that teach us tariffs are bad policy, and the most obvious is the one industry promoted that tariffs will help today: steel. Going back 70 years, the steel industry was an oligopoly, with just a few manufacturers and little competition, allowing the industry to raise prices 9% annually in the late 1940’s (twice the rate of wholesale prices). In the early 1950’s, steel prices increased 4.8% annually at a time when the wholesale price index was falling. In the late 1950’s, steel prices increased 7.1% annually, three times wholesale prices. In 1969, quotas were imposed and steel prices increased 14 times greater than they had in the previous 9 years, during a time of recession and 25% of industry capacity in an idle state. The result was a lag in technology. American steel companies failed to introduce the oxygen process and continuous casting which put them at a disadvantage. Their oligopolistic pricing policy kept American companies from competing in the world market and eventually allowed imports to erode their market by producing a better product at a lower price. We can learn from history that tariffs are as un-American as you can get.

Last week it was reported that the vacant-since-Katrina 197 room Warwick Hotel at 1315 Gravier in New Orleans sold for $8 million, but like so many commercial properties in 300 year old New Orleans, it has a fascinating history including the mysterious death of an owner, a $300 million dollar fraud, Israeli organized crime, a grisly double murder, connections to the president of Israel and also a local prominent attorney, not to mention an uncanny ability to avoid any fines for building code violations for 14 years.

The Warwick Hotel is a 12 story, 120,000 square foot dilapidated hotel and vacant since Katrina. It was originally constructed in 1952 but renovated in 2000 and previously under the Ramada Inn and Comfort Inn flags. The 176 room property includes 22 oversized one-bedroom suites, 8 junior suites, rooms with one king or two queen beds and handicap accessible rooms. The hotel is closed and rooms gutted and some have mold.
The property records date back to 1951 when it was leased to the Warwick Corporation until sold in 1997 by owners Warwick Exchange, LLC and Rosary Hartel O'Neill for $1,300,000 to Warwick Corporation with Rob Mouton as the attorney at that time helping with the purchase. Recently the attorney was changed to Marc Dorsey who is related to a prolific developer in New Orleans who owns retail centers in New Orleans East and hotels downtown.

The primary owner with Warwick was Joseph Soleimani, who also owned the Sea Club Resort in Ft. Lauderdale, but in 2013 ownership of the Warwick was transferred to Shimon Levy. Soleimani died the next year. Levy was reported by David Kidwell at the Miami Herald as having ties to Israeli organized crime and spent a year in an Israeli prison. Levy was also convicted of tax evasion. His business partner at the Sea Club was Zvika Yuz who was shot in the face as he parked his car at the hotel. Yuz was an Israeli native who lived in Miami and was instrumental in one of the largest fraud schemes in Florida history, masterminding his 36 employees who bilked 1,800 investors out of $300 million. Yuz was believed to have been connected to the "List of 11", known as the top 11 Israeli organized crime figures. Yuz's business partner, Shimon Levy, spent a year in prison in 1981 after he helped hide two top organized crime figures wanted in a grisly double murder in Israel.
Warwick owner Levy was granted a visa to enter the US because immigration officials were unaware of his Israeli conviction as an accessory to murder, since former Israeli president Chaim Herzog ordered Levy's records destroyed.
Shimon Levy decided to let the Warwick Hotel sit vacant for 14 years, willing to forgo millions in lost income if the hotel had been in commerce. The common belief was that the purpose of Levy owning the hotel was simply to park illicit profits from crime and drugs, not so much as to make money.

The daily business operations for the vacant hotel were left to Yoram Moussaieff, who also operated Revolt, affiliated with Federal Jeans, an outlet in New York with reported $15 million in blue jean sales. Yoram and I discussed putting the property back into commerce several times over several years, and he arranged a tour in 2017. The building was dilapidated with mold and stripped of any copper wiring, common for neglected buildings after Katrina, but not so common 14 years later. After walking through each of the 12 floors with a contractor, we estimated it would take approximately $10 million to put the 197 rooms back into commerce, so our price for the property was $12 million. The owners thought it was worth $20 million, as-is. So the building sat vacant for another year.
Then the general manager called to report he had an offer for $18 million but would sell for $20 million to anyone else. The numbers just don't work at that price, but it appeared none of the principals listed by the Secretary of State for the Warwick Corporation (Shimon Levy, Eldad Israel and Yoram Moussaieff) had been to the property in 14 years since Katrina destroyed it, so they were unaware of a realistic value.
As a commercial real estate broker, I regularly analyze financials to determine a property's appropriate market price. After touring the Warwick and walking through each of the 176 rooms on the 12 floors, I prepared the best and worse case scenario below and other financials. This simple analysis gives you an insight into how a buyer approaches a valuation by working through the numbers backward. First you calculate the revenues you would generate after the project is finished. Then you back in expenses. What is left over is how much you can pay for the property now.

In the worse case scenario, the most elastic variable is the occupancy rate. For hotels, a bad number is 60%, which we saw a lot of during the 2008 recession. Room rates for high end hotels can average $150, but during the August hot month, even good hotels drop their rate to $100. This is a $50 drop, which is 33% and a disaster for hotels. So assuming the worst 60% occupancy but keeping the rate at $150 per night, the pro-forma revenues total $5.7 million and expenses average 60% at $2.3 million for a profit of $2.3 million annually. That values the hotel at $28 million, so you never want to have more than $20 million in an investment like that, because you have to allow for at least $8 million as compensation for putting your capital to work in this project versus something like an oil well. Hotels are so risky that recently, on an different project, 5 local banks refused to loan $5 million to a buyer who had $1 million deposit on a $6 million dollar renovation loan. So buyers have to be compensated for their risk especially when financing is difficult. That makes this scenario really a break-even transaction which scares most buyers away.

The best case scenario is what developers hope for but never count on. What if the occupancy rate rose to 80%? And on a night of a convention in town, Essence Festival, Jazz Fest, Mardi Gras, or any other reason we hope to have 13 million visitors this year versus 7 million last year, the room rate climbs to $225, then the revenues jump from $5.7 to $11.5 million and the net operating income approximates $4.6 million, valuing the business at $57 million. A well-run hotel can be very profitable, but there are very few who can run one well, which is why no bank wants to loan money to buy one.
For additional information on related topics, read these articles:
How To Value Commercial Property Using Cash Flow
How To Value Commercial Property Using Cap Rate
Why Nobody Wants To Build A Hotel At The New $2 Billion Dollar Airport
Why Blighted Property Still Exists In New Orleans, 14 Years Post Katrina
Money To Purchase Power Plant Came From Fraud
So You Want To Build A Hotel In New Orleans...Not So Fast!
Unless you go back to the 1970's, New Orleans East has never been an economic driver for the area. Even though it is the largest land area in New Orleans, if you ranked all the cities over 50,000 population by income per capita, the East would rank not in the bottom 10 percent but in the bottom ten. The closest city comparable to its economy is Flint, Michigan.
There is opportunity; however, especially if you follow the investment philosophy of buying straw hats in winter, and Louisiana Commercial Realty has completed a detailed research report which discovers there is a real need for grocery stores, sporting goods stores and restaurants in the East.
Using the latest technology to determine consumer spending which measures demand, then matching demand with supply, measured by sales figures from the 1,300 businesses already in the East, we find what is called the Marketplace Gap. This is the amount of money flowing out of the area because there are not enough businesses to satisfy demand.
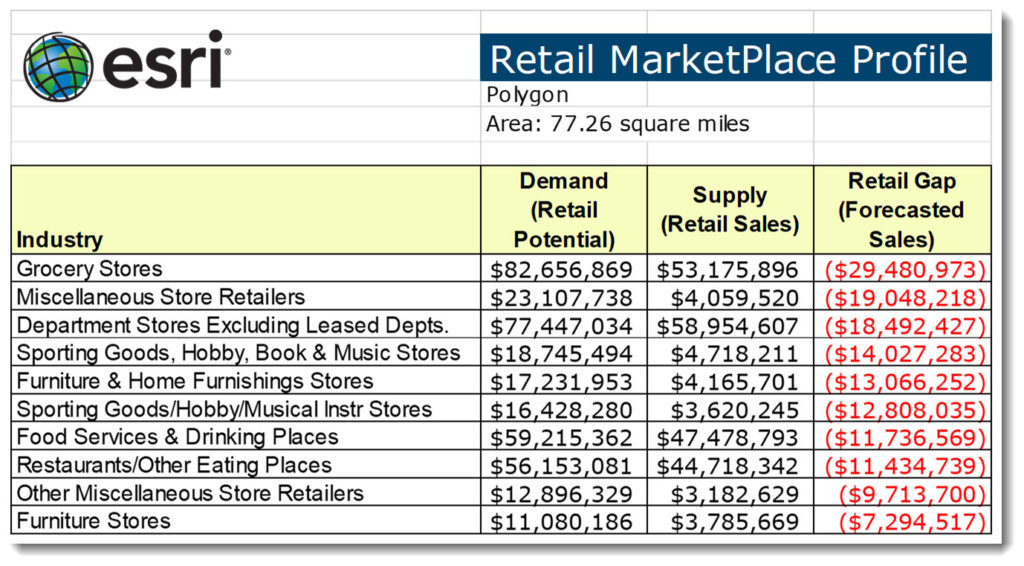
For example, businesses in New Orleans East sell $53 million of groceries annually; however, residents of the East spend $82 million annually, with $29 million leaving the area. That means there is a real need for a grocery store in the East, and forecasted sales would be at least $29 million. Businesses just have to find a way to fill the void and offer products that consumers are already buying elsewhere.
The East has a population of 75,969 with 56,089 adults in 27,142 households with a median annual income of $33,431. Where they spend their money can now be measured scientifically, by an calculation called the Market Potential Index. If the number exceeds 100, it means that a good or service is purchased more than average. The Retail Market Potential Analysis shows the number of adults purchasing specific products; for example, the index of 122 for buying cigarettes at a convenience store the last 30 days means that behavior occurs 22% more than normal, which means there is more demand, but there are only 7,488 adults making that purchase. Businesses coming into the area need a higher number of buyers, such as these purchases:
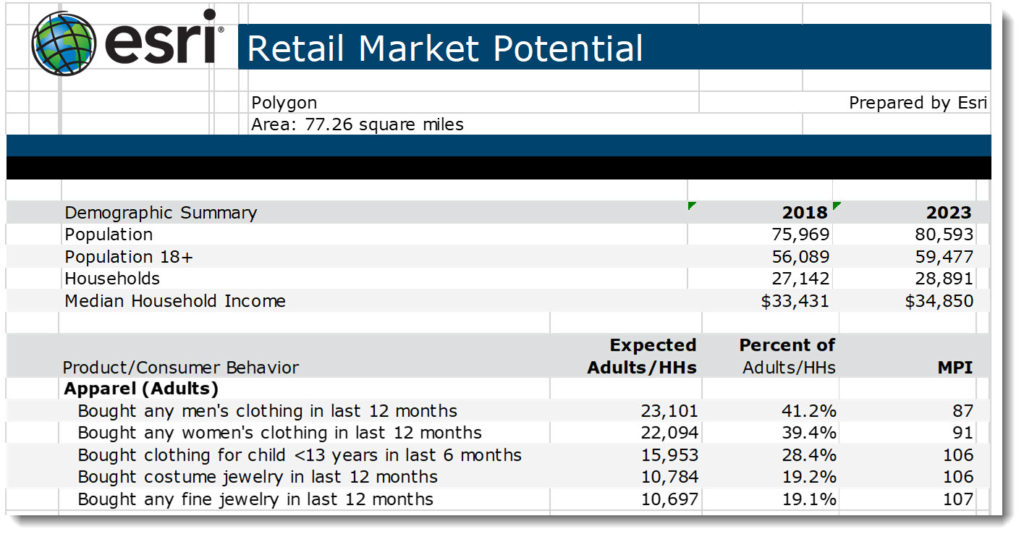
Residents of the East are 32% more likely to buy an Android smartphone and 37% less likely to buy an iPhone. They are big into fast food, with 23,000 visiting a fast food restaurant more than 9 times per month.
The Retail Goods and Services Expenditures Analysis shows how much money was spent, which can be used to determine market size for new businesses moving to the East.
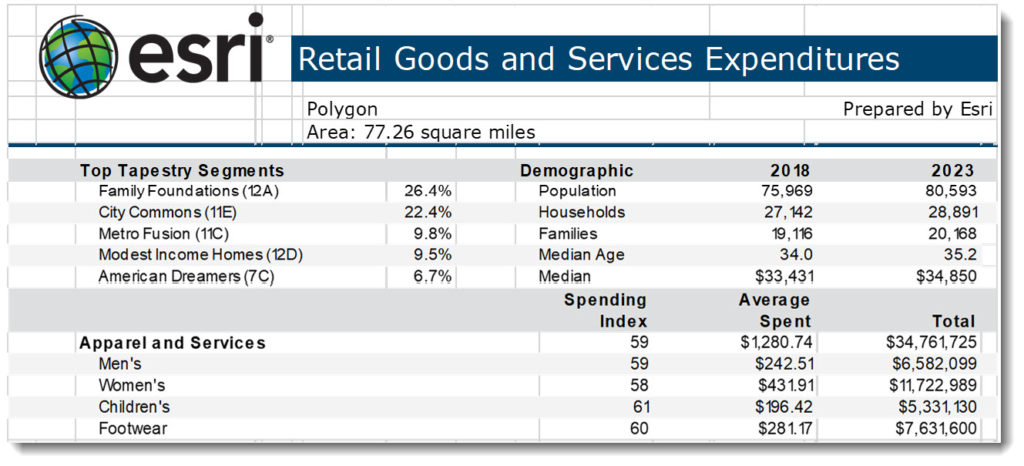
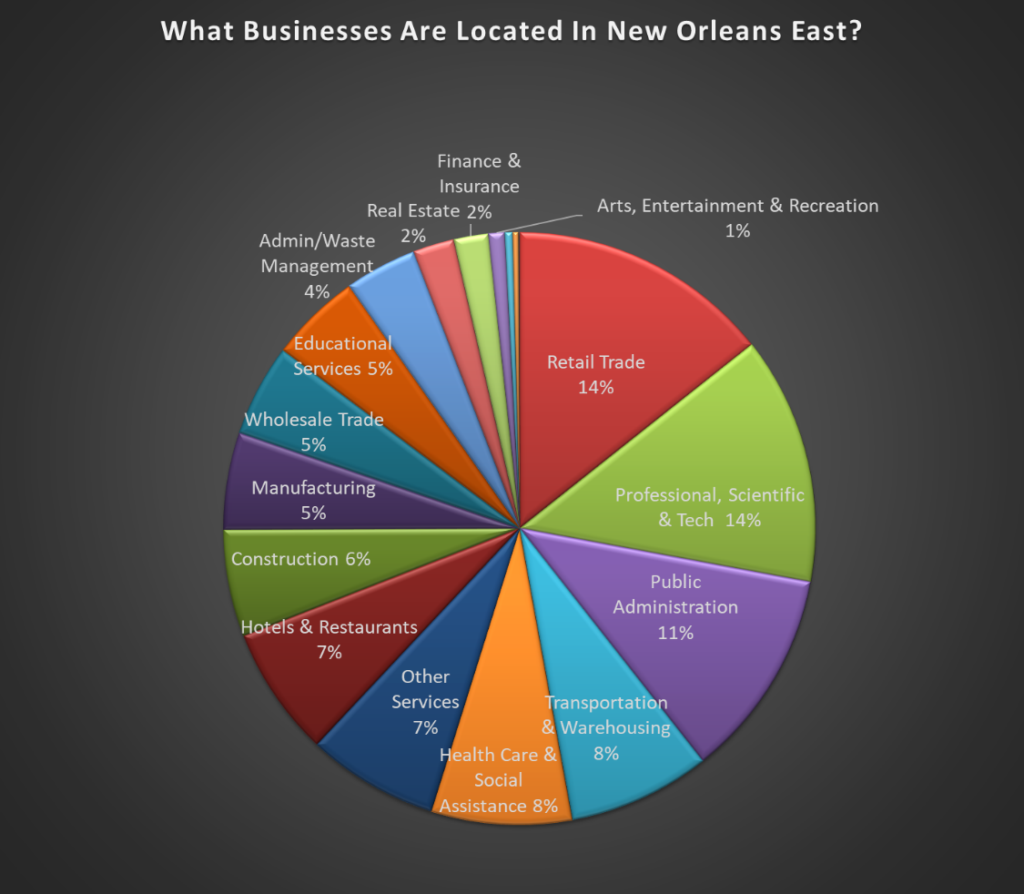
There are approximately 1,300 businesses employing 17,000 people in New Orleans East, and the largest sector is retail where 2,488 people are employed. Professional and scientific occupations are the next highest category with 2,351 employees (14% of total), followed by 1,989 government jobs (11%), and hotel, warehousing and health care the remaining employment sectors.
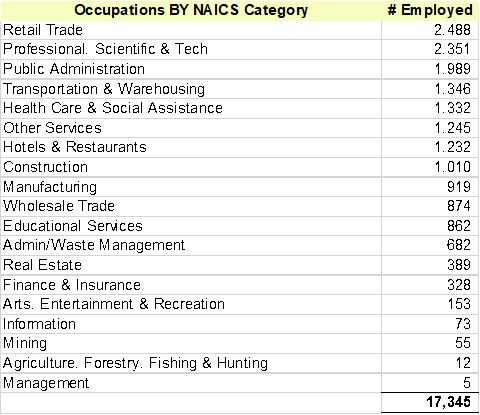
Over 50% of businesses located in New Orleans East have revenues under $1,000,000, with 34% having revenues under $500,000. This creates an opportunity for government assistance to educate small business owners on skills to improve their operations, such as marketing, social media, accounting, banking and human resources. There are 36 businesses with revenues exceeding $5,000,000 so an opportunity exists for the 256 businesses with revenues under $1,000,000 to provide services to these larger businesses, offering reduced transportation costs and a higher level of service.

60% of businesses have under 9 employees, with the largest size of less than 4 employees amounting to 29% of all businesses.
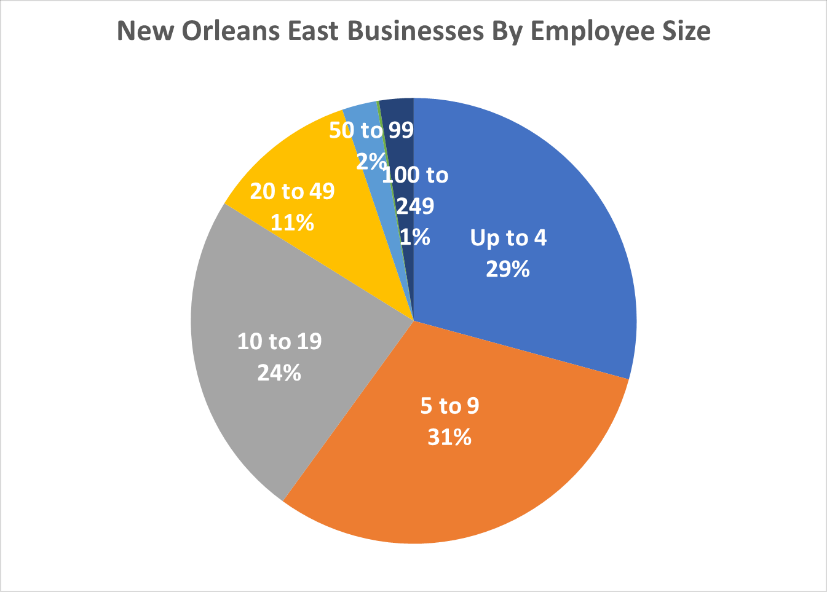
New Orleans East is close to three Universities and Lakefront Airport. This offers an opportunity to partner with universities on housing and student activities. Enrollment at University of New Orleans has fallen 30% in the last 8 years, and Southern University enrollment has dropped 20% in the last 4 years.


The Louisiana Department of Transportation shows the I-10 traffic at the Crowder Boulevard interchange in New Orleans East averages 125,000 cars per day. This equals the traffic at the CBD Poydras Street interchange, and is 80% of the traffic at Causeway Boulevard and Clearview Parkway.
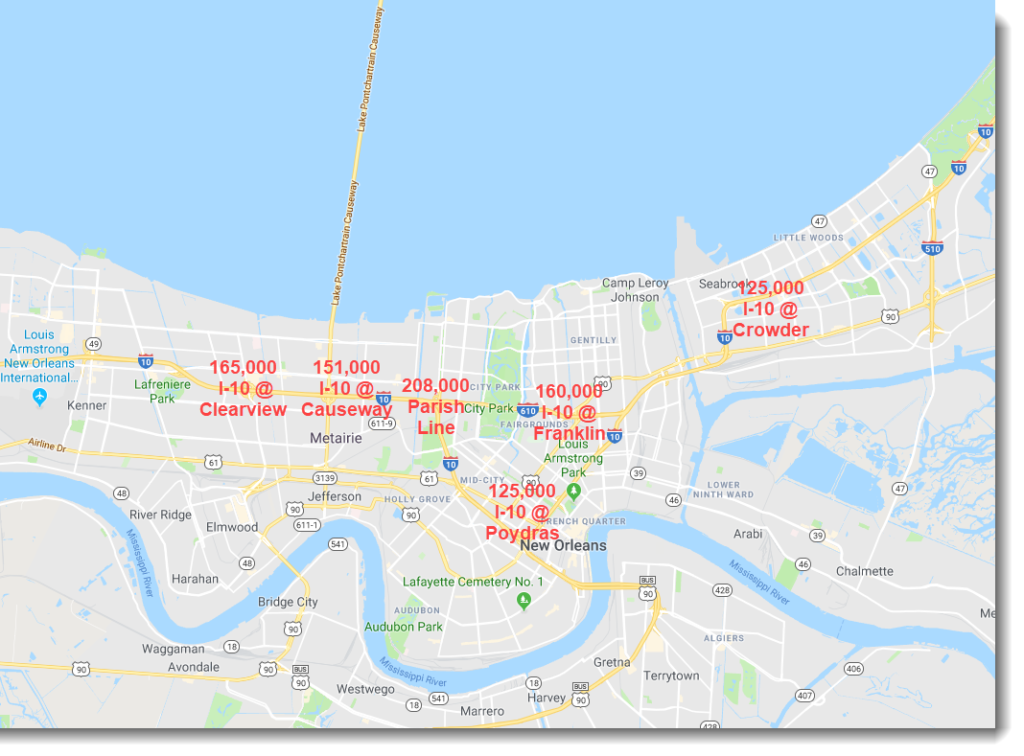
The Lifestyle Tapestry Analysis utilizes leading edge technology of data mining to look beyond typical demographics of age, income and education level and drill down to the socioeconomic quality of the neighborhood and what residents believe is important in their life. The Tapestry Analysis recognizes that our country is diversified and uses socioeconomic and geodemographic data to organize neighborhoods into 14 LifeMode Groups and then into 67 Market Segments, which help businesses determine optimum locations for success, more efficient advertising and fly-off-the-shelf inventory that appeals to what consumers in the neighborhood want.
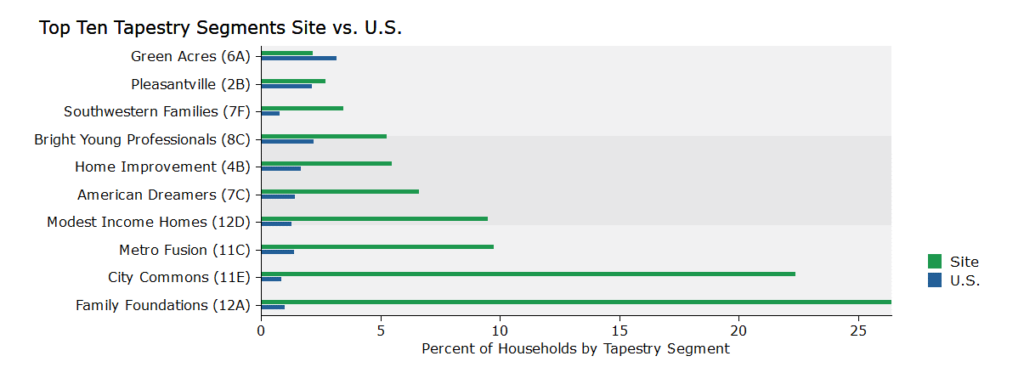
New Orleans East Tapestry is called Family Foundations, which encompasses 27% of the population compared to 1% normally in the U.S. Members belonging to this Tapestry Segment believe family and faith are most important, and have these traits:
Taking into account the needs of the 75,000 people living in New Orleans East and the 1,300 businesses in the area, there is sufficient demand for these businesses to enter the market and be successful:
Government can help, and often is required for an area to rebound. A perfect example is the rejuvenation of Tulane Avenue since Katrina, and the same improvement can occur in New Orleans East with a little help. Federal, state and city officials can offer infrastructure improvement, tax breaks and promotion through economic development teams. New Orleans East offers more opportunity for economic growth than both Orleans and Jefferson Parishes.
Here are a few actionable ideas that can bring about immediate improvement:
Specialty clinics and medical office buildings dot the landscape along Houma Boulevard near East Jefferson General Hospital in Metairie.
And along Interstate 10 around the Galleria office building, LCMC Health Ridgelake Health Center, Crescent City Surgical Care and Galleria Medical have opened within the last three years.
But while there has been construction related to multifamily housing, extended-stay hotels and retail near the $1 billion University Medical Center and $1.1 billion Veterans Affairs Hospital closer to downtown New Orleans, development of medical office buildings, which can include private practices or research labs, have been scarce.
Current numbers for the amount of square footage for these types of projects were not available. But a report in 2010 by engineering consulting firm AECOM anticipated 175,000 square feet of this secondary development within the five years of the institutions opening, 625,000 square feet in 10 years and 800,000 square feet of space in 20 years.
Commercial broker Robert Hand, president of Louisiana Commercial Realty, said there is no demand for this type of commercial space in that area. Hand said the lack of demand stems from the doctors at UMC and the VA being employees of the hospital rather than being affiliated with the institution and having their own practice and patient base. He noted the physicians at the VA Hospital are employees of the federal government and have no need for their own building and practice.
“I never got any interest from the medical community for my listings on (Tulane Avenue),” he said. “And this was before and after the Veterans Affairs Hospital was completed.”
Hand said the lack of financing in New Orleans also plays a role. In larger markets, speculators acquire the land, then develop a medical office building and wait for the physicians to come in and rent out space. That’s not the case in New Orleans, as banks in the area are very conservative and will not lend for that type of construction, Hand said. He believes this has to do with the Federal Reserve tightening restrictions after the 2008 recession as well as the 2017 collapse of New Orleans-based First NBC Bank, the largest bank failure in the last decade.
For more information, read the Louisiana Commercial Realty article "Why There Will Be No Medical Office Buildings On Tulane Avenue".

The best single tool that you can use over and over again in a variety of situations to help you make smarter real estate decisions is a mathematical formula called Present Value. You can use it whenever a deposit is made on property to determine the lost income, or when a buyer agrees to pay money sometime in the future to a seller, or in terminating a lease prematurely, or in determining how rent payments might apply toward a purchase price, or in deciding whether to lease or purchase, or in figuring how much to pay for property that produces income. It works not only in real estate but also in valuing investments, and anytime you need to put into current dollars a flow of money that lies in the future.
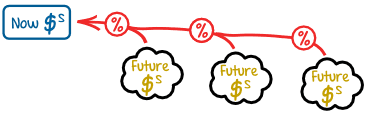
Present Value is used anytime you have money paid in the future in order to make the right decision. It helps you put different scenarios of cash flows on the same playing field so that you can compare the options. Even though there are templates and apps that can do the work for you, but it helps to understand the basics. The Apple Store has dozens of Present Value apps, and The Louisiana Chapter of the Certified Commercial Investment Member offers a free template that does the math for you, just click NPV Calculator. Even the US government will give you a template to use for GSA contracts. But the best way to understand how the math tool helps is to use a simple spreadsheet.
Let's set up an example and work it through. One real life example is how to get out of a lease. A lease commits the tenant to a long term payment, in return for the predictability of having space in which to operate. Just ask the Roly Poly sandwich shop owners on Tchoupitoulas and Jefferson why a lease commitment is important. You'll have trouble finding them though because they did not have a long term lease and when the property owner wanted to build a Regions Bank branch, Roly Poly had to move. They shut down Roly Poly entirely, lost their income and the building was demolished by the landlord. So leases are good things to have. The commitment when obtaining a lease is that you will lease the property for several years. More often than not, you will personally guarantee the lease and the property owner will come after any personal assets if you terminate the lease prematurely.
Let's examine a situation where you lease property but want to cancel the lease. Maybe you are moving to bigger space in Elmwood. Maybe you are moving to do more government contracts in Baton Rouge. Maybe you are closing down your business and retiring but don't want to subject yourself to a lawsuit from the property owner who now will not have income from the lease payments to pay the bank the mortgage on the property and faces the bank coming after his personal property because you no longer can pay the rent.
Present Value is the following formula:

Don't let the denominator throw you. The Present Value (PV) is the Future Value Payment (C) divided by the Assumed Growth (1+i) where i is the interest rate expressed as a decimal, times the number of periods money is paid (n).
Assume you have a 5 year lease with monthly payments of $10,000 and you want to get out of the lease starting January 1, 2015. You are obligated to make 12 monthly payments totaling $120,000 per year for 5 years or a grand total of $600,000. But you don't offer to pay the landlord the entire $600,000 now to terminate the lease because he would normally have received that in future monthly payments, and a lump sum now can be invested over the next 5 years to grow to more than $600,000. So how much is $600,000 over the next 5 years worth in current dollars as a lump sum? So our spreadsheet starts like this:
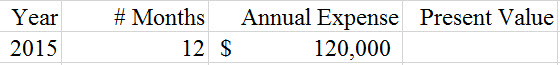
In the Present Value cell, enter the formula: =120,000 ÷ (1+.05) where .05 is 5% which is an assumption of the interest rate or growth rate of that money. Our (n) value equals 1. If you were earning your MBA, the professor would instruct you to use the Treasury Bill rate for n, but we are not in MBA class so in this case it is 5% which is an assumption factoring in risk to come up with an interest rate that the landlord would need to earn on your lump sum to replace the lost income you are no longer paying. So now our formula looks like this:

The result shows the Present Value which is the amount of money it would take today if invested at 5% to grow to $120,000 in 12 months. Double check by multiplying the growth ($114,286 times 5%, or $5,714) and adding it back to the principal ($114,286).
To get more accurate you can compound the cash flows monthly, and assume you get all the income at the midpoint of the year, but in that case you would want to use the app or CCIM NOV Calculator. Now we have to carry this out for 5 years to determine the total amount, so our spreadsheet looks like this:

The only change is that in each subsequent year the present value formula adds another (1+.05) to the denominator.
All you do is add up each year's Present Value for a total of $519,537. This is the amount in current dollars invested at 5% that grows to $600,000; therefore, this is the maximum amount a tenant would offer a landlord today to cancel a 5 year lease with payments of $10,000 per month.

Since New Orleans is almost 300 years old, you'd expect some interesting stories behind its more prominent buildings, and the vacant Market Street power plant near the New Orleans Convention Center does not disappoint.
Built in 1927, the 5 story coal-fired power plant probably contains asbestos and who knows what else detrimental to life, but it sits on 7 acres just a Mardi Gras bead's throw from the driving force of the New Orleans' economy: the nation's 6th largest Convention Center which drew 23% of the 8.75 million visitors in 2011. The power plant measures over 500,000 square feet, making it the largest non-office structure in New Orleans commercial real estate.
The building was purchased by Baltimore developer Edward Giannasca for an outrageous price of $10 million, just after Hurricane Katrina, at a time when apartment developers valued the site at most $4-$5 million. It was an offer the owner, Entergy, just could not refuse.
The money to purchase the building came from insurance proceeds on another building, Plaza Tower, owned by a partnership of Giannasca and retired Baltimore Ravens defensive end Michael McCrary (3rd on the Ravens all-time sack list) who claimed fraud since he was not informed of the diverted use of the insurance proceeds. McCrary sued Giannnasca and was awarded $33 million by a Baltimore court which was overturned on appeal. Subsequently, McCrary became dependent on drugs, his wife filed for divorce and a protective order.
Plaza Tower was eventually purchased by a hedge fund managing money for wealthy clients including Michael Jackson, who sold their $10 million investment at auction for $650,000 in 2011. The Market Street power plant sits vacant today, as it has been since 1984, but there are expectations that it will become a retail center with Bass Pro as the major tenant. Even though the property sits in a small industrial area, there are signs of commercial development: a new Wal-Mart down the street and, across Tchoupitoulas Street, the 700 unit Saulet Apartments is in full operation, having sold in September 2008 for $97,000,000. The first step in bringing the power plant back into commerce is to resolve its financial problems, since the owners filed bankruptcy in December 2009 but are expected to emerge in 2012. The property has a claim by MCC Group, a large contractor, and Market Street Ventures which holds the first mortgage, as well as Market Street Trust which has a claim for $6.5 of the $19 million in debt being restructured.
Sources: www.emporium.com www.larryschedler.com www.baltimoreravens.com Times-Picayune, December 2, 2011

Over the last 12 months ending December 2018, inflation, that secretive economic thief that steals your purchasing power, increased 2.2%, continuing to drive the wage price spiral like grandma through a slow school zone, keeping pay raises low and interest rates at the lowest levels in decades. The fat cat donor to this economic bipartisan party has been a decline in energy prices, offsetting the rise in food items, housing and medical care.
Low inflation benefits those who buy assets and borrow money but hurts savers, retirees and those who already own their assets. Just because the Consumer Price Index says inflation is low, it doesn’t mean the cost of medicine and food are any less expensive for senior citizens. Let’s first examine the various ways of measuring inflation, its history and how it impacts our daily life.
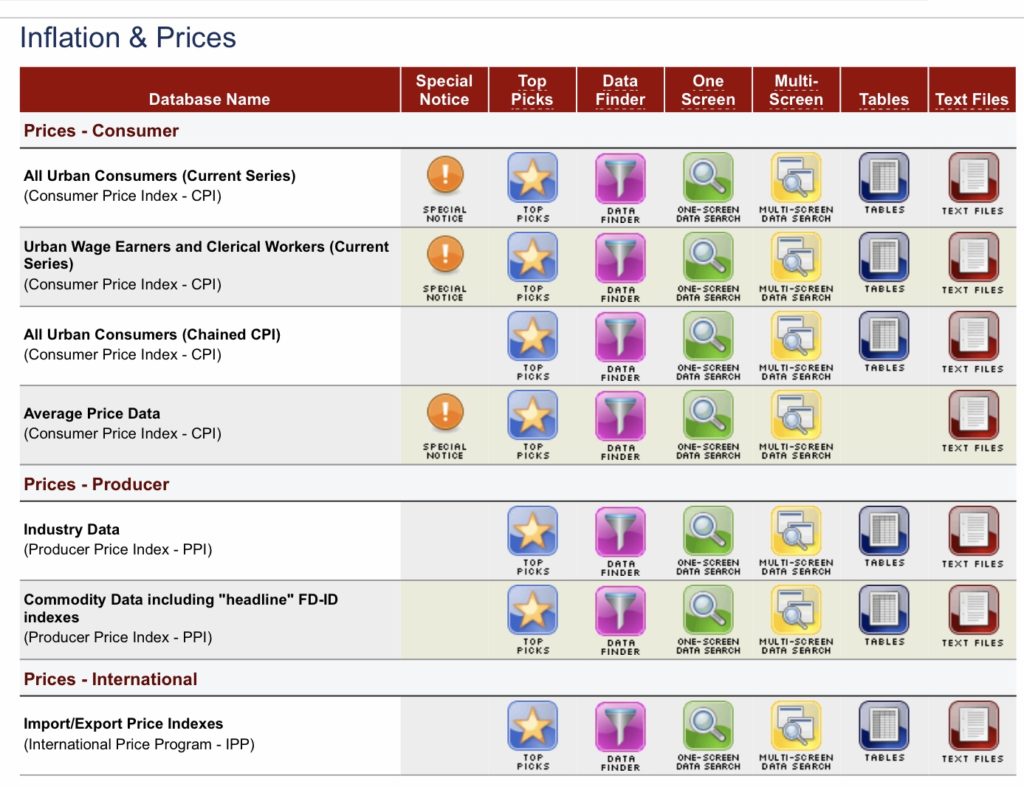
The most widely quoted inflation number is called the All Urban Consumers Current Series, but there are 4 other methods of determining inflation and two variations of each. For example, one method is the Urban Wage Earners, another is called the All Urban Consumers and there is also the Average Price Data. There are different base years where measuring started and each gives a different number. There is a method called chained that provides a different result, and some data is adjusted for seasons and other data is not. The first data out is not seasonally adjusted so it is the most commonly quoted. There’s more: in addition to measuring consumers, there are also measures of producers who sell to consumers.
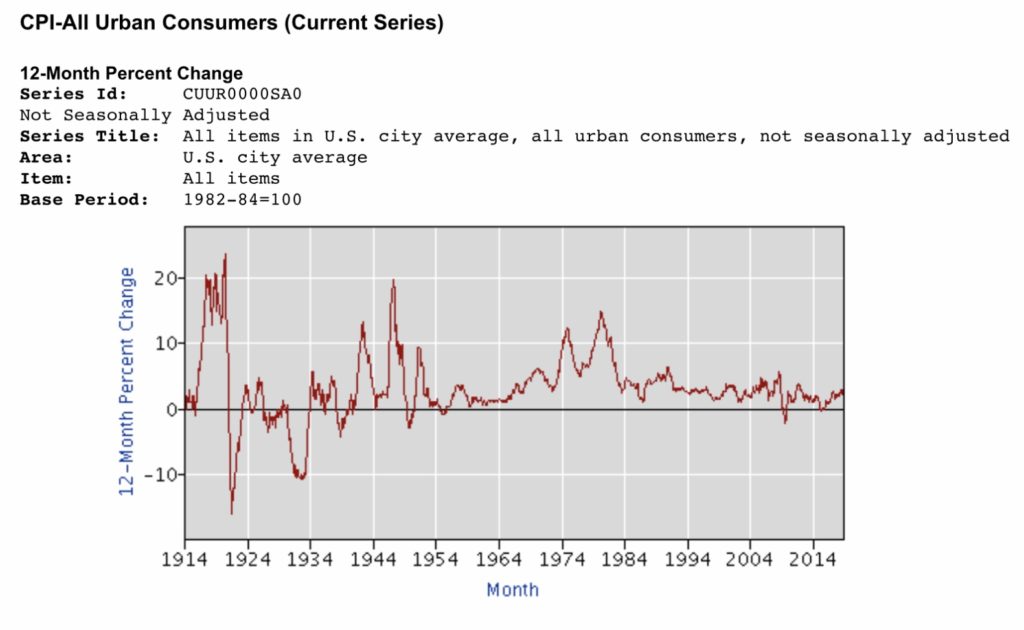
Let’s examine the history of inflation to see what the future holds. Inflation from 1914 to 1990 fluctuated widely, causing interest rates to track with high standard deviations and several recessions, depressions, booms and busts. All this changed when OPEC banded together and raised oil prices in the 1970’s causing the peaks in the above inflation chart skyrocketing over 10%, resulting in President Ronald Reagan threatening to fire the striking Air Traffic Controllers to break the wage/price spiral in the 1980’s. It worked. Unions never recovered their power to secure high wage increases and inflation and interest rates plummeted.

After periods of 10% inflation devastating the economy, the 1990’s welcomed inflation under 5% and, except for the mortgage crisis in 2008, the economy enjoyed steady growth and inflation never rose above 5%. The mortgage crisis was a wringing out of the excesses of the 2000’s when President Bill Clinton spurred home ownership and HUD, Fannie Mae and Freddie Mac loaned money freely to purchase homes, increasing home ownership to its highest levels and making Clinton very popular.
With the breaking of union power and the wage/price spiral, inflation has remained low, under 5%, for decades. This is a strong undercurrent that drives our economy, like a large oil tanker making its way down the Mississippi River-it takes a long time to change its path. This means the future will tend to be more of the same: slow GDP, low inflation, low interest rates but difficulty for businesses to grow by raising prices. The only way to get bigger is to vertically integrate or be creative by developing new products that capture market share.
Over the last 12 months, only the large cities with population exceeding 1,000,000 experienced healthy employment gains, according to the latest numbers released by the Department of Bureau and Labor.
The largest over-the-year percentage increases in employment in these large metropolitan areas occurred in:

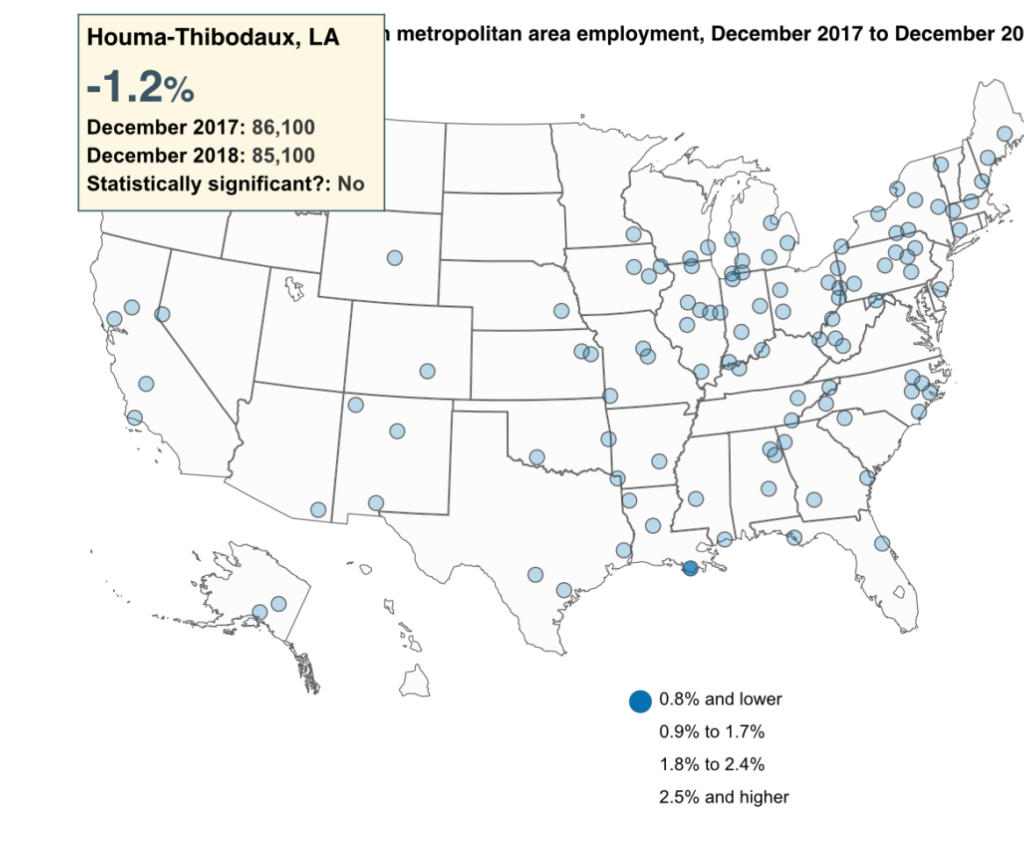
The map above shows the cities with employment growth at the bottom of the barrel.
In Louisiana that includes:
In Mississippi, the worst cities are:
Notice the map of worst cities is concentrated in the Northeast, mainly Pennsylvania, Ohio, Indiana, Michigan and Wisconsin. It is no coincidence that these states with declining opportunity have angry voters looking for someone just as angry to lead them out of a poor economy with promises of bring back the economy.
Nonfarm payroll employment increased over the year in 16% for the 388 metropolitan areas with 84% of the cities unchanged over the last year in growing their employment. The largest over-the-year percentage gains in employment occurred in:
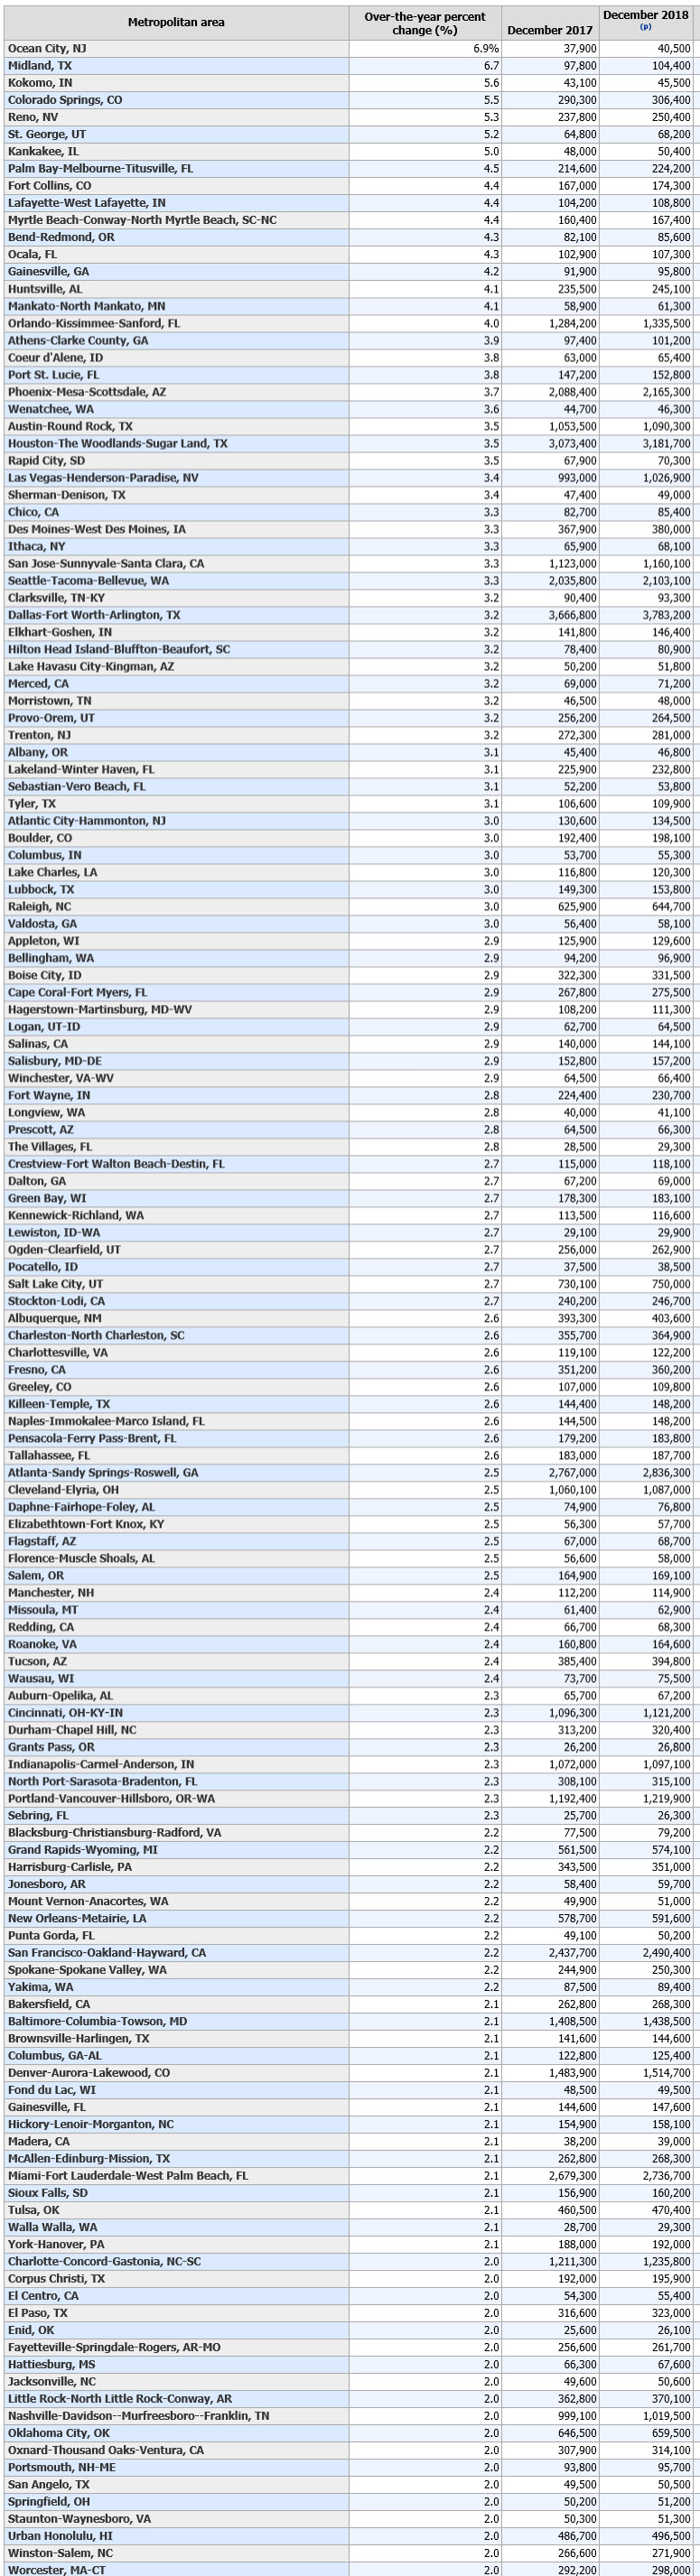
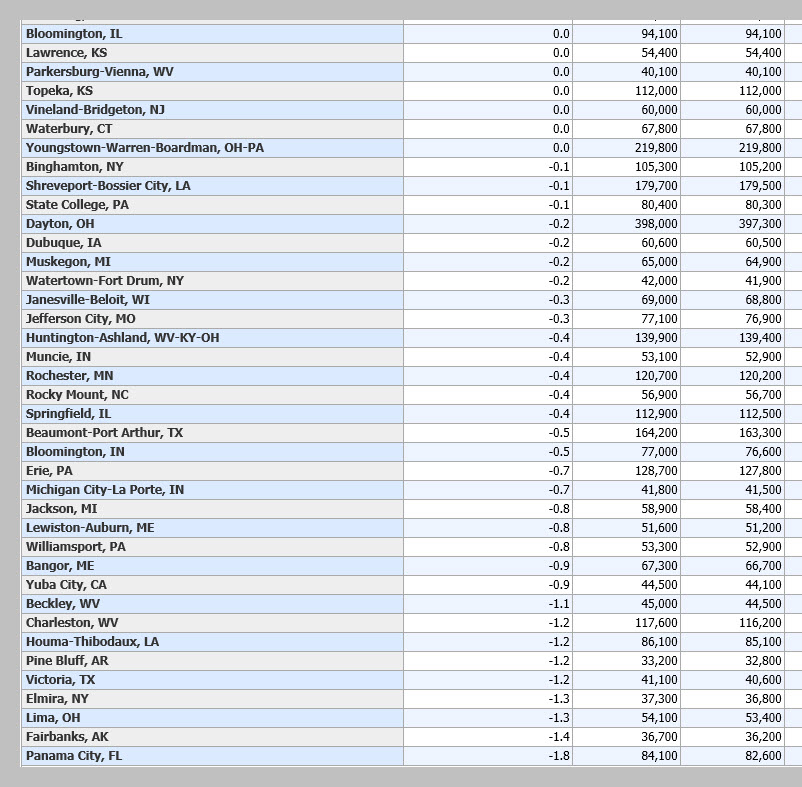
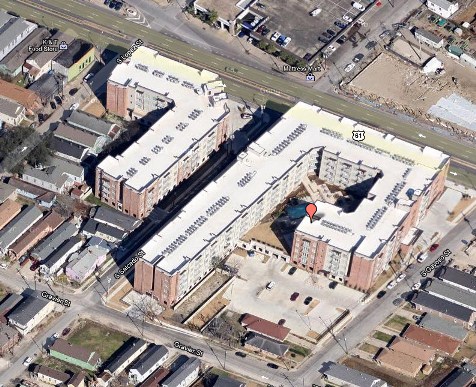