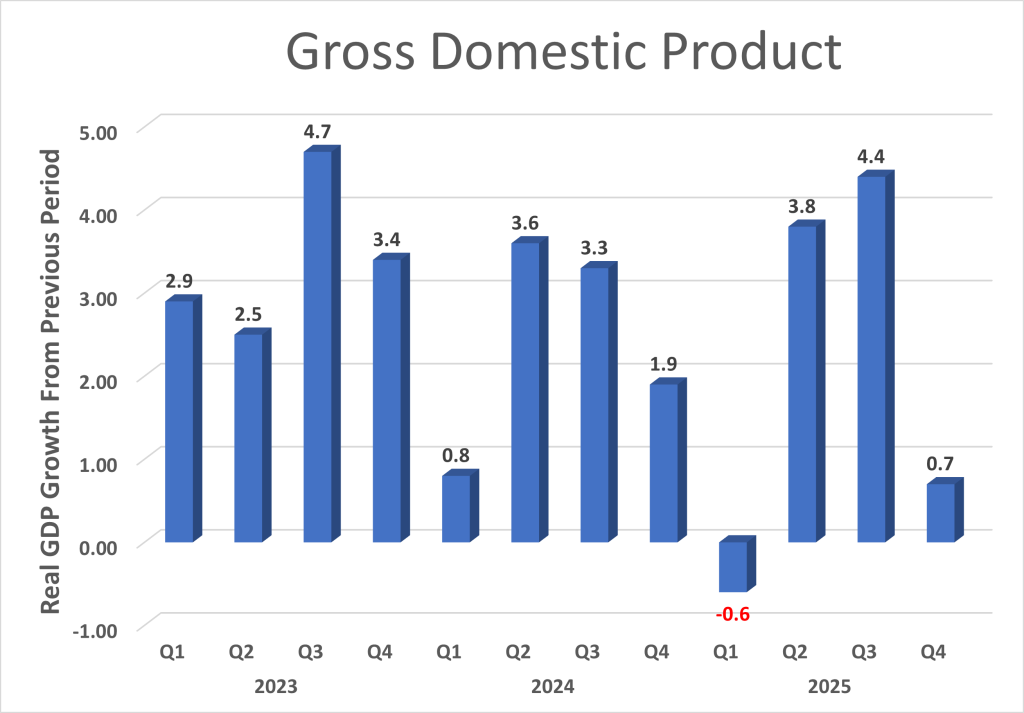
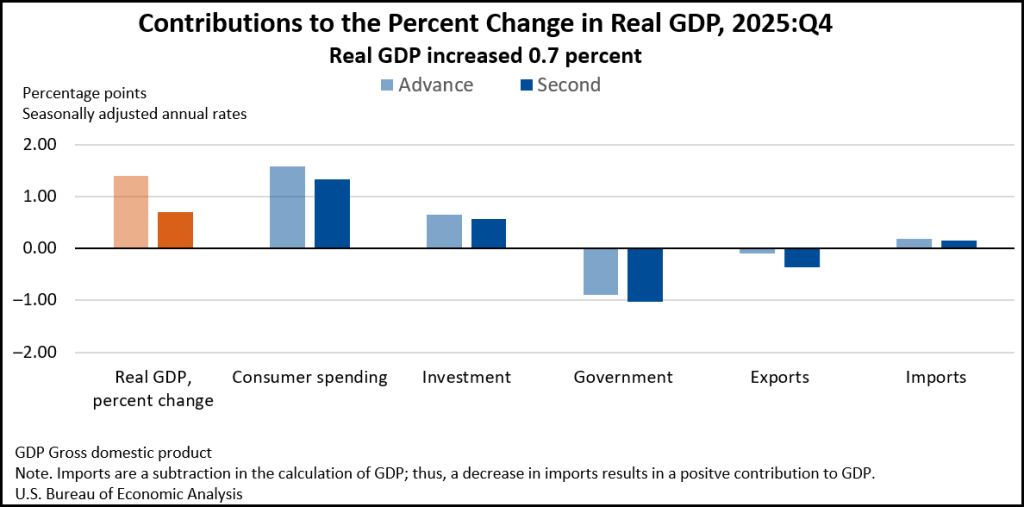
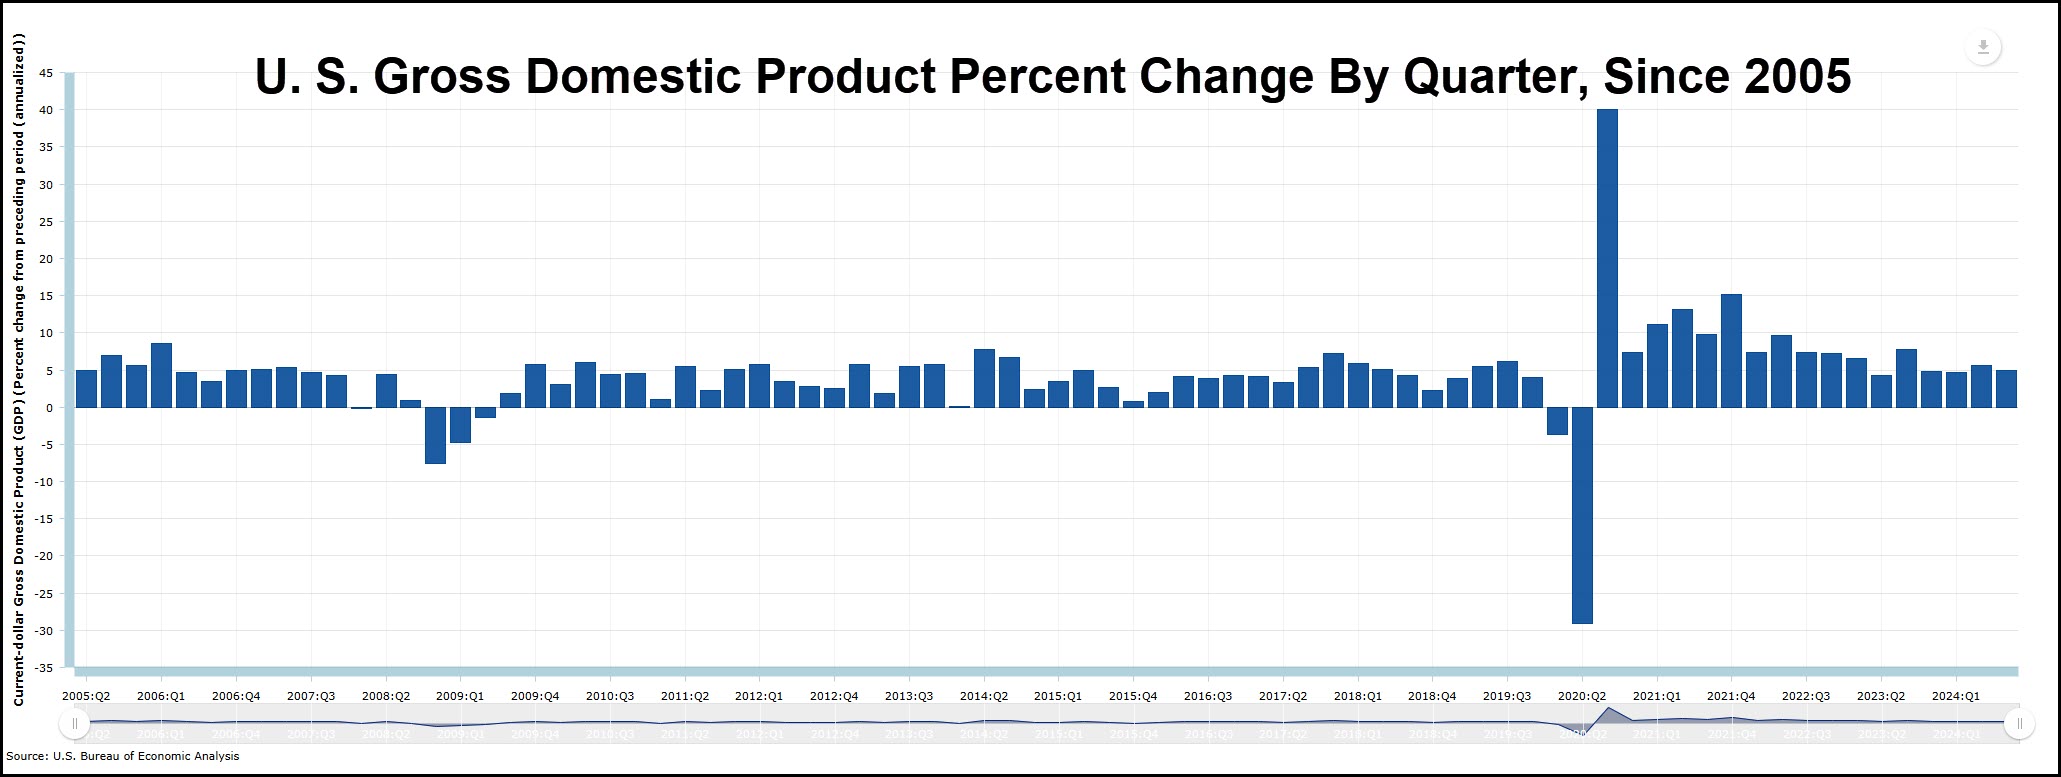
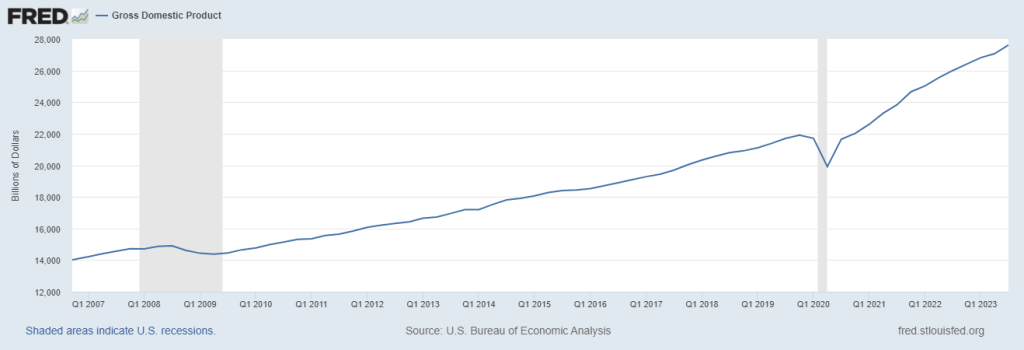
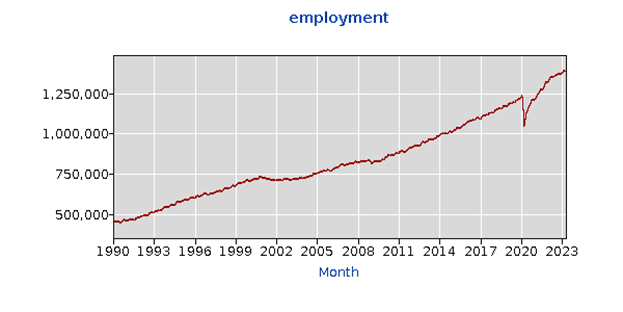
Just released: Growth of U.S. economy plummets. Yesterday’s release of .7% economic growth in the 4th quarter of 2025 was the 2nd worst quarterly growth in the last 3 years, as shown in the chart. This 4th quarter growth rate combined with the 1st quarter growth rate makes 2025 the only year in the last 13 years (except for Covid) that the U.S. experienced two quarters of economic growth this low.
This article examines how poor economic growth affects the commercial real estate industry and details not only how the retail, office, industrial and hotel industries are affected but what they need to do today to protect themselves in periods of poor economic growth. Then we drill down into how the economy’s growth rate is calculated and the surprising answer to who is responsible for the decline in 4th quarter growth. Let’s get started.
Retrenchment Is A Strategy
Business owners are always pushing for growth and spending every waking minute creating new ideas to provide a better product that increases sales. The thirst for growth is at the heart of our free market system, but this latest showing of a slower growing economy reminds us that business owners need to be smart about their long term plans. This latest growth rate number means retail, office, industrial and hotel businesses should plan for a decline so first let's cover strategies to survive in a slow economy.
Retail Retrenchment Strategy
Retailers need to reduce inventory and plan how to keep inventory low during the next 6 months. Reduce operating costs by reducing hours, staff, payroll and renegotiate vendor contracts. Rather than spend on marketing to get new customers, reinforce value to existing customers. Many retail consumers first shop online then visit a store, so update your online presence and match offerings with actual inventory. Be stingy about dropping prices and focus on technology to make the most of your customer data to create a better shopping experience.
Office Retrenchment Strategy
Businesses heavy with office space still have to pay the same office rent whether employees work part time from home or full time at the office. While office rent leases can be long term, 5 to 10 years, everything is negotiable. Office tenants can renegotiate a lease for a smaller square foot space while giving the landlord a longer term. Landlords love long term leases. Underutilized office space can be subleased to provide income. If your business has multiple locations, offices can be combined and the lease with the nearest expiration period can be terminated.
Industrial Retrenchment
The warehouse sector is the hardest hit during a slowdown. With imports and exports declining, the demand for warehouse space plummets. Warehouse tenants can use a slowdown to prospect for new suppliers and use technology to track inventory and provide just in time delivery to provide a higher level of service. Warehouse tenants can review their floor plan for ways to reduce costs and increase profit margin. While warehouse tenants are pinched, landlords have big problems such as tenant defaults and deferred maintenance.
Hotel Retrenchment
Hotel owners have more tools than most that allow them to stay alive in a slowdown so they can prosper in better times. Of course hotel owners can cut back on staff, but even better, they can cross-train employees to work more efficiently. Instead of cutting rates, hotel owners can bundle services such as internet, dining, spa and parking. One industry standard is to charge a hefty amenity fee. Attracting loyal guests to book directly and utilizing email marketing tied to a creative website can drive sales.
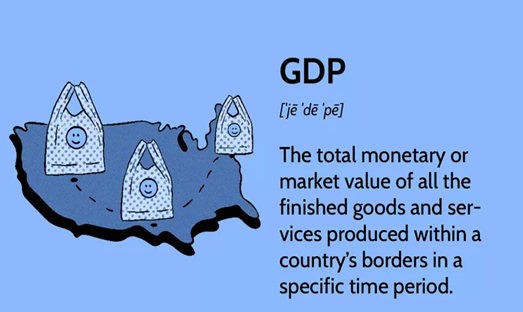
What Is GDP?
GDP is the Gross Domestic Product, which is the value of all goods and services produced only in the United States. GDP data is collected and produced by the U.S. Bureau of Economic Analysis which is under the Department of Commerce that was established in 1913.
What Caused GDP To Decline: Government Spending Freefall
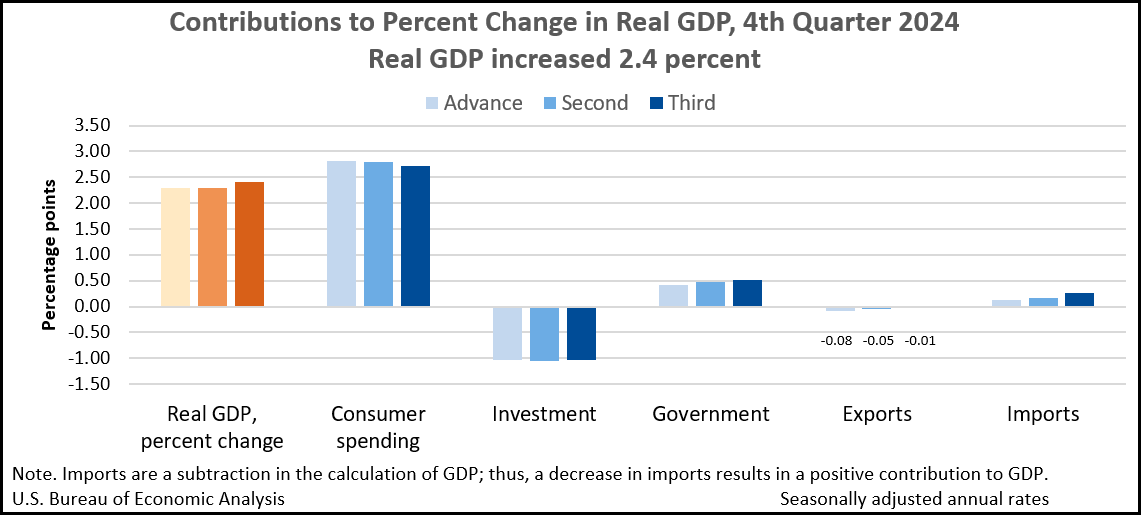
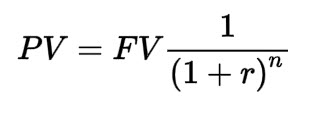
GDP is a formula that is calculated by combining 5 sectors, including: spending by U.S. residents, business spending on equipment and inventory, government spending (federal, state and local) plus exports. Imports are subtracted from GDP. Here is the formula:
GDP 5 Sectors Move Independently
Not all of the 5 sectors of GDP rise or fall at the same time. In the 4th quarter of 2025, consumer spending increased 2% and investment increased 3.3%, but exports declined 3.3% and imports declined 2.5%.
The biggest drag on the economy was government spending which declined 5.8%, as shown in the chart. But the government sector includes federal, state and local spending and the entire decline in the government sector was due to a 16.7% decline in federal spending which offset the 1.2% increase in state and local government spending. If only the future provided a good war to bring back federal defense spending to boost the economy.
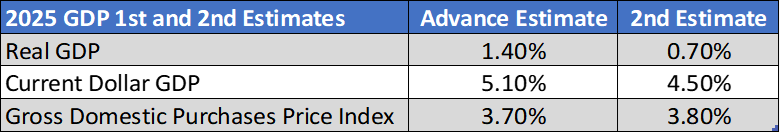
GDP Is Measured Three Times
The GDP percent number you read about in the news this week is the rate of change from the previous quarter and is measured 3 times, as shown in the table. Make sure you know which estimate is the latest:
the advance estimate, coming about a month after the quarter's end, is an early look based on the best information available at that time,
the second estimate and
third estimate each incorporate additional data that weren't available the month before, improving accuracy.
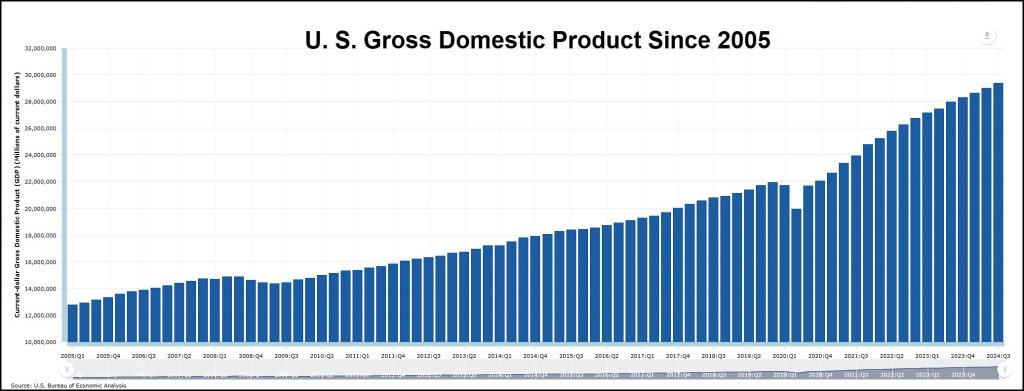
Also, GDP can be reported two ways: one called Real GDP which is after inflation is factored out and, two, Current Dollar GDP which is the actual dollar amount.
Summary
The one concept I remember from MBA school was that retrenchment is not an acceptance of failure, but is a viable strategy in a slow growth economy. This latest growth rate number means retail, office, industrial and hotel businesses should plan for a decline and utilize these strategies to protect themselves in a slow economy so they can thrive when the economy grows again.
For more information on Commercial Real Estate, select from over 150 articles in the Louisiana Commercial Real Estate Blog. Louisiana Commercial Realty is managed by commercial broker Robert Hand in New Orleans, who has successfully represented tenants and landlords in hotel, retail, warehouse and office transactions. Robert is the only broker in the state to create and teach a workshop showing residential agents how to be successful in the commercial sector which was approved for continuing education credits by both the Louisiana and Mississippi Real Estate Commission. Robert also has authored more commercial real estate articles in national publications that any broker in the state. During the Covid years, Robert worked for the Small Business Administration teaching new businesses how to get started and grow successfully.
It was standing-room-only for another continuing education course on “How To Do More Commercial Business”, taught last week by Louisiana Commercial Realty broker Robert Hand to group of investors and residential agents at Realty One Immobilia in Metairie.
The class detailed vital information that real estate agents and investors need to know about commercial real estate, and was designed to help agents who work mostly in residential but dabble in commercial real estate to better serve the needs of their commercial property clients.
Commercial Class Presents Pricing, Zoning & Artificial Intelligence
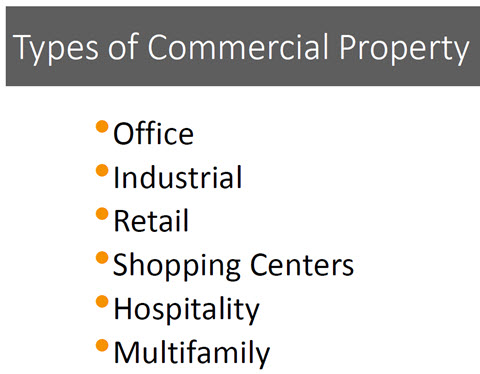
The class drilled down into the nitty gritty of the six sectors of commercial property: office, warehouse, retail, shopping centers, hotels and apartments, and presented an analysis of pricing for each sector. Also covered was information on zoning, contract language to avoid, and how the latest artificial intelligence data can be utilized to help retailers find the perfect location. The class also taught agents how to value commercial property based on income, which is one method utilized in all commercial appraisals.
Nobody Teaches About Commercial Real Estate
The 2 hour class was presented by Louisiana Commercial Realty broker Robert Hand who explains, “When I started 20 years ago working as a commercial agent for Latter & Blum and then RE/MAX Commercial, I was surprised that neither firm trained agents in how to work in the commercial property sector, despite the fact that these were the two largest commercial real estate companies in the area. So I created a course teaching agents who mostly make a living in residential property but dabble in commercial property how to do business in the commercial arena. The course was approved last year by the Louisiana Real Estate Commission for 2 hours of continuing education credit for agents.”
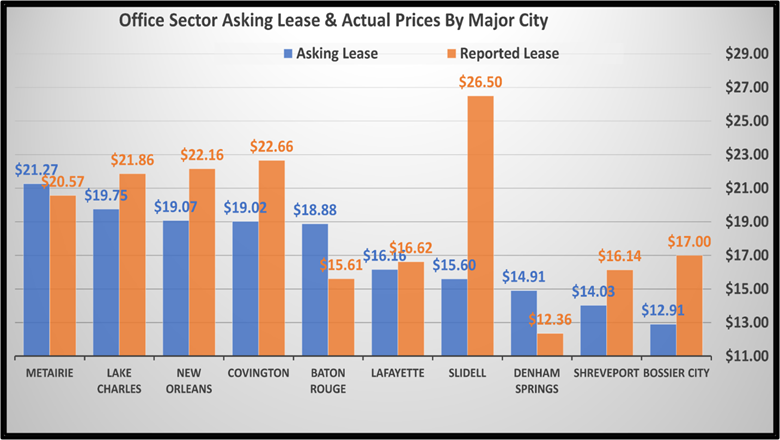
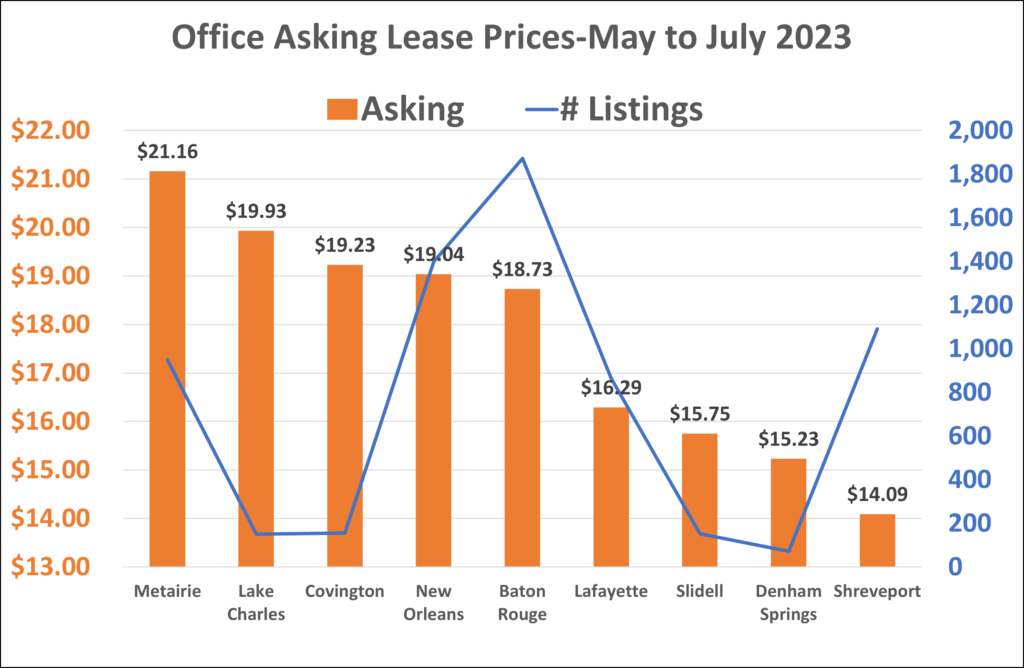
Office Sector Prices By Major City
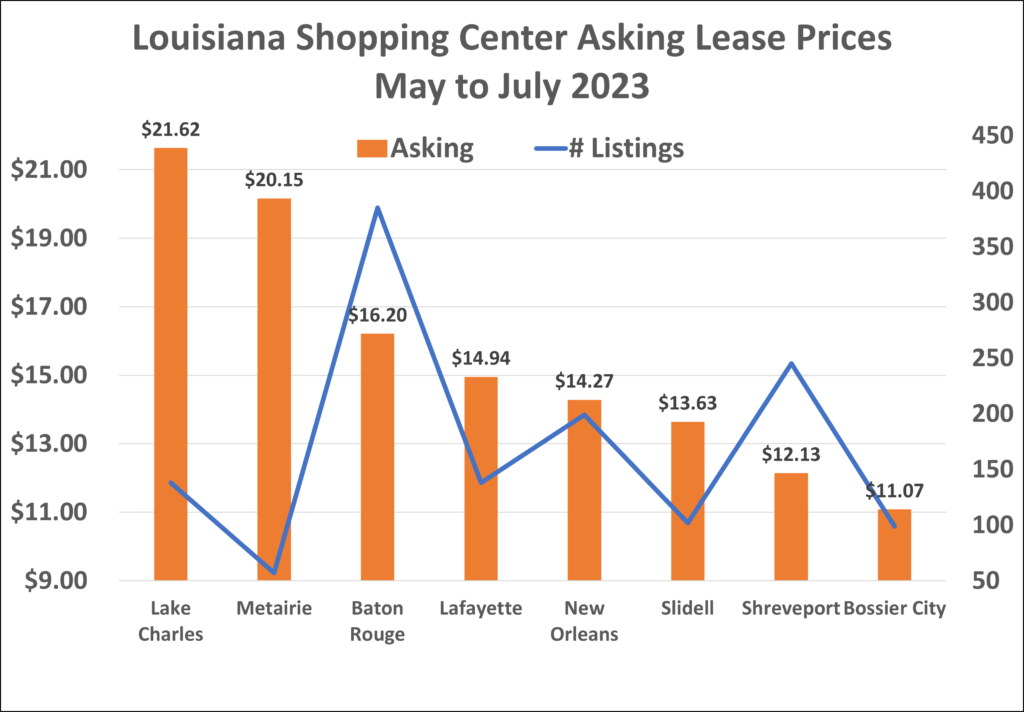
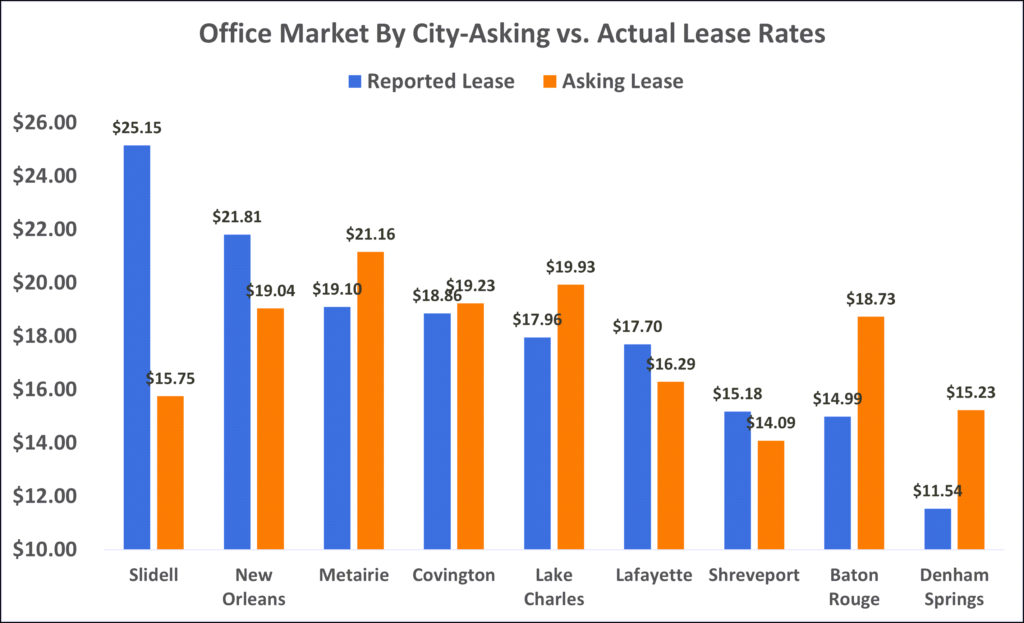
The in-person class includes research on over 7,000 office space listings throughout Louisiana and concluded only 194 were closed on average each month, which is only 3%. Metairie closed 21 of the 194 leases which were the highest office prices at $21.27 per square foot. Among the major cities in Louisiana, some reported leases at much higher prices than average, such as Slidell, but that was because only one lease was transacted. Baton Rouge closed the highest number of office leases.
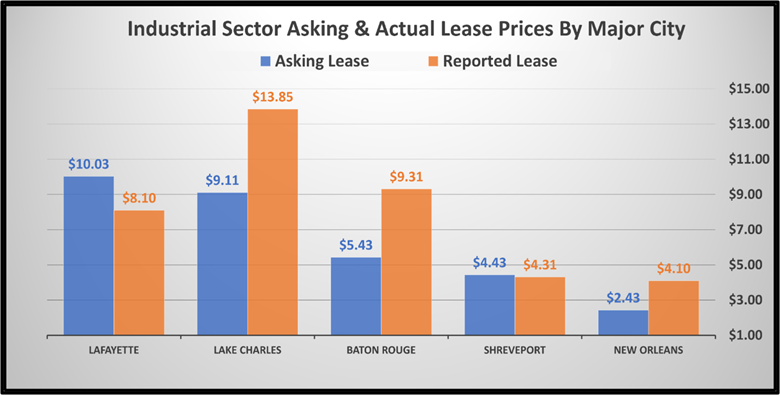
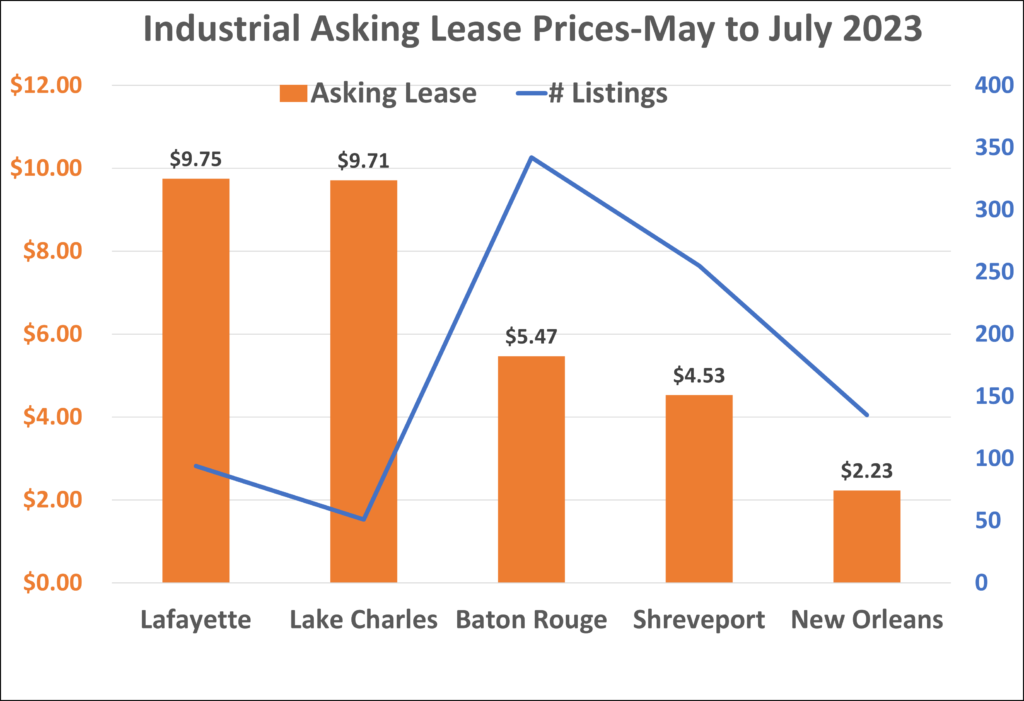
Industrial/Warehouse Prices By Major City
The class also presented information on lease prices of warehouse space in Louisiana’s major cities. Of the 101 warehouse leases listed, Lafayette closed 7 leases at an average price of $8.10 per square foot which was a 20% discount to the $10.03 per square foot list price. New Orleans and Lake Charles only closed 3 warehouse leases, but the lease price for each was above average.
Training In Commercial Real Estate Offered In Mississippi
The continuing education course was adapted to include commercial real estate in Mississippi, and recently was approved by the Mississippi Real Estate Commission for continuing education credit. Broker Hand says, “All the other continuing education courses offered are written either by title companies or vendors who never actually worked in commercial estate. The course I created is the only class in Louisiana or Mississippi that was written by a commercial agent who is actually in the field with 'hands on' experience in how commercial real estate gets done.”
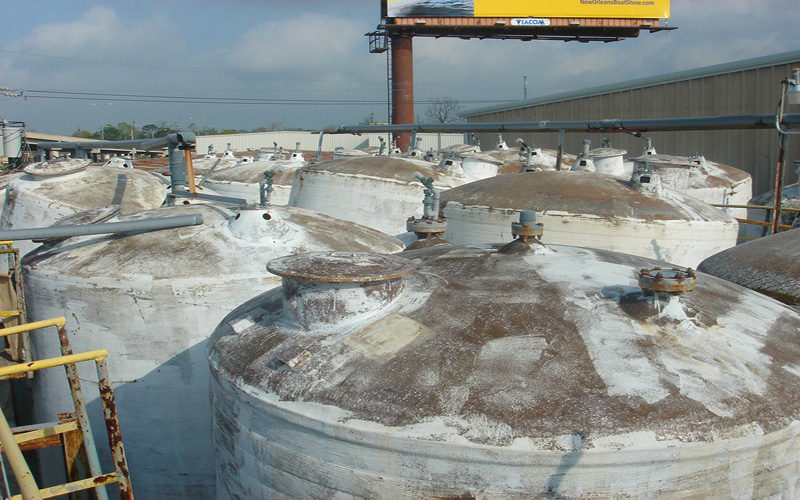
Louisiana Commercial Realty announces the sale of their 12,000 warehouse listing near downtown New Orleans for $777,000, after marketing the property for 2 years and bringing the seller 5 offers. The property offers a loading dock, rear rollup door, front rollup door and loading dock with crane, plus a billboard that is leased for $18,000 annually, and was home to Cajun Spirits Distillery, the only New Orleans distillery producing vodka.
Listing broker Robert Hand explains, “The warehouse has a terrific location near downtown New Orleans, and is one of only 4 warehouses in the area. Like many warehouses, the property was constructed almost 75 years ago but was appraised for $1,100,000. We heavily marketed the property, with advertising in the top commercial databases: LoopNet, LACDB and CREXI, along with targeting businesses directly that serviced the hotels and restaurants in downtown New Orleans and would need warehouse space. The feedback we received was that warehouses in Elmwood were not as attractive because the area had become congested and it was time-consuming to get trucks in and out quickly; therefore, we marketed the property to those prospects who were looking for a better location."
Hand says they received more interest in this property than any other listing and their marketing efforts secured 5 offers from $750,000 to over $1,000,000, with some cash offers and one with 15 days to close and another requiring no interest owner financing.
Hand explained, "Every transaction has problems so the most valuable service we offer clients is our expertise at negotiating to overcome obstacles. We have been trained in negotiating by the NASD. We negotiated one offer that included a $50,000 non-refundable deposit but the buyer showed up at closing saying he expected a wire any minute now with the money. It never came. The $50,000 deposit was kept by the seller but that was little consolation. The highest offer was $800,000 from a nearby business who needed that location and we negotiated the sale by excluding the billboard, which produced $18,000 annual income so we estimated that billboard value at $160,000. During inspections, some issues came up and we negotiated a reduction in price to $777,000 if the deposit would be immediately non-refundable. Another issue came up because the distillery still had large tanks in the property that needed to be removed by closing. We negotiated another agreement with which both buyer and seller were happy. Those results confirm that our sophisticated marketing strategy works and our expertise in negotiating for our client gets the job done."
While the property was on the market for 2 years but the average New Orleans industrial property takes 12 months to sell, Hand says the sale price was the highest price for a New Orleans warehouse sale so far in 2025 according to the Moody's LACDB database.
For more information on commercial real estate, read our recent articles:
This week Louisiana Commercial Realty broker Robert Hand, presented his 'Commercial Real Estate Strategies' workshop to a sold out audience of real estate agents. The workshop is a two hour deep dive into the major aspects of commercial real estate that buyers, sellers and real estate agents need to know.
The workshop was created by commercial broker Robert Hand, who explains:
"As a 20 year veteran in the commercial real estate industry and completing hundreds of transactions, I felt there was a real need for someone to teach others what they really need to know about commercial real estate, because it is so different from anything else. You not only need to know about demographic trends, zoning issues and construction, but, to be successful, you also need to know about pricing which does require a little math and you need a ton of negotiation skills. Nobody teaches this stuff. Until now.
My knowledge comes from working with the largest commercial real estate companies in the state, including Latter and Blum (now Compass), and also RE/MAX, but nobody there taught anyone about the skills or knowledge required to complete enough transactions so you could make a living. So I created a course which does just that. The Louisiana Real Estate Commission approved it for continuing education hours, and recently I taught the course to a sold-out audience of real estate agents, representing all the major companies, including Compass, Reve, Snap Realty, EXP Realty, HomeSmart and Berkshire Hathaway."
The workshop explains the major issues involved in commercial real estate, including:
How to stay out of trouble in contracts
Knowing your zoning requirements
How to price office, retail and warehouse properties using financial statements
How to use consumer spending patterns to pick the perfect retail location
How to negotiate using active listening to get what you want
Gross, Modified and NNN leases
Who pays tenant improvements
Common Area Maintenance
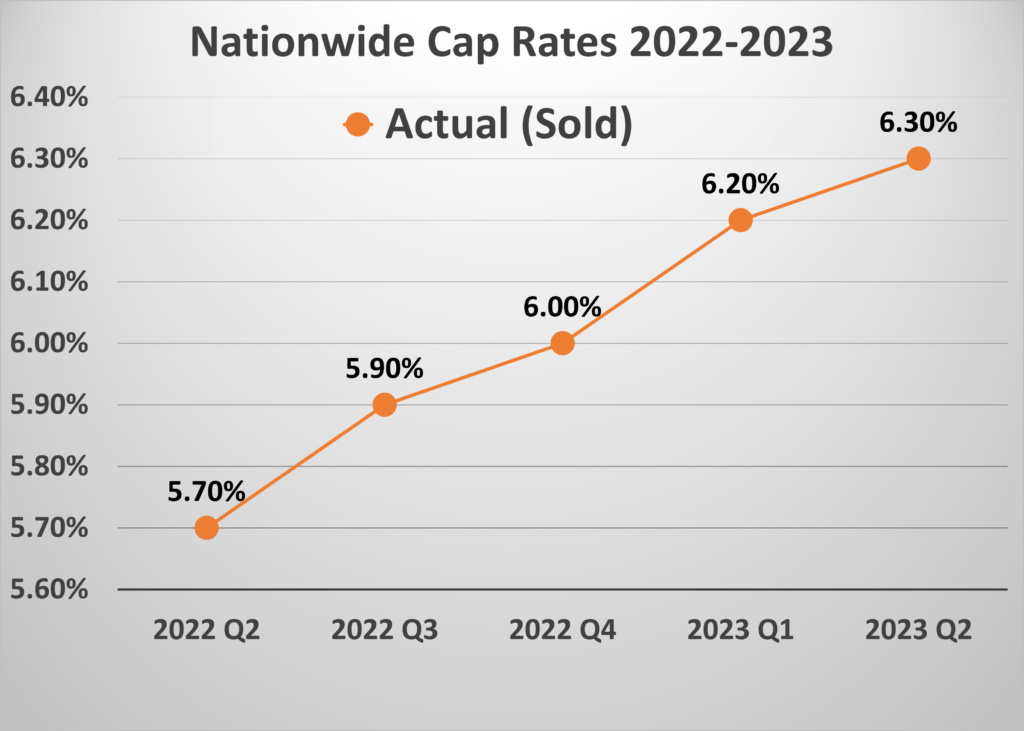
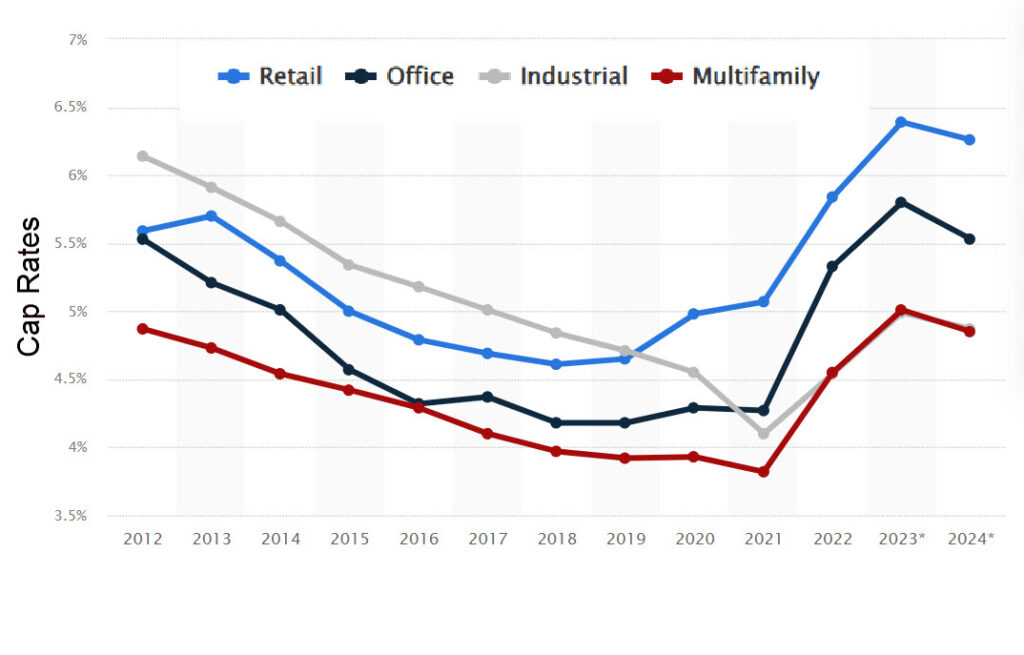
How to use Cap Rates to accurately value property
For more information on the next workshop, email Louisiana Commercial Realty at robert@louisianacommercialrealty.com, and get more details at: Commercial Real Estate Strategies
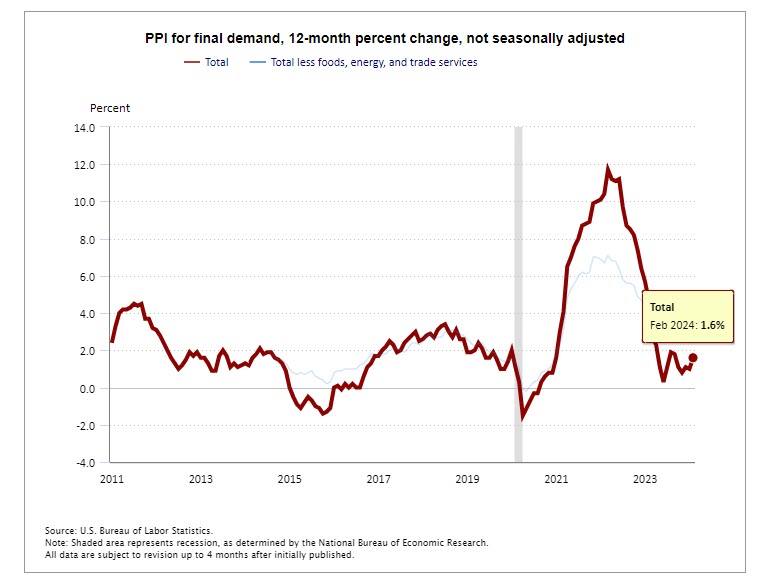
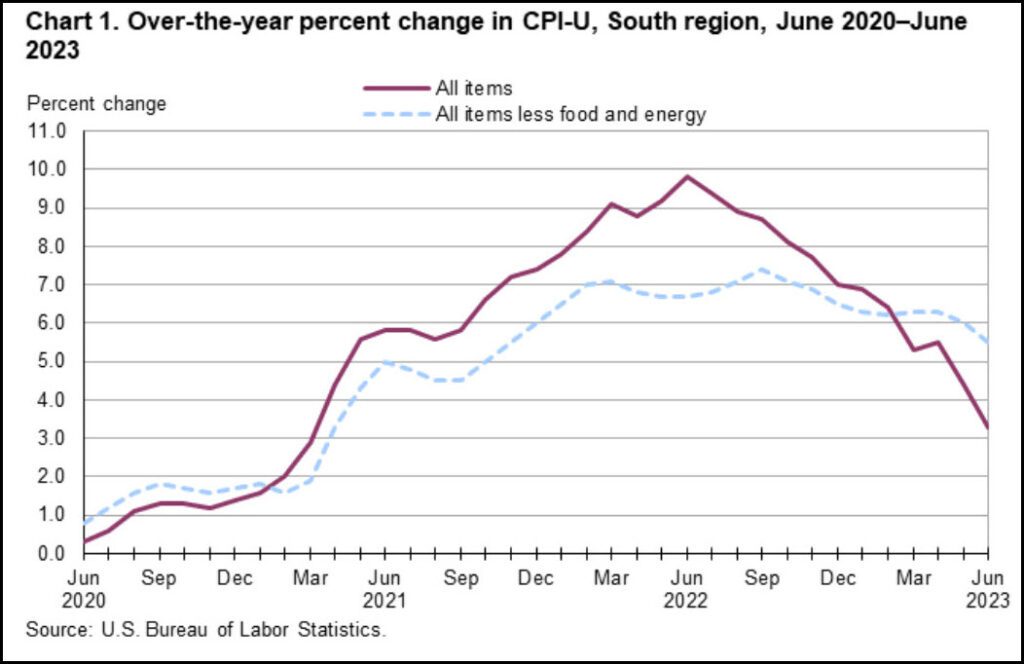
Inflation is dead, long live inflation. The latest release of inflation numbers shows that inflation for the year ending March 2025 for the basic items actually declined 0.1%, a sharp contrast to only 2 months ago when inflation was the top story and everyone was worried about skyrocketing egg prices. This article explores the changes in inflation, which are an important part of any commercial lease, and how that affects landlords and tenants who lease commercial space. Let's get started.
Where Is Inflation Today and What Is The Trend?
The start of 2025 saw inflation for January skyrocket up 0.5%, but then drop in February 0.2% and go negative in March with prices actually declining 0.1%. There is no defined trend yet, so let's examine what history tells us.
What Can We Expect Normal Inflation To Be?
Since 1914, when we first started keeping records, inflation has averaged 3.3%, and since 2010 averaged 2.6%, but since 2020 averaged 4.2%, due to one 8% year during COVID. The conclusion from the data is that inflation should be expected to be around 3% per year, and we should recognize that the last 5 years has not been normal.
Lease Language No Longer Protects Landlords
Inflation is measured by the Consumer Price Index and, if you are a landlord or a tenant, your lease defines how much more rent is paid every year based on that number. Just 3 years ago, inflation was 8% and landlords reaped the benefit of much higher rents in 2023. But 2022 was the year we experienced extraordinary economic imbalance due to Covid, suffering supply chain shortages exacerbated by consumers spending wildly, resulting in the classic free market supply/demand curve with prices increasing. But in 2025, things have changed.
Inflation and Your Lease
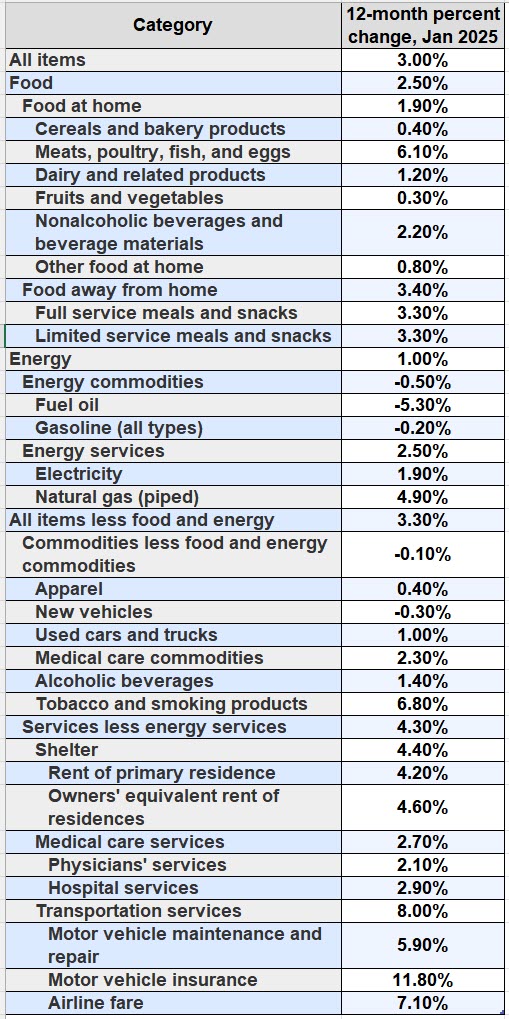
If you are a landlord or a tenant, your lease should include language that states rent will increase with inflation. If you have a really good lease, it will be clear about how inflation is calculated and what inflation index is used. The problem is that inflation is measured 8 different ways and includes prices of thousands of items. While the inflation number for the 12 months ending March 2025 was only 2.4%, many of the costs that landlords pay have increased much more than that, such as electricity, property taxes and hazard insurance.
For example, if you are a landlord in New Orleans, congratulations because the 14% increase in property taxes was the largest increase of any city in the United States, and that is on top of a 37% increase last year in New Orleans/Metairie insurance costs for office properties. The table below shows all the major components of the Consumer Price Index, Food, Energy, and the third category: All items, less Food and Energy, but the data show about many categories increased prices much more than the average. The result is that a lease doesn't always protect a landlord or tenant from rising costs just because rents are adjusted for the sum of all these categories.
How Landlords Protect Themselves From Inflation
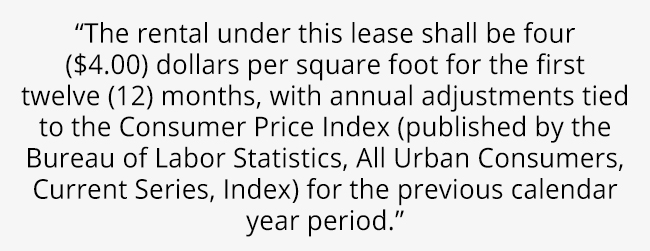
Most landlords require language in their leases which allow for rents to increase based on inflation, but also allow rent to increase at a minimum rate. A good lease will have specific language that explains how the inflation number is derived, such as:
" At the end of the initial term, there shall be an annual reevaluation and increase of the basic rent based on the Cost of Living Index as published by the U.S. Department of Labor, Consumer, Price Index for Urban Wage Earners and Clerical Workers, U.S. City Average. However, under no circumstance is the base monthly rent to increase not less than three percent annually."
Another way landlords protect themself is to reduce the base rent but pass along the property taxes and insurance to the tenant in a triple net lease. This means the tenant would need to agree to incur the risk of the higher than normal increases. Many times, however, this would make the property unattractive to a tenant and price the space out of the market.
How Tenants Protect Themselves From Inflation
Tenants protect themselves by negotiating language in their lease which puts a cap on operating expenses that can be passed along from the landlord. Sometime the language states that there is a cap on controllable expenses, such as landscaping, but the lease may state there is no cap on uncontrollable expenses, such as property taxes and insurance. So that doesn't really help a tenant.
In summary, all lease language can be negotiated and a tenant has the most power to force changes in the lease language during the dating period, not after the marriage. The bottom line for tenants is to make sure you have a trained negotiator on your team.
For more information on how inflation is measured, read our blogs:
African Americans in the New Orleans/Metairie area in 2023 were denied as much as 55% more home loans when compared to White applicants in the same income bracket, according to research by commercial broker Louisiana Commercial Realty. Data from the Consumer Financial Protection Bureau show that 22,701 loans for New Orleans home mortgages were made in 2023 totaling $3 billion, but African Americans were denied loans totaling $319 million, or approximately 32% of applications, compared to a denial rate of 18% for White applicants.
Reasons For Loan Denial
There are many reasons for loan denial. For home purchase applications, lenders cite low collateral as the most common denial reason. For refinance applications, lenders cite the debt-to-income ratio, insufficient cash, unverifiable information, and incomplete applications as the most common denial reasons.
However, these common reasons would not fully explain why the denial rate was higher across the board for any income bracket, even those with family income above the median average. Louisiana Commercial Realty researched the data as part of their efforts to revitalize New Orleans East, and commercial broker Robert Hand explains:
"My firm has focused on bringing business to New Orleans East for the last 15 years, so we were curious as to why people were constantly unable to obtain financing to start new businesses even though entrepreneurs had great ideas and the businesses were feasible. When we examined the mortgage numbers, we found that at every level of income, African Americans were denied a much higher percent of loans than Whites in New Orleans and Metairie, and also denied loans at a much higher rate than the national average. We started this analysis in 2018 and found the same discrimination then: rates of denial for African Americans were twice the denial rate for Whites, in all income brackets."
The analysis examined 5 income brackets relative to the median income in the New Orleans and Metairie area:
Income under 50% of the average.
Income 50% to 79% of the average.
Income 80% to 99% of the average.
Income 100% to 119% of the average.
Income over 120% of the average.
Results from 2023 show, even in the income bracket exceeding 100% of the New Orleans MSA average, that denial rates were 25% for African Americans, but only 15% for Whites. That excess denial totals totals $75 million and since the average loan application was $201,000, that would have denied an additional 375 home purchases.
Discrimination Is Nationwide
The data show that nationwide, loans for conventional mortgages were denied at twice the rate for African Americans as were for Whites. The analysis also revealed that the denial rate in New Orleans/Metairie for African Americans is almost twice the national rate.
Where Mortgage Information Comes From
The mortgage data is available from the Consumer Finance Protection Bureau, which was established in 2010 under the Dodd-Frank Act and is an independent bureau within the Federal Reserve System, with a $500 million budget financed by up to 12% of Federal Reserve revenues.
The Bureau collects the data with the power enabled by the Home Mortgage Disclosure Act, enacted by Congress in 1975 and implemented by Regulation C which requires financial institutions to maintain, report, and publicly disclose loan-level information about mortgages. These data help show whether lenders are serving the housing needs of their communities and designed to shed light on lending patterns that could be discriminatory.
For more information on the New Orleans commercial real estate market, read our other articles:
Today, real growth in the U.S. economy was announced to be 2.4%, after inflation. This was a drop from the previous quarter growth of 3.1%. The economy still has momentum, just not as much. If you own a business, this growth rate of 2.4% doesn't seem like much, so how can you grow your business more than the economy? Let's drill down into GDP and expose where faster growth comes from.
Gross Domestic Product Components
The Gross Domestic Product is calculated by the Bureau of Economic Analysis, and is the total dollar amount of goods and services produced, but the final GDP number is the sum of 5 components: consumer spending, investment, government and exports. Imports are subtracted from GDP because they are included in the consumer spending component.
What Businesses Are Boosting The Economy Now?
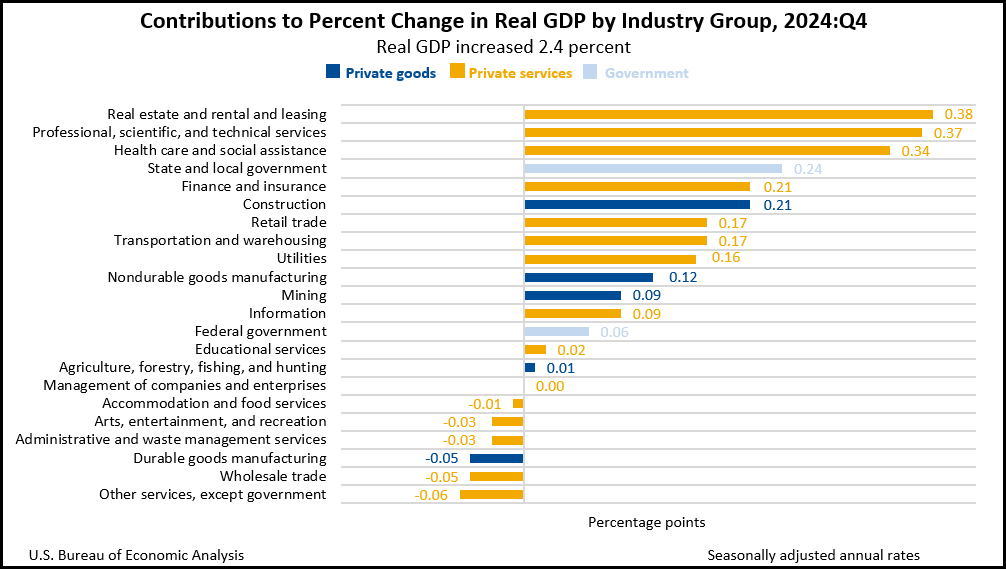
The economy is recovering from the 2020 Covid drop, as shown in the chart of GDP from 2005, but not all industries are contributing. If you own a business and are looking to grow your business more than the 2.4% economy, all you need to do is steer your business to benefit from industries that are leading in growth:
Real Estate Leasing
STEM
Health Care
and, as shown in the chart, stay away from businesses that are declining:
Wholesale
Durable Goods Manufacturing
Hotel & Restaurants
Recreation
Waste Management
Summary
In summary, the GDP is announced but revised 3 times. It is also calculated two ways, one, as real GDP, which subtracts the inflation rate, and, two, as nominal GDP which is the total number. GDP is calculated every quarter, but the number is an annual rate so be aware of what calculation method you are looking at.
The bottom line is that your business should at least be growing by the GDP number, but grow your business faster by finding a way to do business with those industries leading the charge.
Want more information on the economy, commercial real estate prices or interest rates? Read our articles:
Start-ups and businesses in their infancy always prefer leases for just a few years in case their business fails; however, established businesses always prefer longer lease terms which gives them control of their space, especially businesses that have spent money building out their space, such as breweries. Most leases have a section called "In Solido" which means the tenant is personally responsible for the entire lease payments even though the lease is in the name of an LLC. That means the term of your obligation is a financial burden.
Recently Louisiana Commercial Realty helped Urban South Brewery renew their $1,000,000 lease for another 5 years in one of the more complicated real estate negotiations in their 20 year history. Broker Robert Hand explains, “We have a long history with this warehouse, having been hired by the warehouse owner in 2015. The property is zoned MU-2, so we originally marketed the warehouse to those businesses requiring that zoning, which included breweries. Within 30 days, we secured a 10 year lease with Urban South Brewery for our landlord client”.
Complicated Lease Terms
But that is only half the story. The original lease was only for the 20,000 square foot front half of the building and when the rear half of the building became available the following year, Hand negotiated a 10 year lease for that space also. Therein lies the challenge. Each space, front and rear, had a separate lease that included an annual adjustment for the Consumer Price Index, causing the owner to calculate the inflation adjustment based on different periods, effective dates and square footages.
Like many properties in New Orleans that are inherited, owners self-manage their commercial property and forgo the expense of paying 3% to 6% of rent income to a property management company who does all the everyday little things that come up in renting commercial space. The result is that owners rarely have the expertise to negotiate commercial leases smoothly and without expensive conflict in later years.
Correcting The Attorney's Lease Language
Just before the initial lease term expired, the tenant expressed interest in exercising an option to renew the lease, and Hand had an idea, "Why not combine both spaces and have one lease start date and one annual inflation adjustment date? Easy, right? Except that one of the spaces had a renewal provision triggering an 8% rate increase upon renewal and the other did not.” Complicating the negotiations was that one of the parties wanted an attorney to draft a complicated agreement to renew the lease. “We spent lots of time explaining the lease language to both sides, to make sure each party understood the language and that the lease renewal language was what they intended”, Hand explained, “and we corrected much of the attorney’s wording so it made sense and was easier for landlord and tenant to understand-with the attorney’s final approval, of course.”
Successful Negotiation Skills
Commercial real estate involves knowledge of property values, zoning, population demographics and marketing but also negotiations. Hand says, “This is a clear example of why owners need help with commercial property. I have been trained in negotiation by the NASD, and have the CCIM and SIOR designations, an MBA, and spent years writing appraisals. We are well qualified to handle any aspect of commercial property. This is another example of where we helped the landlord simplify their property management and also helped the tenant get a lease renewal with favorable terms. This deal would never have been successful had we not been involved-there were simply too many moving parts. We just took one issue at a time and zeroed in on a solution. In life, there are those that make excuses and those that get things done. We get it done.”
For more insights into what your lease should include, read our blog:
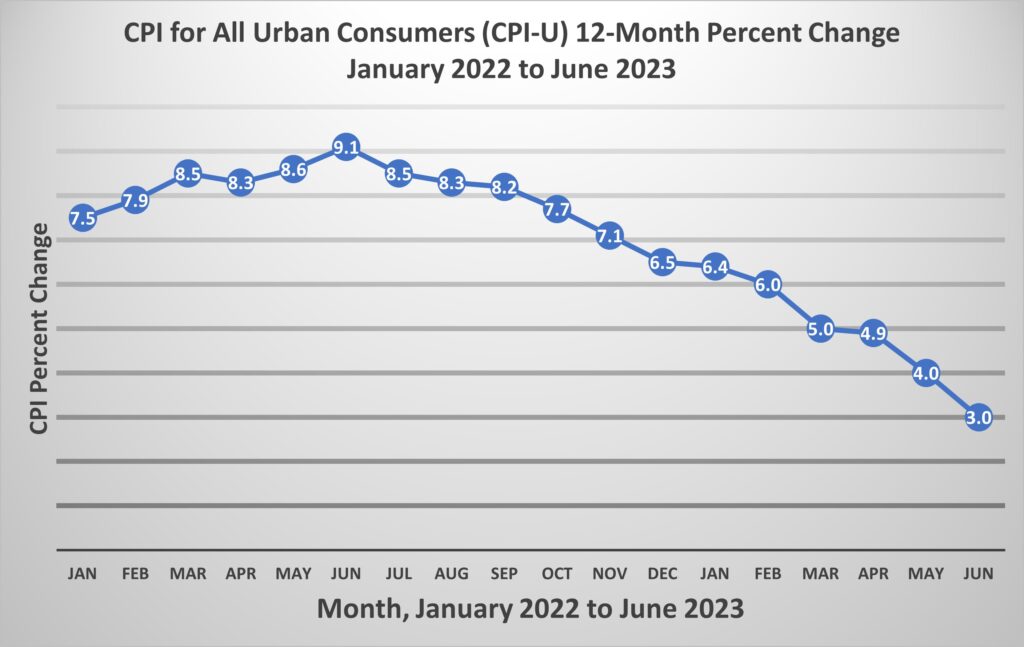
Last week, inflation was calculated at 3% for the last 12 months and while the high cost of eggs was the main concern, those expensive eggs are only the ones that roosters lay, right? This article lays out the facts about inflation and explains what you need to know. Let's get started.
Bird's Eye View Explanation
Inflation is called the Consumer Price Index and is measured by the Bureau of Labor who collects over 8,000 data points from 75 cities, including 6,000 homes and 22,000 retailers, for prices people pay for goods and services purchased for everyday living. Inflation is not just one number that applies to everything, some items increase in price while others decrease because each item has its own supply and demand curve.
There are two major populations measured for the Consumer Price Index:
the All Urban Consumer Group which represent 90% of the total population.
the Urban Wage Earners which includes clerical workers but only covers 30% of the population.
Not included in the CPI are people in rural areas, farms, military, prisons and mental hospitals.
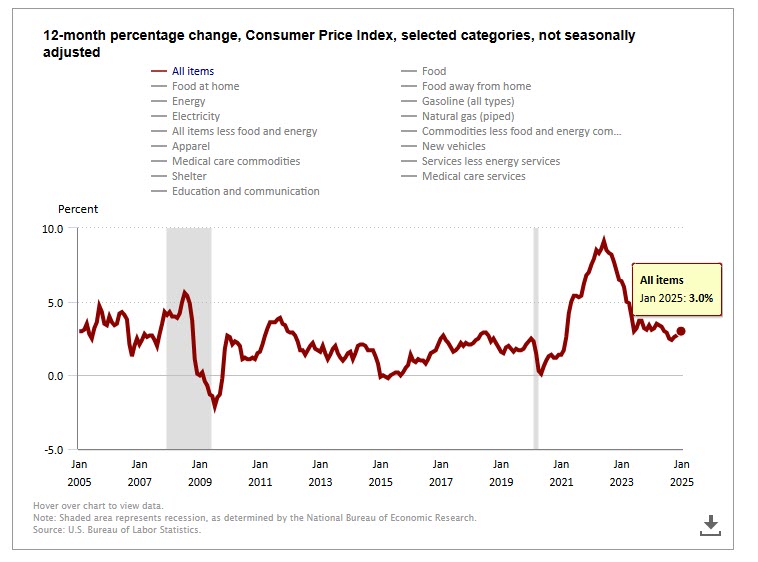
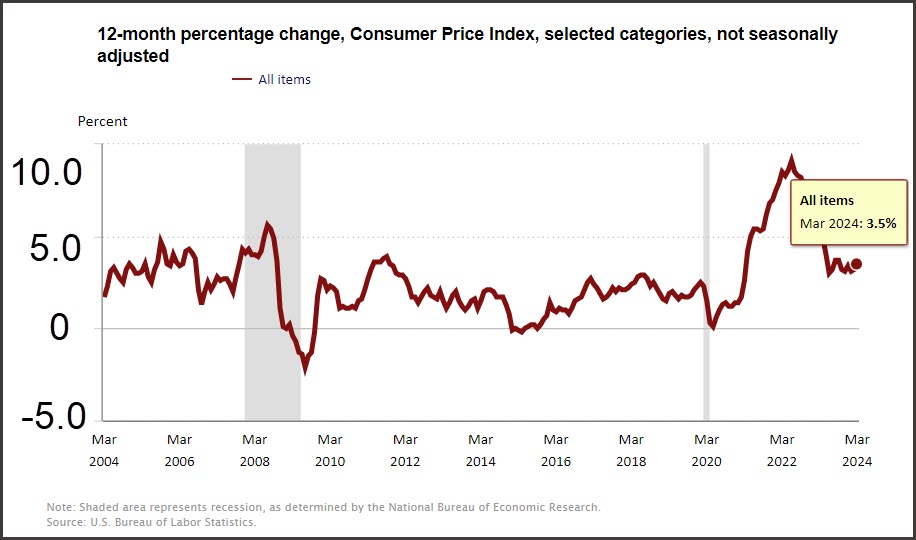
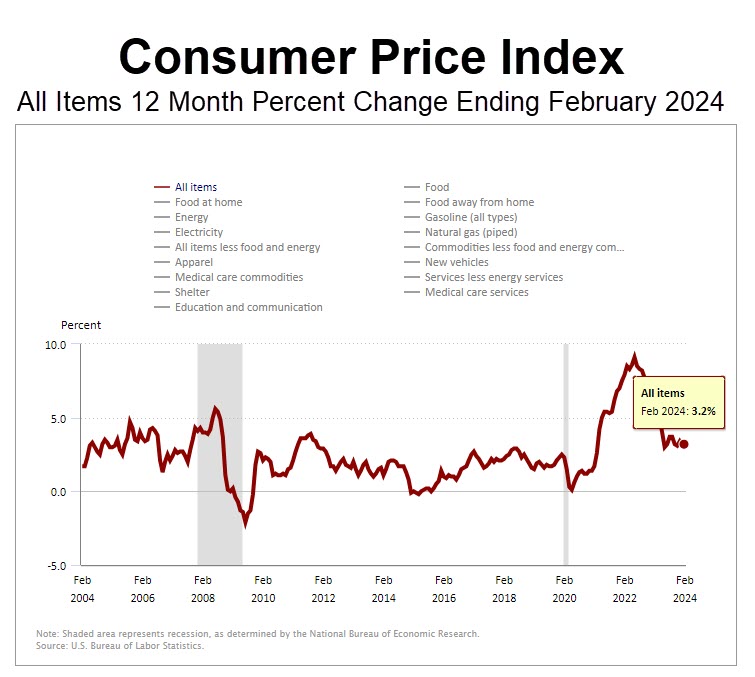
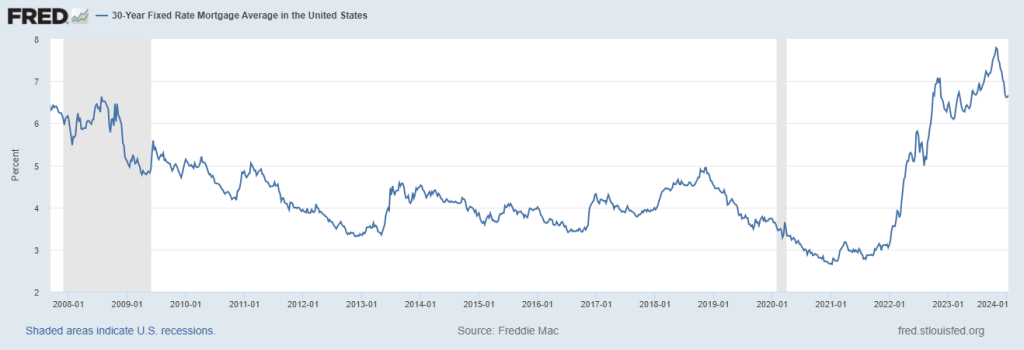
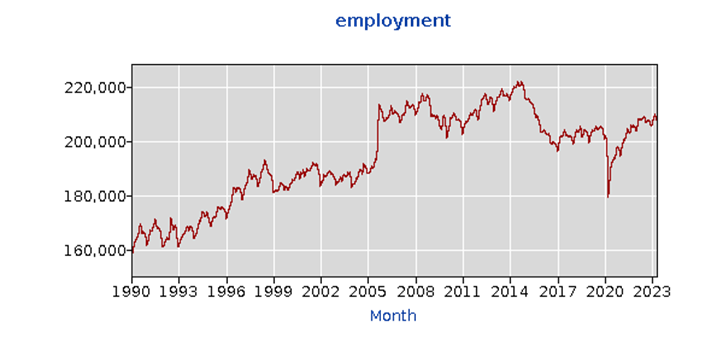
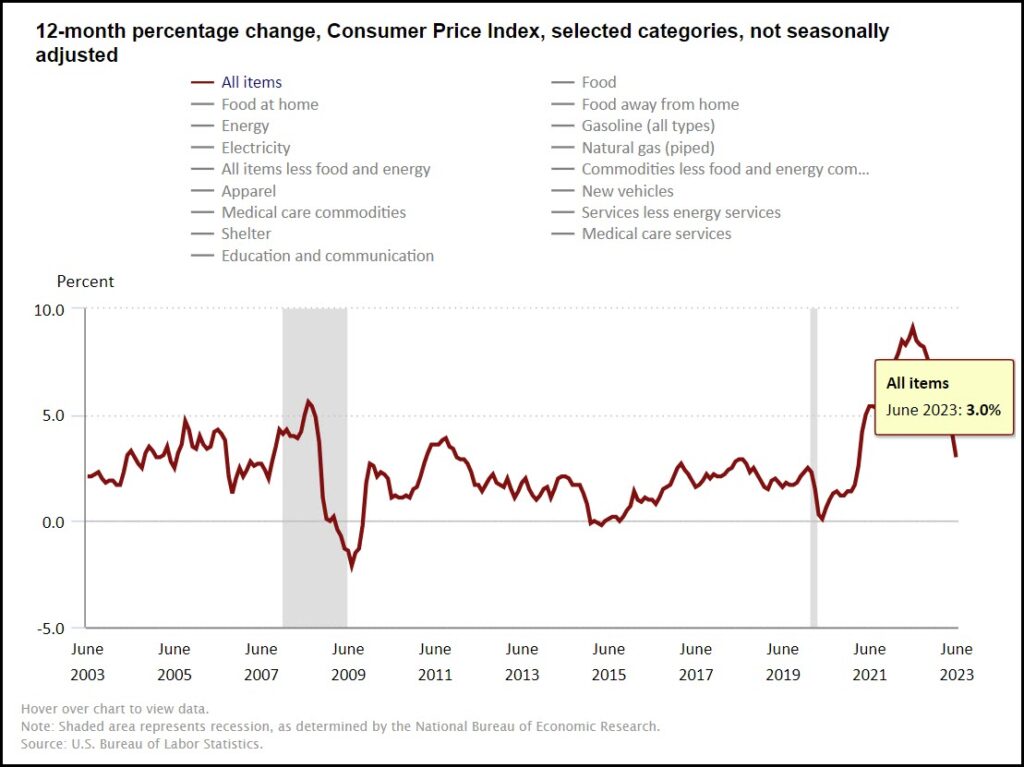
Inflation Trend The Last 20 Years
The last 20 years witnessed 2 recessions where inflation declined, as shown in the shaded areas in the chart. The mortgage crisis in 2008 caused a sharp drop in the economy and therefore inflation, and 2020 saw the onset of COVID rapidly shut down the economy, causing unemployment to rise to 14%; however, by 2022, supply chain shortages caused prices to skyrocket, only to fall back to normal in 2023.
What Happened The Last 12 Months?
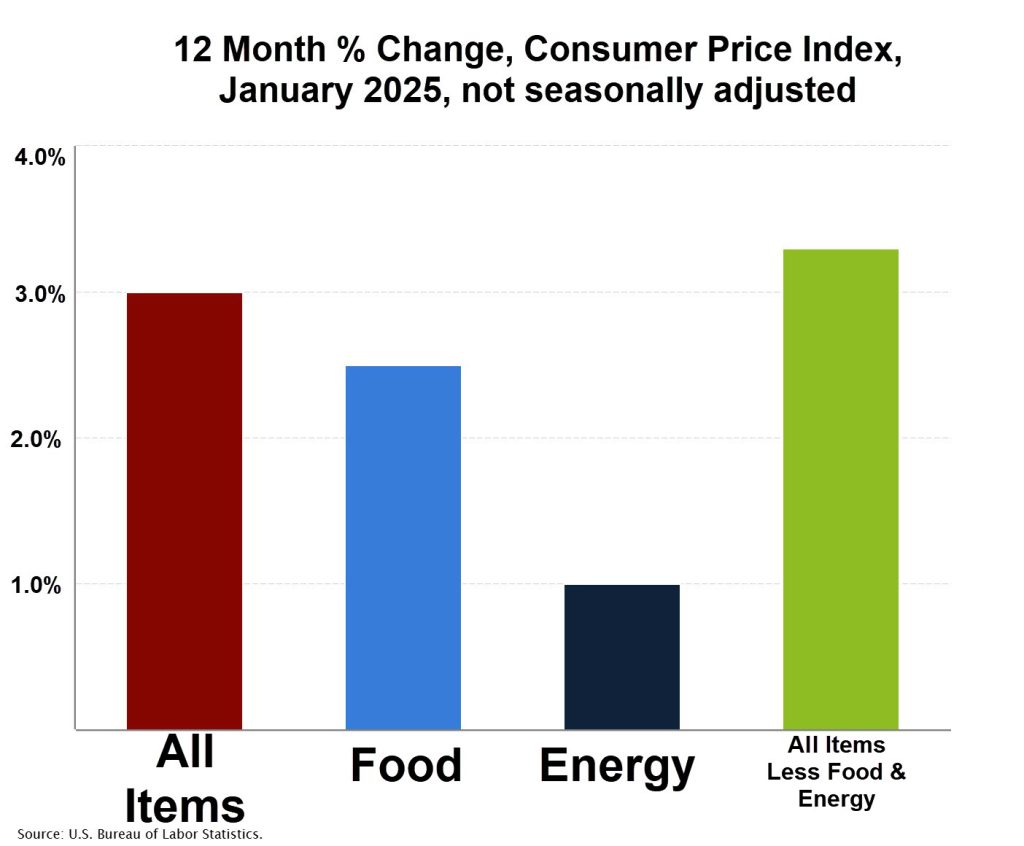
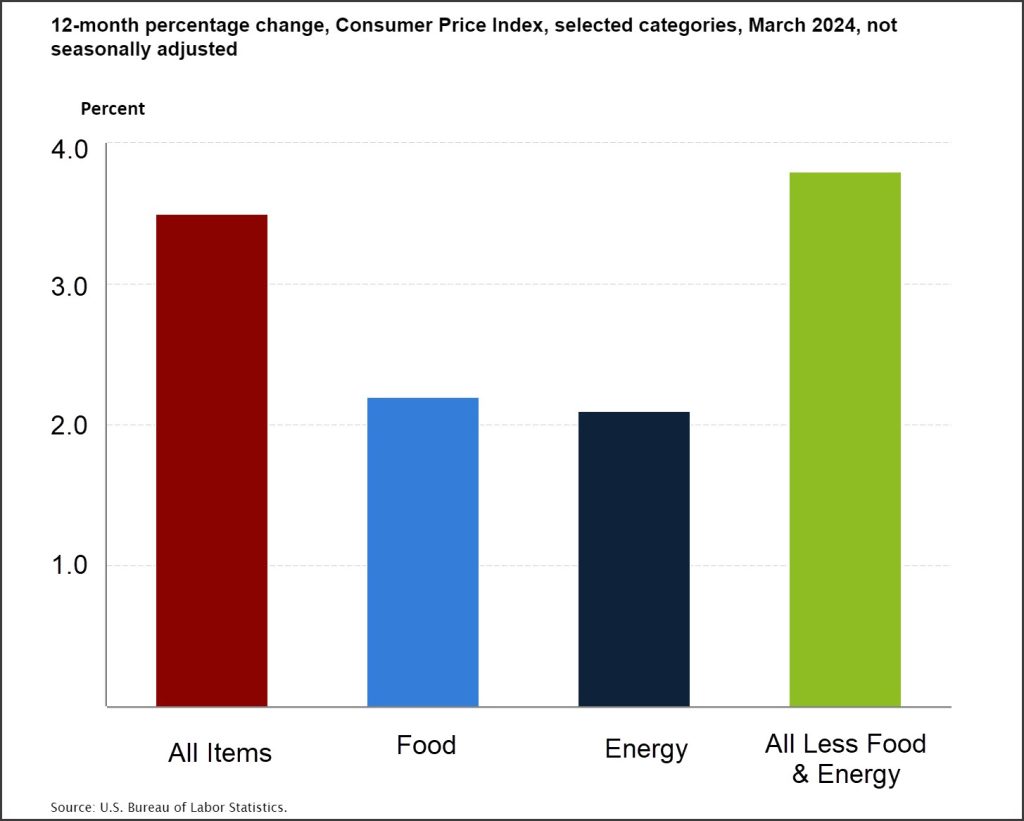
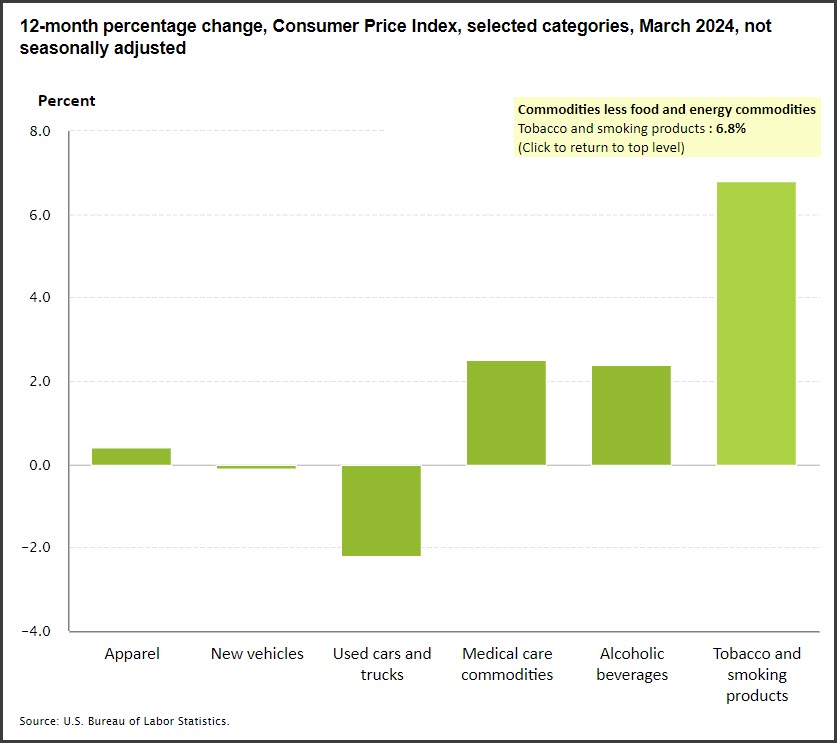
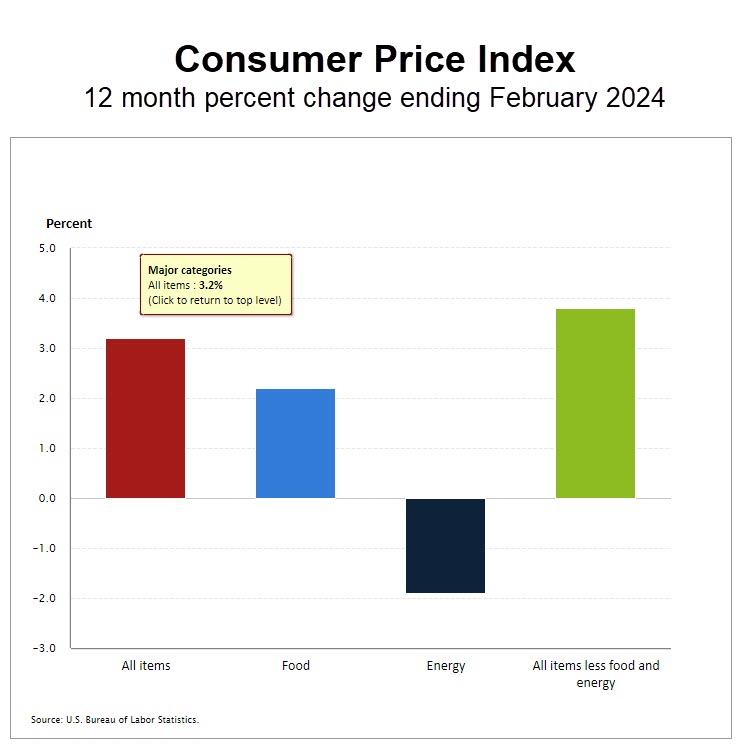
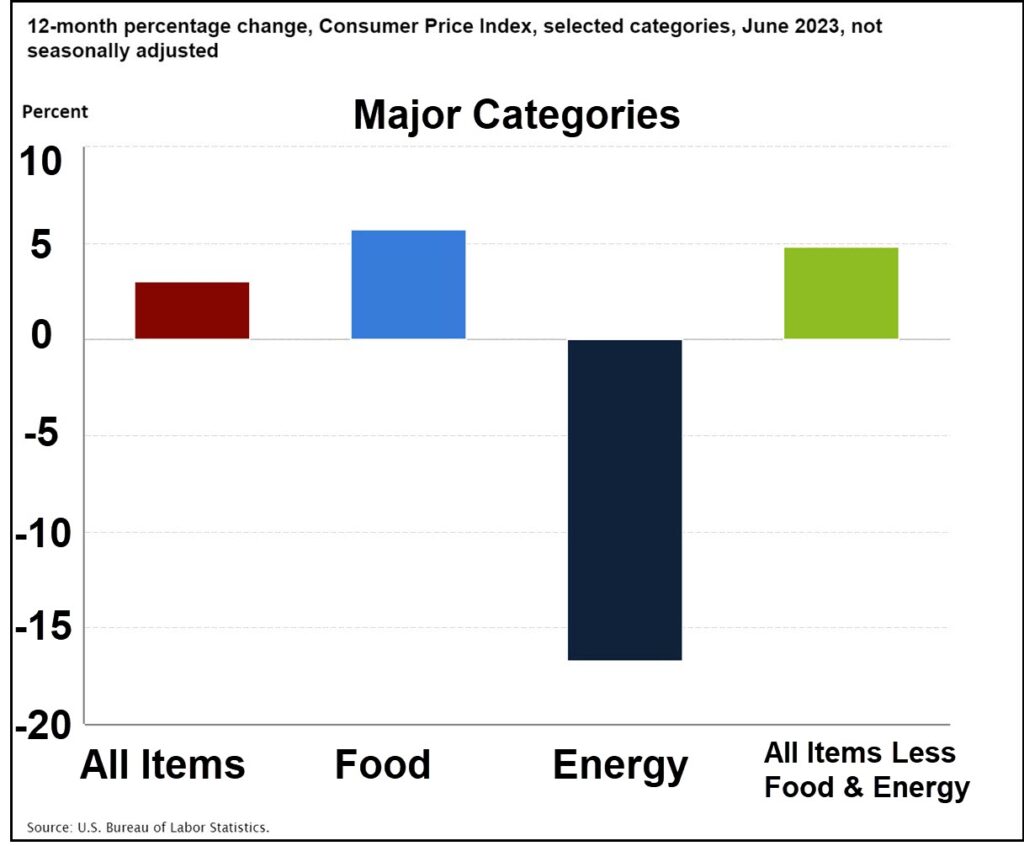
The Consumer Price Index is comprised of major categories including "Food" and "Energy", but like any government agency there is a 3rd category called "All Items Less Food & Energy" which includes clothing, vehicles, booze, medical care, rent, cars, airlines and smoking.
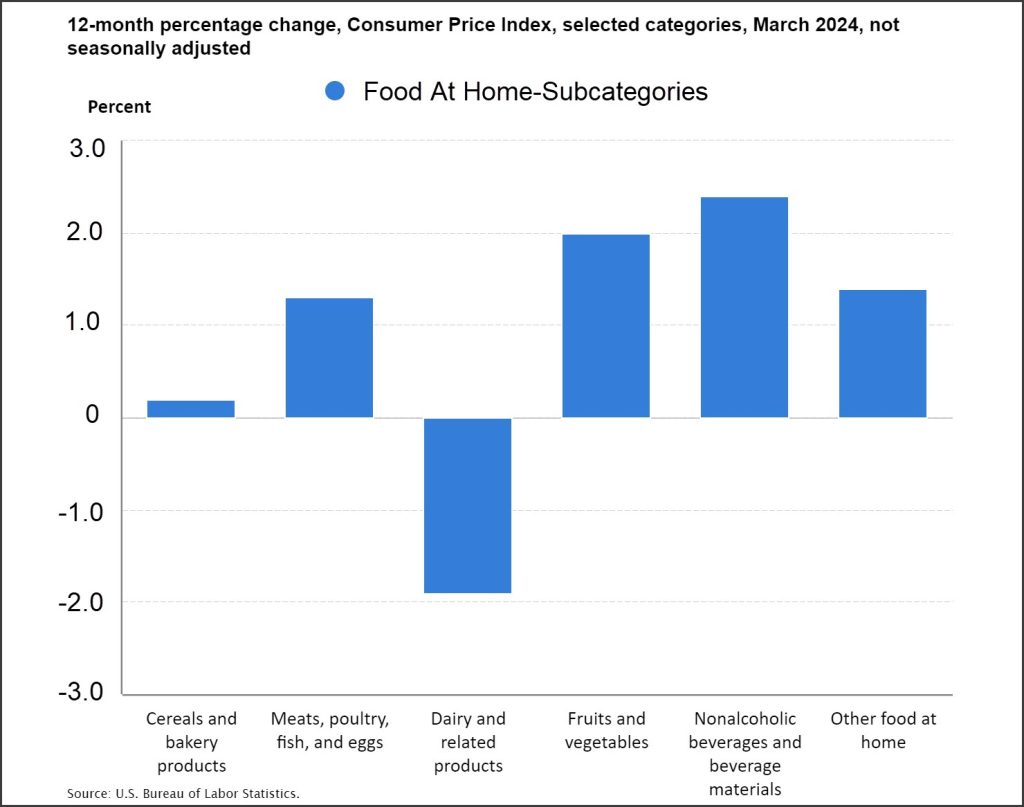
The last 12 months saw inflation increase 3%, but the food component only increased 2.5%, and that number is an average of two categories. Food can be further divided into "Food At Home" which increased 1.9%, including a 15% price increase for eggs, and "Food Away From Home" which increased 3.4%.
Energy Prices Drop
Energy prices increased 1% over the last year, but that category is comprised of gasoline which dropped .2% and fuel oil which dropped 5.3% over the last year. Electricity prices increased 1.9% and natural gas prices increased 4.9%.
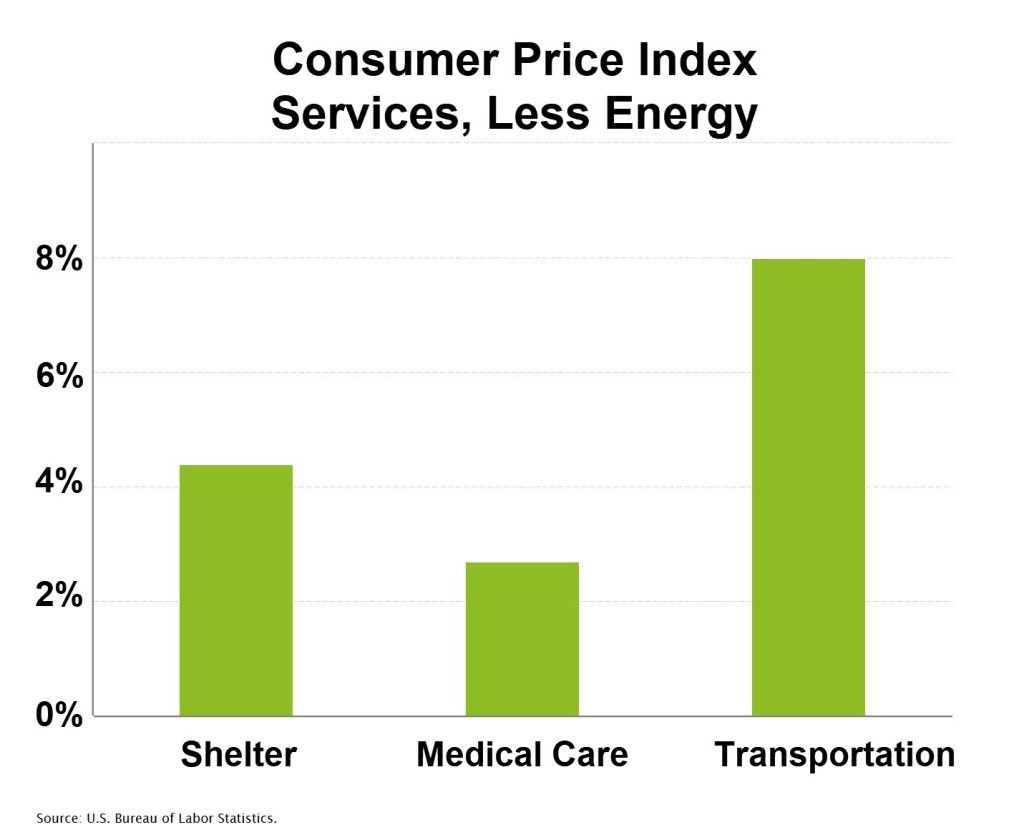
Everything Else Category
The remaining major category for the Consumer Price Index is called "All Items-Less Food & Energy" and increased 3.3% over the last 12 months. That category includes "Shelter" which increased 4.4%, which was the smallest increase in 3 years, and "Medical Care" which increased 1.6%, but the dagger in the heart was an 8% increase in "Transportation" including an 11.8% increase in auto insurance and 7.1% increase in airline prices.
Summary
The Consumer Price Index has 8 different calculation methods, including chained, unchained, seasonally adjusted and not seasonally adjusted, plus monthly calculations that some would incorrectly annualize. But the main idea to take home from this article is that inflation is not just one number, but is a bird's eye view of prices and when you drill down into the sectors, you can see lots of hens running around laying lots of eggs, each one doing something special.
Want more information on inflation and how the Consumer Price Index affects your lease? Catch our articles:
It is no surprise that the Chiefs will win the Superbowl by 7 points tomorrow, but the latest data on the New Orleans office market will shock you. We analyzed all the current listed office space for lease in New Orleans, looking for insight to future trends by examining 2,878,471 square feet for lease in 493 listings in 95 different properties. We discovered that only 9% of the listings account for 36% of the square footage for lease. We also examined what type of operating expenses are commonly passed through to tenants, and are able to conclude some surprising trends on the New Orleans office market for lease. Let's get started.
New Orleans Office Market History
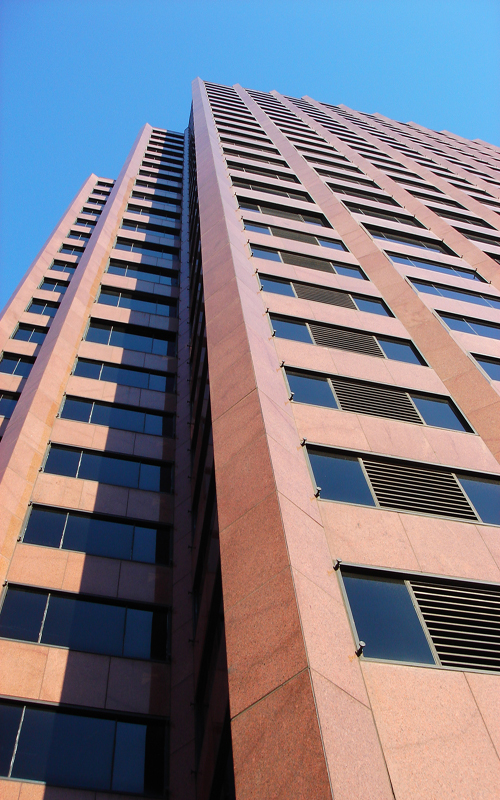
International Trade Mart Office Building-Now a Four Seasons
We have been researching and writing about the commercial office market in New Orleans and Louisiana for 10 years now, and there is an interesting history to it. The New Orleans office market is different from the Metairie market and most other large population cities in the South. Most of the downtown office space is located in high rise office towers, with the oldest built during the oil boom of the 1970's by now banker/developer Joe Canizaro, but the last office tower was built in the 1980's.
The office tower movement began as the Canal Street retail sector started a decline and the parallel Poydras Street became the place to be, but no new office towers have been constructed in the last 35 years in New Orleans.
Current Office Market For Lease
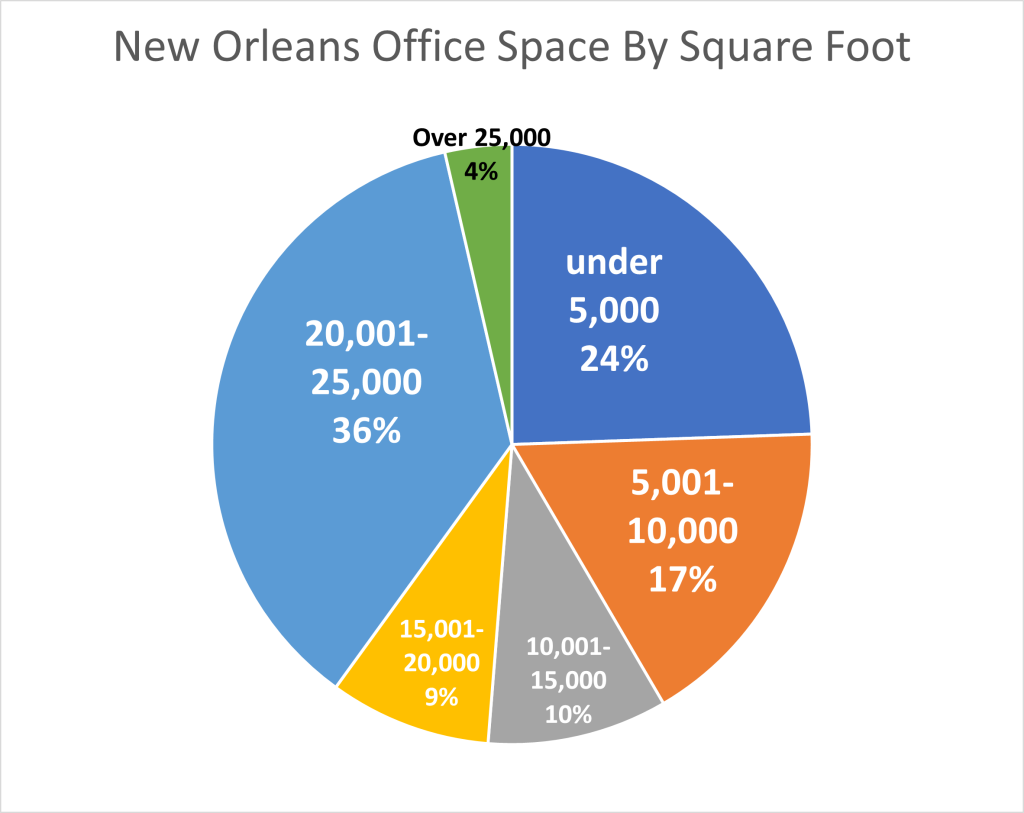
New Orleans Office Space For Lease By Size
Currently there are 95 office properties with space for lease in New Orleans, with a total of 493 listed individual spaces. Of the 493 spaces for lease, the largest number of square feet for lease is between 20,001 and 25,000 square feet in size, with 36%, or 1,048,003 SF for lease total.
This has major implications, since these are usually full floor spaces that the landlord does not want to subdivide; so for the space to be leased, you would need a large company coming into the area with 50-100 employees, looking for office space, or you would need a law firm, accounting, engineering or architectural firm to relocate out of an existing space. New Orleans has none of those.
The conclusion is that the majority of these large office spaces will never be leased, especially because landlords refuse to reduce the rents to attract tenants, since the value of the building, and thus the loan to a lender, is connected to the current asking rent rate, as well as net operating income. As values fall, lenders will require owners to add funds to maintain equity/loan ratios, causing highly leveraged properties to default.
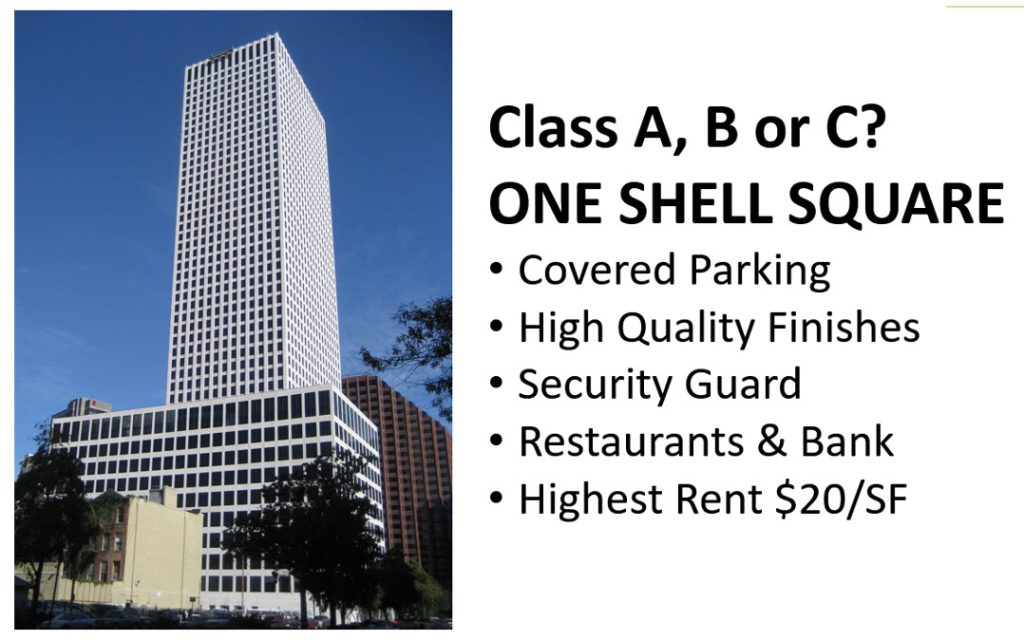
The Good News About Office Lease Rates
One Shell Square-Once The Best, Now Ailing
The good news is that the next highest bracket of listed office space for lease is a size less than 5,000 square feet, which accounts for 24% of the market and 68% of the number of listings. This size office space can attract newer businesses such as start-ups, which we find in New Orleans because people visit, then love the culture, and then decide to stay and open or relocate a business.
That Lease Is Gross
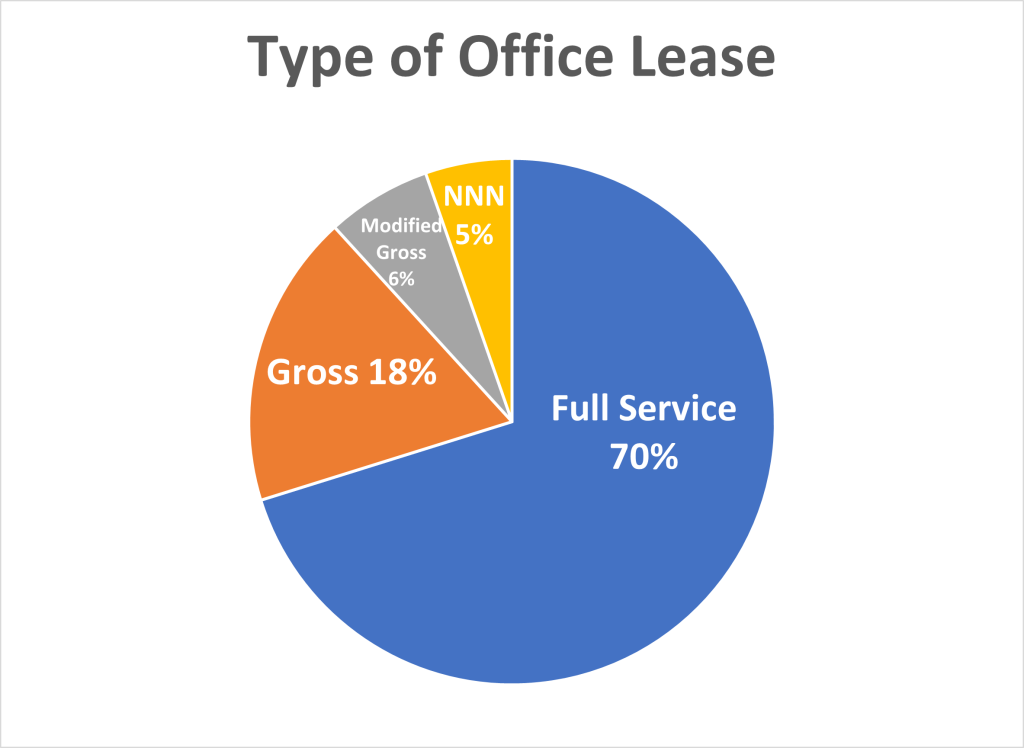
Type of Office Lease Prices
About 70% of the square footage for lease, 1,926,363 SF, is priced as full service, which means all utilities are included in the rent rate. Only 5% were triple net, which means all operating expenses are passed on to the tenants, including, property taxes, fire insurance and unusual but expensive issues like restriping the parking lot. Here are Moody's definitions of the various types of lease pricing:
Gross: The landlord covers base year expenses except for janitorial, utilities, and outside trash removal.
Full Service: The landlord pays all or most of the operating expenses, taxes, and janitorial.
NNN: Tenant pays all operating expenses, taxes, and insurance.
Summary
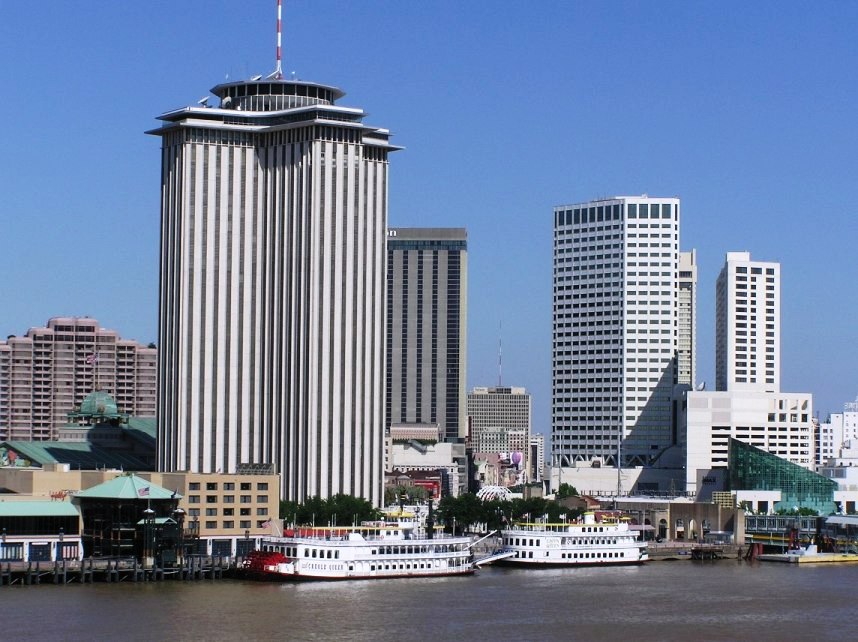
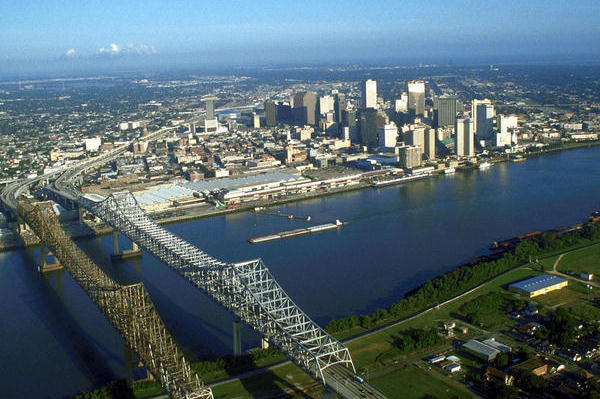
New Orleans Skyline
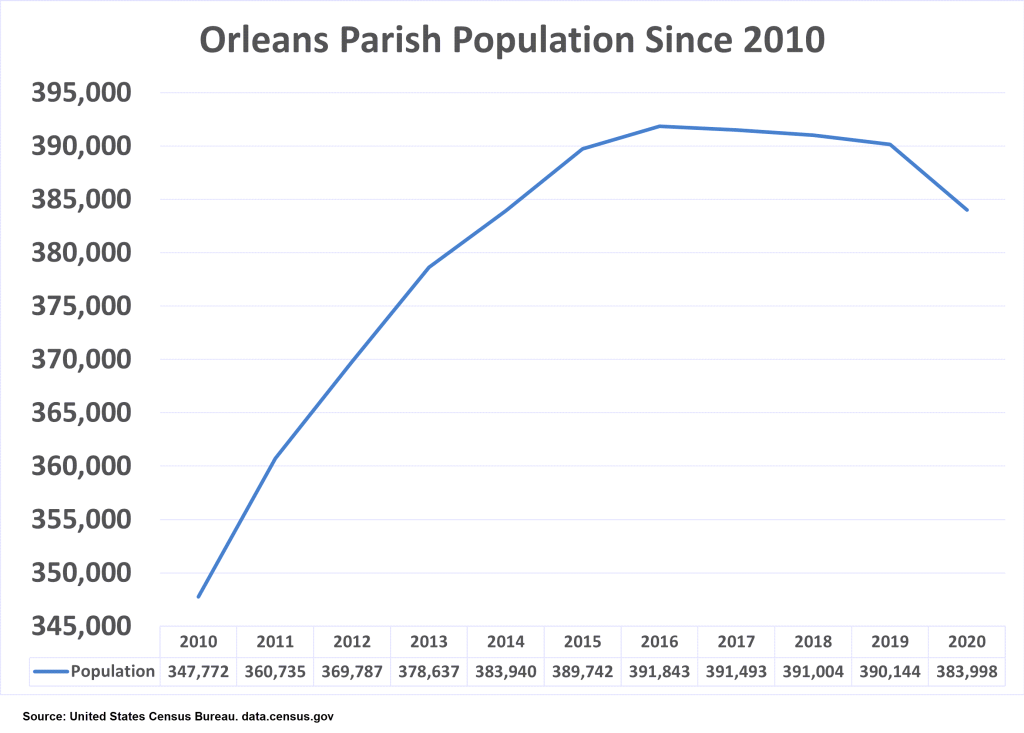
The New Orleans office market reflects the national trend in declining occupancy, and not necessarily due to Covid. The population in New Orleans has been declining over the last 10 years, and recently was named as the number one city in the nation for population decline rate. The long term office market trend follows population growth, and a movement by employers to force employees back into the office won't fix it.
One solution offered is to convert office towers to needed residential space. We negotiated one of the largest office leases in New Orleans, 75,000 square feet, representing building owner ENI who leased several floors to the adjacent Hyatt Hotel to be used as hotel space, and we concluded that business model will not work for the other office towers in New Orleans, It is just not economically feasible.
Compounding the issue is that office tower owners are unwilling to lower prices to increase demand. The result will be that highly leveraged office towers will fall back into the hands of lenders, continuing the decline in the Class A office market, and decimating the Class B office market who will be forced to lower prices much further.
Stay tuned for our next report on prices of the New Orleans office market and also trends in the Metairie office market. For more information on prices and office space leased, catch our blog: A Drill Down Into 2023 vs. 2024 Office Market
At first glance, imposing tariffs or quotas appear to be the perfect solution to get American industries back on track to prosperity, but the reality is that tariffs steal money out of consumers’ pockets by causing prices to increase, stifling creativity, rewarding inefficiencies and destroying the competitive drive that allows a free market economy to deliver cheaper, smarter and innovative products to you.
If you skipped college or avoided a business degree, you missed the basic economics course that explains why tariffs and quotas work in communist countries but never work in a free market economy. This article refreshes you on Econ 101 and explains why tariffs in America cost you over $70 billion every year.
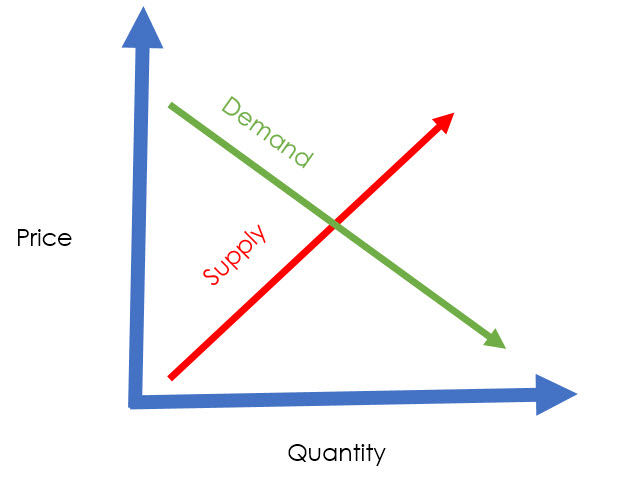
The price of a good is the intersection, or equilibrium, of the demand and the supply. The chart illustrates the interaction between increased quantity and increased prices for buyers (demand curve) and suppliers (supply curve). The supply curve always rises since, as prices increase, providers of goods want to sell more and the demand curve always declines, since consumers always want to buy less. The intersection of supply and demand tells us the long term equilibrium of price and quantity.
Tariffs and Quotas
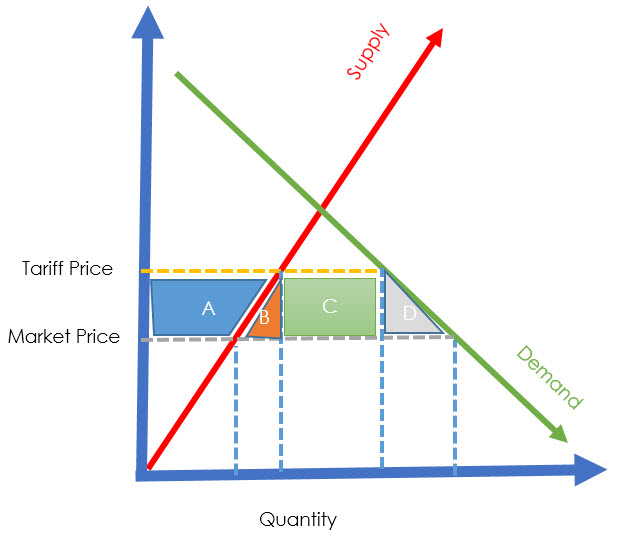
A tariff is a tax on imports, paid to the government. Domestic producers are exempt from the tariff. A quota is a limit on the quantity allowed to be imported. The result of both is an increase in the price of the good, from the market price to the new tariff price. American manufacturers get to charge the new price, and manufacturers overseas receive the market price but pay the tariff to the US government. The government gains area “D”, the revenue from the tariff; however, American consumers pay the higher price measured by areas A+B+C+D. Even if the government passes along to consumers the revenue from the tariff, the loss to consumers is still area B+D.
What Can We Learn From Steel Industry Tariffs
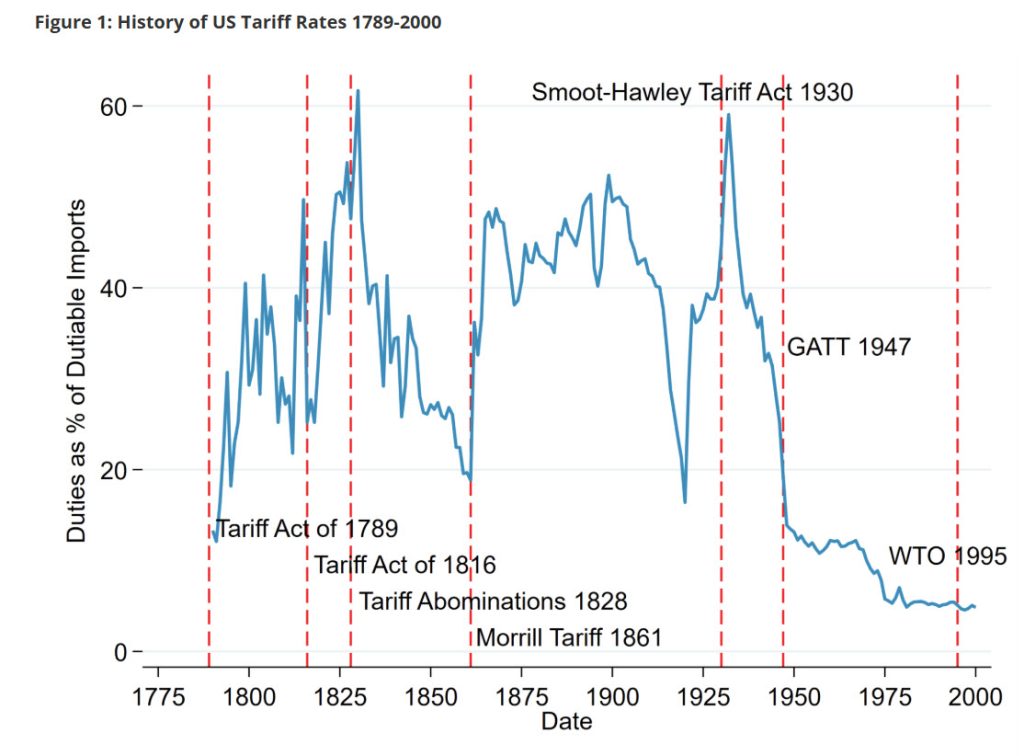
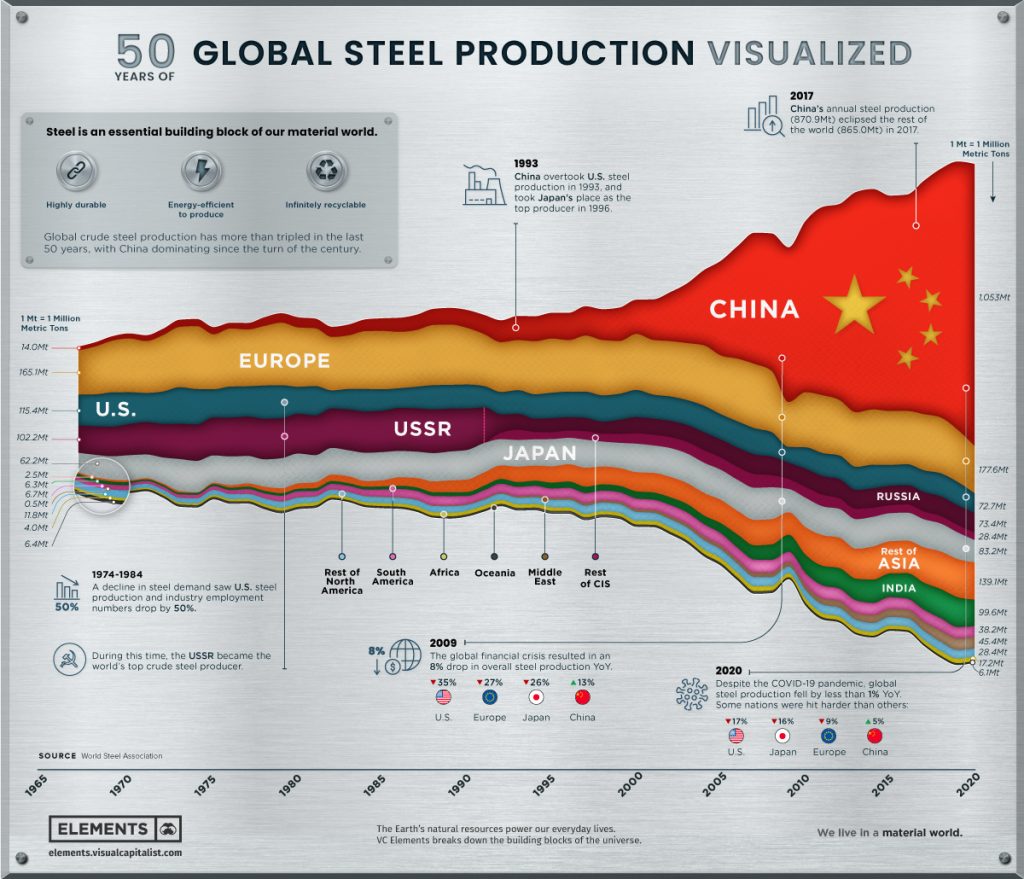
America has many precedents that teach us tariffs are bad policy, and the most obvious is the steel industry. Going back 70 years, the steel industry was an oligopoly, with just a few manufacturers and little competition, allowing the industry to raise prices 9% annually in the late 1940’s, twice the rate of wholesale prices.
In the early 1950’s, steel prices increased 4.8% annually at a time when the wholesale price index was falling. In the late 1950’s, steel prices increased 7.1% annually, three times wholesale prices. In 1969, quotas were imposed and steel prices increased 14 times greater than they had in the previous 9 years, during a time of recession and 25% of industry capacity was in an idle state. The result was a lag in technology. American steel companies failed to introduce the oxygen process and continuous casting which put them at a disadvantage. Their oligopolistic pricing policy kept American companies from competing in the world market and eventually allowed Chinese imports to erode their market by producing a better product at a lower price.
Summary
Tariffs and quotas are not sound public policy. They undermine competitive discipline which forces industries to always reduce cost and increase efficiency, driving creativity and invention. Protectionism has a narcotic effect, allowing sick industries to avoid facing up to their problems. Tariffs are bad for consumers, and the math proves it so.
Louisiana Commercial recently negotiated the 10 year lease for medical tenant Velocity Clinical Research who secured 8,000 square feet of space on the 6th floor at 3308 Tulane Avenue in New Orleans. Velocity moved from their Metairie location which no longer met their needs because it did not offer an efficient floor plan.
Louisiana Commercial Realty broker Robert Hand explains, “Velocity came to us for help finding a more efficient office space. While many businesses are moving from downtown New Orleans to Metairie, Velocity is doing the opposite in moving from Metairie to New Orleans. The move made sense for them because the building is in the perfect location and the landlord renovated the space to exactly meet their needs. We negotiated all the minute details of the lease for Velocity and also the landlord so that both got what they wanted.”
Here is a list of features the 8,000 square foot space at 3308 Tulane offered:
Private exam rooms
Reception area
Free parking
Nurses station
High speed internet access
Secure record storage
Certified research laboratory
Refrigerated centrifuge
Temperature controlled pharmaceutical storage
Freezers for specimens at minus 70 degrees Celsius
Backup generator
Velocity is the world’s top clinical research organization, with 63 locations in the US and 34 locations in Europe, conducting clinical trials in infectious diseases to bring successful vaccines to market. For example, Velocity helped conduct studies for approval of a new flu vaccine as well as treatment for asthma.
This is the 8th tenant lease that Louisiana Commercial Realty has negotiated at 3308 Tulane. Velocity’s 8,000 square foot lease ranks as the largest lease for office space in the mid-city area and ranks in the top 5 New Orleans office leases for 2024.
The population in New Orleans and Metairie is declining. Residents are moving out of both cities in droves. Data show that in the last 3 years, New Orleans and Metairie both have the 2nd largest percent decline in population among all the U.S. cities. Tracked by the Census Bureau, the population declined 17,024 last year alone and 45,121 for the last 3 years, which amounts to 4.69% of the total New Orleans/Metairie population. That percent decline is higher than San Francisco, Los Angeles, Pittsburg and Detroit. Only Honolulu has a higher percent decline in population.
Why Population Growth Is Important
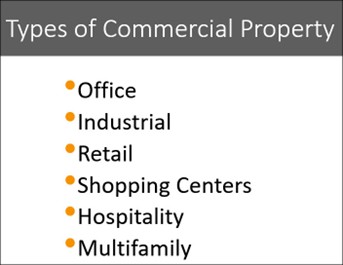
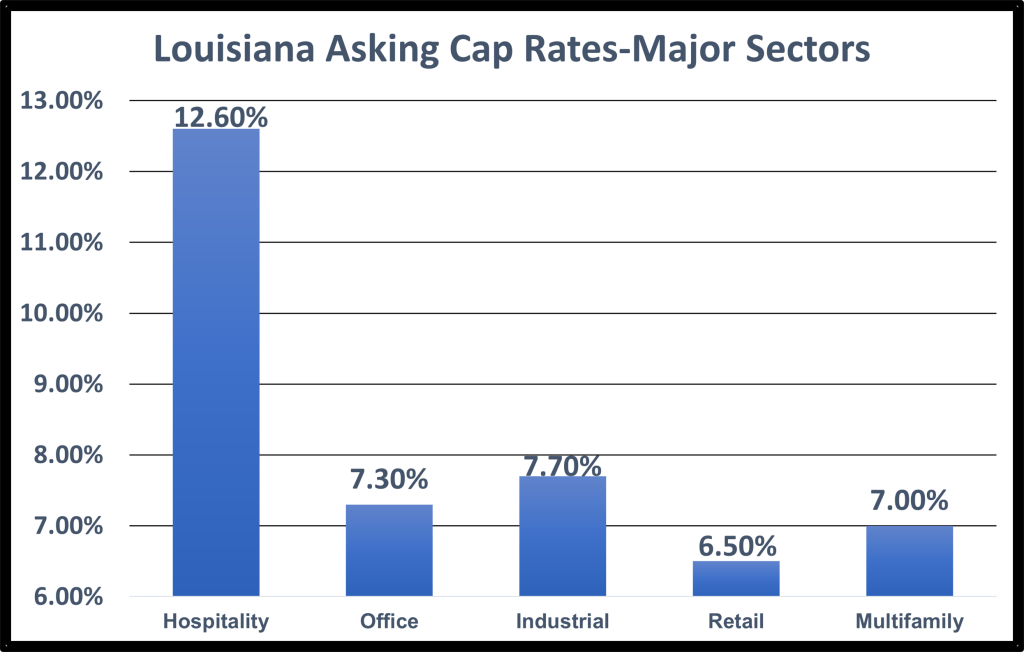
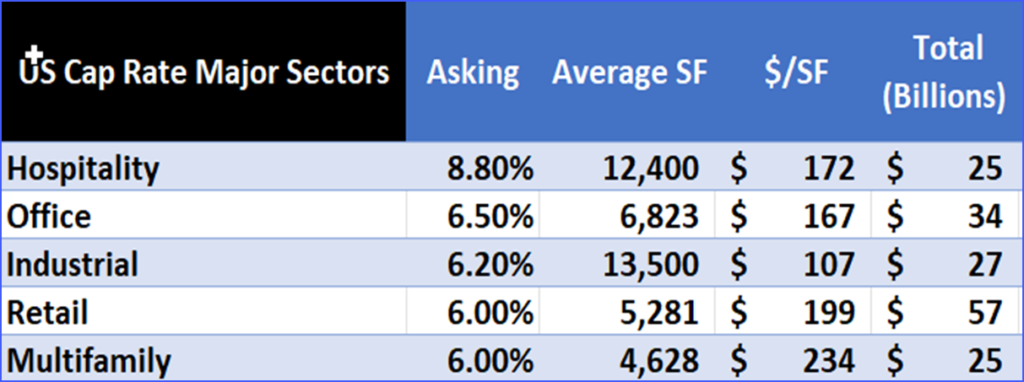
The commercial real estate market only grows in areas where population is growing, and the more growth in population, the higher the growth in businesses and commercial real estate. Of the 5 main sectors of commercial real estate: office, retail, multi-family, industrial and hospitality, 3 are dependent on a growing population. Let's look at how each sector is affected by a declining population.
Office Sector
Offices are dependent on new businesses coming into the area or current businesses expanding their employee count. Even with the increase in employees working remotely, the amount of office space leased is usually negotiated for 5 to 10 year periods so companies are committed to office space regardless of whether the employees show up there or not. In order for the office market to grow, landlords need more businesses moving into the area who provide services for a growing population. For example, if the population is growing, residents would buy a home in the area which would cause an increase in other businesses such as real estate agents, landscapers, contractors, appliance and furniture retailers who depend on new home owners. Each new business would have a need for administration which would lease new office space.
1100 Poydras is 4th largest office tower in New Orleans
The decline in New Orleans population has decimated the office market, causing two of the largest office tower owners to be able to collect enough rent to make the loan payments.
1100 Poydras is the 4th largest office building in New Orleans and the owner defaulted on a $56,000,000 loan causing the bank to foreclose on the property.
1615 Poydras is a 475,000 square foot office tower default due to declining rent income and named in the top 5 loan losses in the U.S. office sector with debt of $30,000,000 and liquidated recently for $18,000,000.
1615 Poydras is in top 5 loan losses in U.S.
Retail
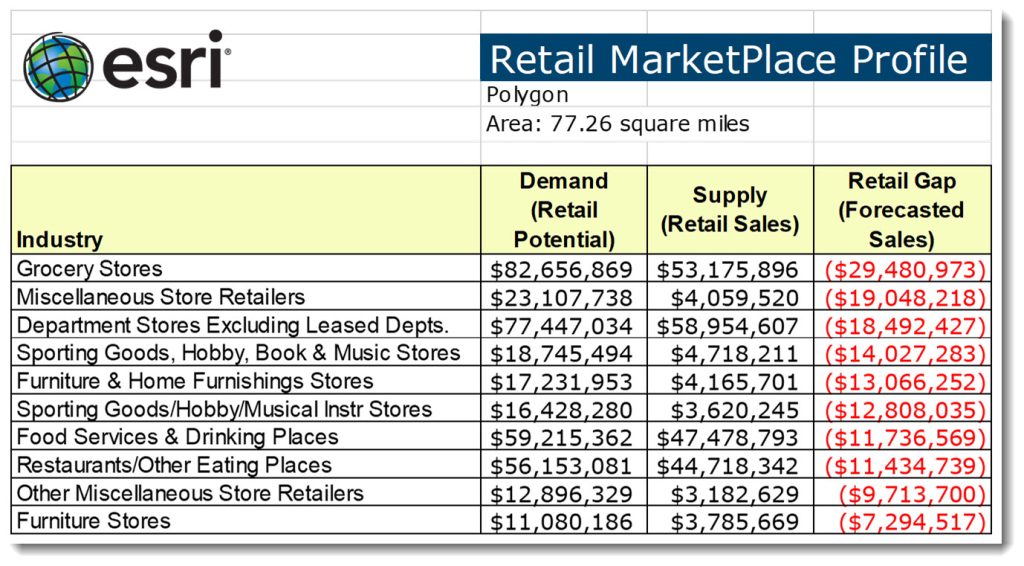
The Retail sector depends on consumer spending patterns, which are heavily tracked by data analysis companies. For a retailer to come into a market, they first research how much money is spent by residents within a 5, 10 & 15 minute drive time specifically on goods a business sells, and then the retailer compares that spending to how much is sold by existing retailers. The difference is called a Spending Gap, and the higher the population, the greater the consumer spending and the more likely a business would be successful in that area. Since starting a business is an expensive endeavor, retailers want to make sure the area they target will make the business feasible, otherwise they will just go somewhere else.
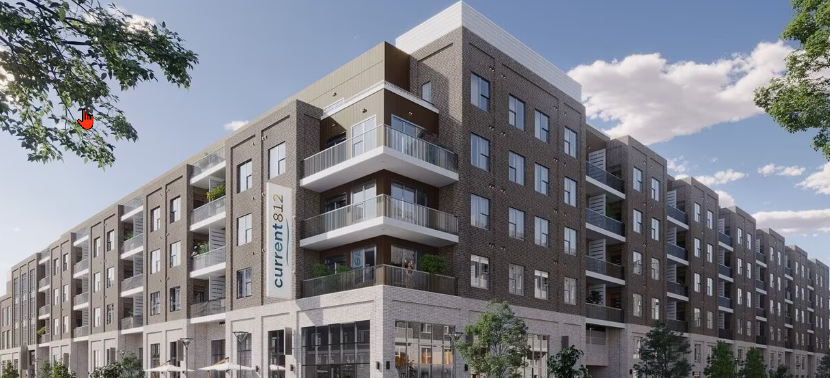
Multi-Family
Apartment demand depends on new people moving into a city when they get new jobs or are transferred. All but one of the new apartment developments in New Orleans occurred during periods of growing population after Hurricane Katrina. We brokered 90% of the land acquisitions to make building the apartments feasible, so we should know.
Developers were very specific about the areas they wanted to build apartments in, and target areas where people were moving to. Apartment developments like this usually cost $10,000,000 to $30,000,000 to build, not to mention the time it takes to get them leased up, so the investments requires a high degree of confidence that the population will support he investment.
Summary
It is just common sense that commercial real estate depends on a growing population, but what will surprise you is the correlation and multiplier effect that declining population has on 3 of the 5 sectors of commercial property. New Orleans' trophy for the 2nd highest rate of declining population in the United States is the reality and businesses have to be hopeful but play the cards they are dealt.
The optimistic part of this declining population reality is that we can fix it, but it will take city, state and federal government to change their thinking. Currently New Orleans has a 4.45% tax plus a state tax of 5% on purchases. There is a 20% tax on hotels that tourists stay in. There is a 25% increase in property taxes by the city on commercial property. If government can reduce taxes a little we can gain several times more than that from the increase in business in the office, retail and multi-family commercial sectors.
The Louisiana Real Estate Commission approved Louisiana Commercial Realty's commercial property workshop to train real estate agents on the complexities of commercial property. The workshop is approved for continuing education credits which are required by the commission each year in order for a Louisiana agent to maintain their license. Chapters of our workshop teach commercial real estate agents and investors what they need to know about each of the 6 major types of commercial property.
We Spent Years Creating A Powerful Workshop
The workshop dives deep into the motivations of buyers, sellers, landlords and tenants. Each of these 4 stakeholders has a different objective so a commercial real estate agent must quarterback all the various entities and tactfully guide the decision-makers, government authorities, bankers, appraisers and property owners, who often conflict when interacting with each other.
The Workshop Teaches How To Value Commercial Property
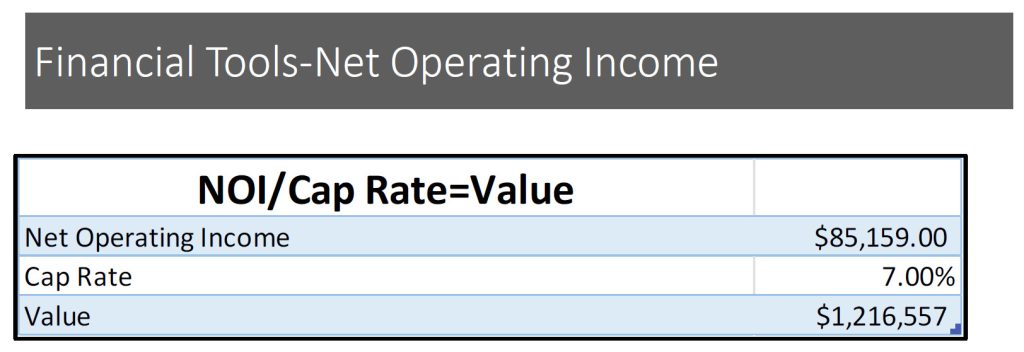
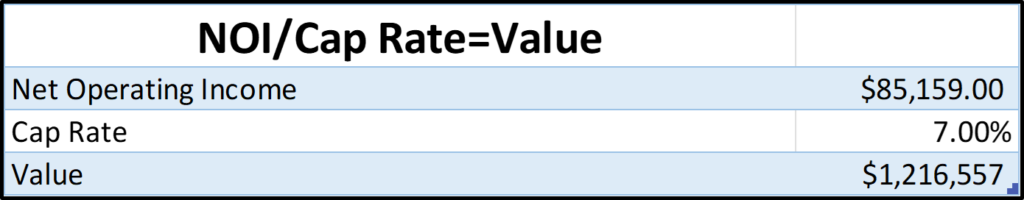
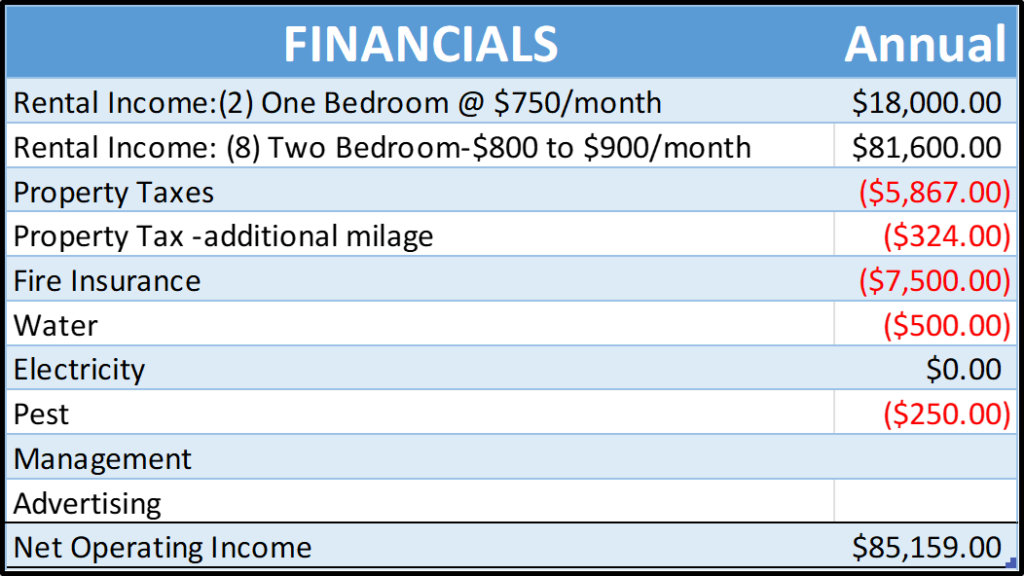
The workshop also covers one of the most misunderstood features of commercial real estate: how to value property. We spent years writing appraisals for two of the top firms in New Orleans, so we understand appraisals are only meant for a bank committee to justify loaning money and have little to do with a price at which a property can be sold. The most accurate method of determining a market price for commercial properties that produce rent income is to apply a Capitalization Rate to the Net Operating Income. For example, if a property produces $85,159 in income (revenues less expenses) you would divide that by a 7% Capitalization Rate. This means a buyer should, at most, be willing to pay $1.2 million for that commercial property.
The Workshop Shares Technology To Make Great Decisions
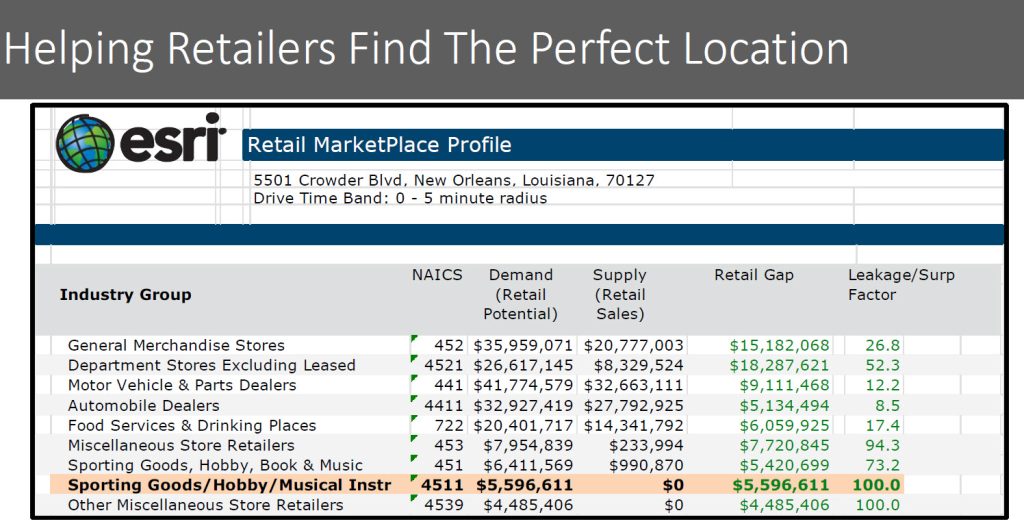
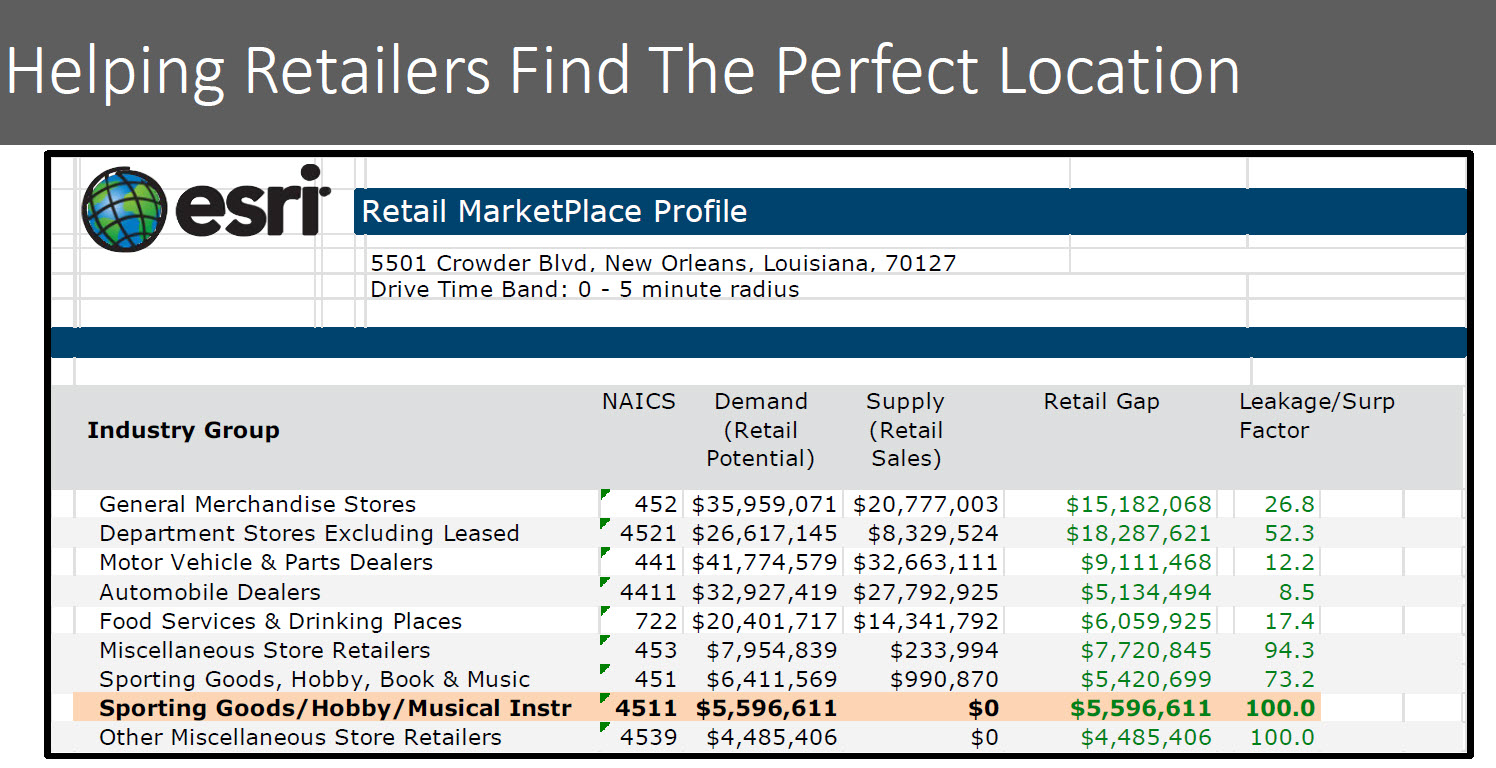
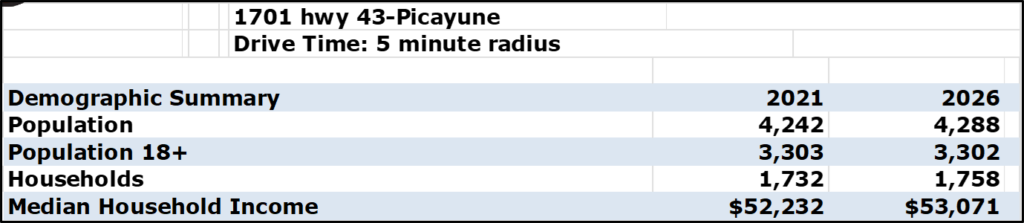
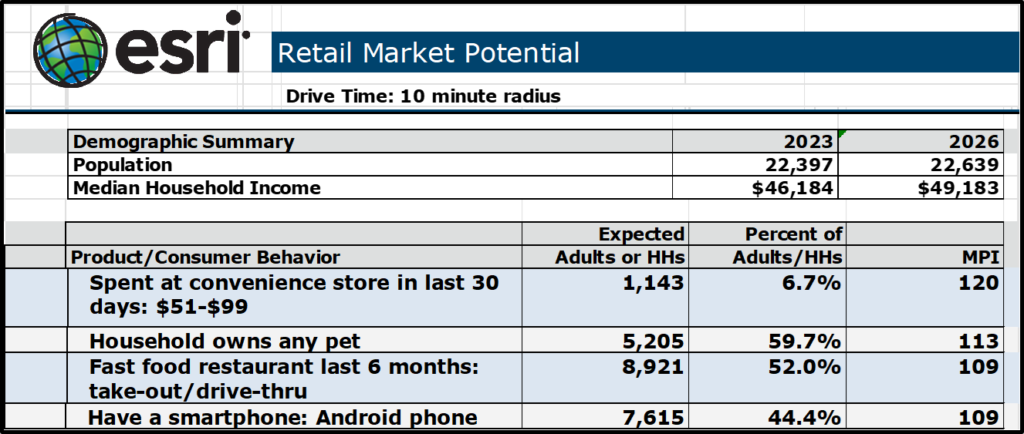
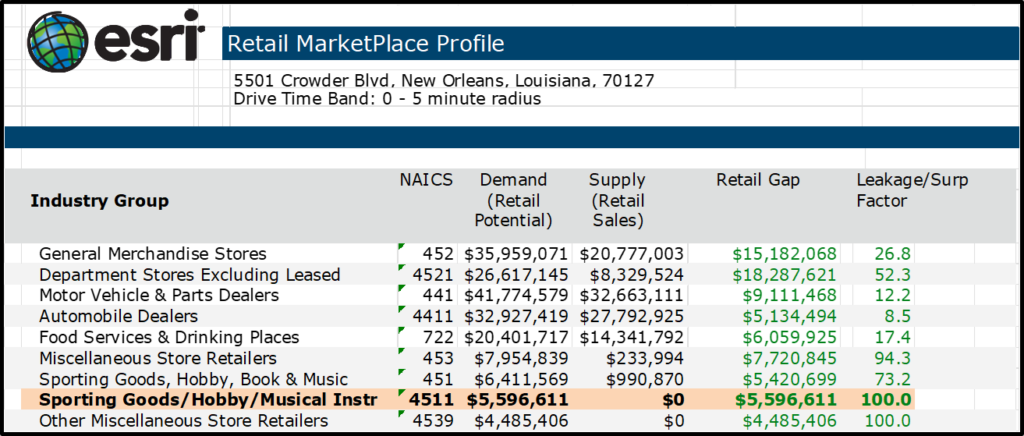
Commercial real estate agents and investors need to be proficient in using technology to determine the best location for their business. Normally agents or investors only know about demographics, including population, income and age; however, finding successful locations requires knowledge about how nearby residents spend their money. This research depicted in the table helps businesses know how residents within a 5 mile radius spend their money. In this example, residents spend $5,591,611 on sporing goods but there is no sporting goods store in the area. The workshop details how to get valuable information to find the perfect location for a business.
Attend The In-Person Workshop
We have 20 chapters in the commercial real estate workshop for agents and investors who want to be proficient in commercial property, so contact us for locations and times.
Want to read more now about commercial real estate? Catch our blog:
This article drills down into the office market in New Orleans and Metairie, examining 350,000 square feet leased in 143 reported transactions, comparing office space lease terms from 2024 to 2023 and providing insight into office market trends.
2023 Office Square Foot Leased
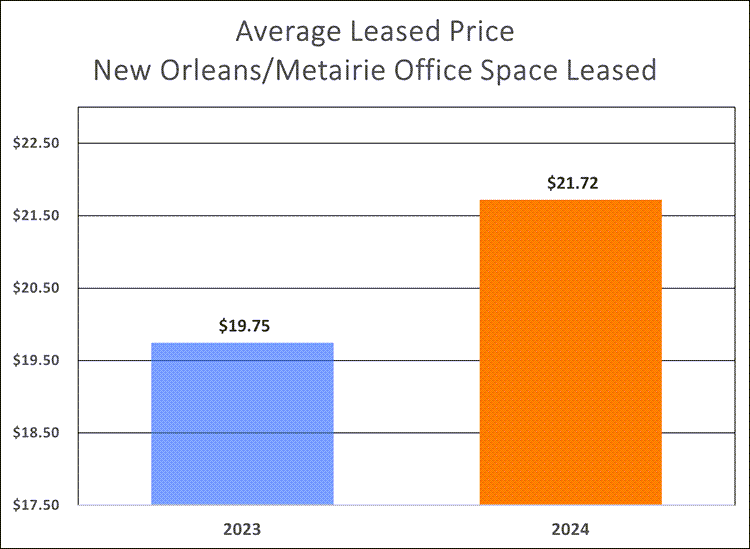
In 2023, 184,885 square feet of office space was leased in 78 listings in 41 properties. The average space was 2,400 SF and leased at $19.75 per square foot, but the operating expense terms varied.
For example, triple net leases comprised only 9% of all office space leased but 59% was leased as full service. The average triple net rate was $16.77/SF and the average full service rate was $21.00/SF. Triple net leases are common in industrial spaces leased but full service is prevalent in the office sector.
The average space leased is 2,070 SF at $21.72/SF. As of October 31, 2024, there have been 66 office spaces leased totaling 136,000 square feet. At this pace, the year end total is forecasted to be 163,964 square feet.
Comparison of 2024 to 2023
Last year, 78 office spaces were leased in 41 properties, ranging from 300 SF to 12,864 SF, averaging 2,400 SF per space leased. Only 10% of the spaces leased exceeded 5,000 square feet. In 2024, spaces range from 167 SF to 18,000 SF, but of the 66 spaces leased, 60 were under 3,500 square feet.
Summary & Insight
SF Leased: 2024 is forecasted at 163,964, which is a 12% decline from 2023 when 184,885 SF was leased.
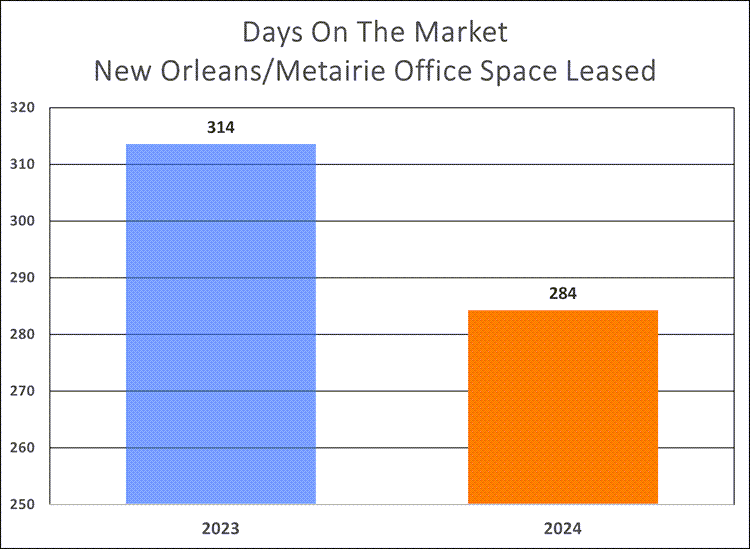
Days On The Market: 2024 is showing 284 days to lease office space, down 10% from 314 days last year.
Price: 2024 is averaging $21.72/SF vs. $19.75 last year.
To summarize, lease prices are up 10%, supply is down 12% and office spaces are leasing 10% faster; but the office market overall is soft for the typical agent. Assuming the average lease was for a period of 5 years and each property had one agent, the average 3% commission only produced an income to the agent of $13,000 per property.
For more information on the office market, including detail descriptions of operating expense terms, check out our two most popular articles:
FEMA is on the ground days before hurricanes hit. I should know because I worked for them. Today they have hundreds of staffers organizing relief, distributing 500,000 meals and 800,000 liters of water, with more infrastructure to come.
For flooded homeowners, you can feel like a deer caught in headlights because you just don't know what to do. Mold sets in within 24 hours so you need to take action. This article outlines what victims of flooded property need to do right now, and what it will cost, as told by a Hurricane Katrina survivor.
Flooded? What To Do Right Now
When your home gets flooded, it can be overwhelming. There is so much devastation that you don't know where to begin. The first thing to do is to call all your friends and ask for help, since this is no time go it alone.
You will be amazed at how word can get around and friends will come to the rescue. Here is a list of what you need immediately and how much things cost that you need to ask people to bring you:
Wet/Dry 3 gal, 5 HP Shop Vac-Lowes with extra filters
$ 49.95
$ 49.95
1
portable fans-Lowes
$ 69.99
$ 279.96
4
Total
$ 2,170.46
Once you have your supplies, start with the highest priority tasks. Have your insurance adjuster examine your property, take lots of photographs, and file a claim with FEMA as soon as possible.
You might have a 4 bedroom home but if only 2 people live there, you will only receive FEMA aid for a 2 person house. Save financial records, photographs, appliances. Everything wet that is salvageable must go outside to dry, all else thrown away.
First Things First
Pull up all wet wood flooring or carpet and discard. Mold can set in within 24-48 hours.
Cover salvageable furniture with sheets.
All wet trim and sheetrock has to be pulled out and discarded into 3 mil black trash bags in Brute cans on wheeled dollies. One person should have the job of taking bags of wet sheetrock outside and refilling trash cans with bags. Break up the sheetrock into small enough pieces so they fit into the trash bags.
Get a ruler and mark a line on every wall at least 24 inches from the floor, or high enough to mark where the wet sheetrock stops. Snap a chalk line or use a level to draw a line. Use a box cutter knife or drywall jab to cut out the wet sheetrock. Pull out trim nails with pliers and remove drywall screws.
Broom out large chunks of debris and insulation.
Wet/Vac out water and remaining debris from studs.
Once exposed, studs are clean and free of debris and insulation, spray with bleach 25% mixture, then place institutional carpet blowers near exposed walls to dry out studs. Let fans and blowers run 24/7. Studs should be dry in 2-3 days.
Pull out all wet kitchen and bath base cabinets and store outside to dry, if possible, remove cabinet doors for ventilation.
Soak up standing water with with cotton head mop and clean floors often with sponge mop, so as not to track sheetrock dust to other rooms. Dust does not mop up by itself, so use ZEP Floor Cleaner.
Got office space in New Orleans? We researched all the office space leased last year in New Orleans and discovered some real surprises. Let's get started.
In 2023 only 90 office spaces were leased in New Orleans
Office space for lease in New Orleans totals 2.8 million square feet in 482 listings, with prices ranging from $12/SF NNN to $19.50 Full Service. But are office spaces actually leased at the listed price? This article drills into the New Orleans office market to determine actual lease prices, and we discovered not that much office space has been leased.
30 Years To Lease The Current Office Space
In the first seven months of 2024, only 16 office spaces in New Orleans have been leased, totaling 53,866 square feet at an average rate of $18.59 per square foot on 3,367 square feet leased. At this rate, it will take 30 years to lease all the office space. Full Service leases account for 62% of the total and 87% were less than 5,000 square feet in size.
Full Service accounted for 62% of the office space leased in the first 7 months of 2024.
What Happened In 2023?
Only 90 office spaces were leased in all of 2023 in New Orleans at an average price of $19.13 per square foot, but that doesn’t tell the whole story. The surprise was that 28% of spaces were under 1,000 square feet and 68% were under 2,500 square feet.
68% Is Under 2,500 SF
68% of office space leased was less than 2,500 SF
The smaller spaces are usually leased by upstart companies, or those sole proprietors tired of working from home where they suffer leaf blowers, garbage trucks and barking dogs during their conference calls. New companies are a good sign, but are not the economic driver that New Orleans needs to recover from losing corporate headquarters with hundreds of employees.
70% Is Full Service
Full Service leases accounted for 70% of the total, and prices ranged from $16.99 to $22.61, with the smaller spaces leasing over $20/SF but then the spaces from 2,500 to 10,000 square feet were negotiated down in price to a range between $16.99/SF to $17.80/SF. This reduction in rent is because landlords aways want the larger tenant which leads landlords to have less negotiating power and since there are lots of spaces this size to pick from, tenants were able to secure reduced rents.
Only 4 Spaces Exceeded 10,000 SF
Smaller SF spaces pay a premium rent
The surprise is what happens to prices in the office sector over 10,000 square feet: prices increase. There were only 4 spaces leased in all of 2023 over 10,000 SF in size, and prices averaged $17.88/SF.
All 10 Spaces Over 5,000 SF Located Downtown
All 10 office spaces leased over 5,000 SF were located in downtown
The larger spaces are always in high rise office towers, such as 1100 Poydras Street, and landlords all quote the same price which gives them negotiating power. All 10 of the office spaces over 5,000 SF leased last year were located in or near downtown New Orleans.
Summary, Insight & Forecast
The office market in New Orleans is dead. For such a large city, having only 90 office spaces leased totaling 233,000 square feet in all of last year depicts a picture of doom and gloom. And 2024 is not much better with only 16 office spaces leased totaling 53,866 square feet in the first 7 months. Look for prices to fall as soon as landlords understand rented space at a lower price means a higher present value than a higher price after 2 years of vacancy. After prices reach equilibrium, tenants will come back to New Orleans office spaces and the momentum will shift. Meanwhile, the opportunity will be to buy depressed office property during this down cycle at prices you will never see again, get it leased, then sell at the next peak.
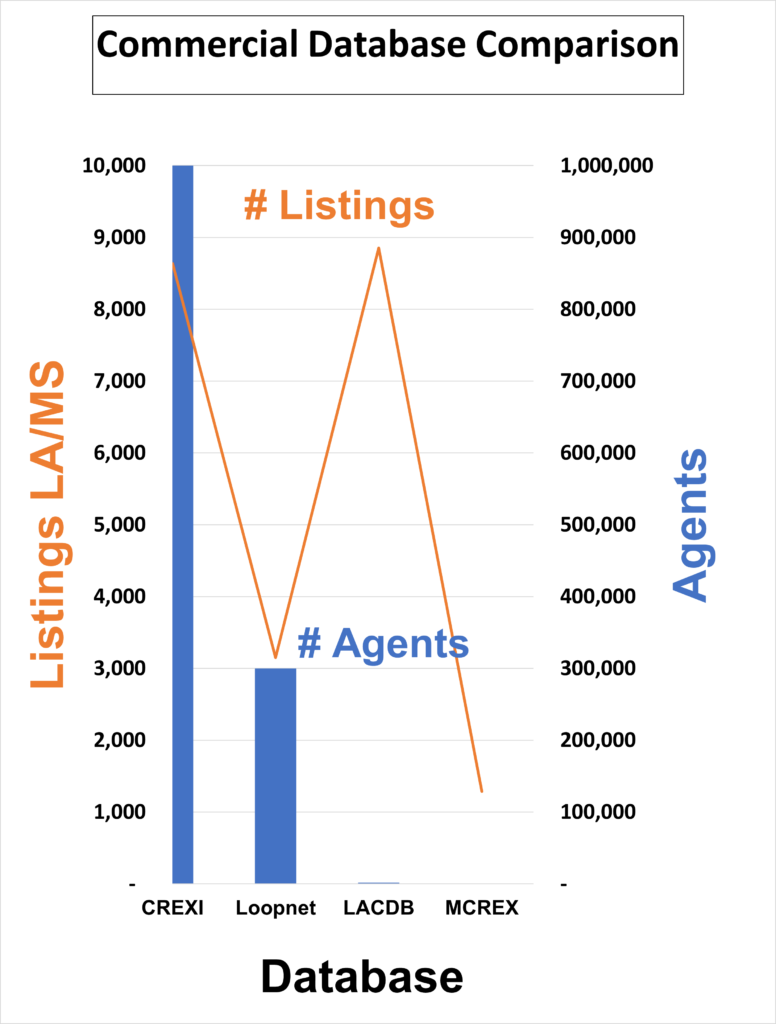
The days are long gone when you can just put up a sign and wait for phone calls to sell or find tenants for commercial property. This article dives into the top commercial databases in Louisiana and Mississippi to expose strengths and weaknesses in using technology to get commercial sold or leased. The top commercial databases are LACDB, MSCREX, Loopnet and CREXI which are utilized by commercial agents to find tenants, sellers and buyers, but we've discovered that the database with the most listings is not the one that works best. Let's get started.
Finding Tenants For Your Commercial Property
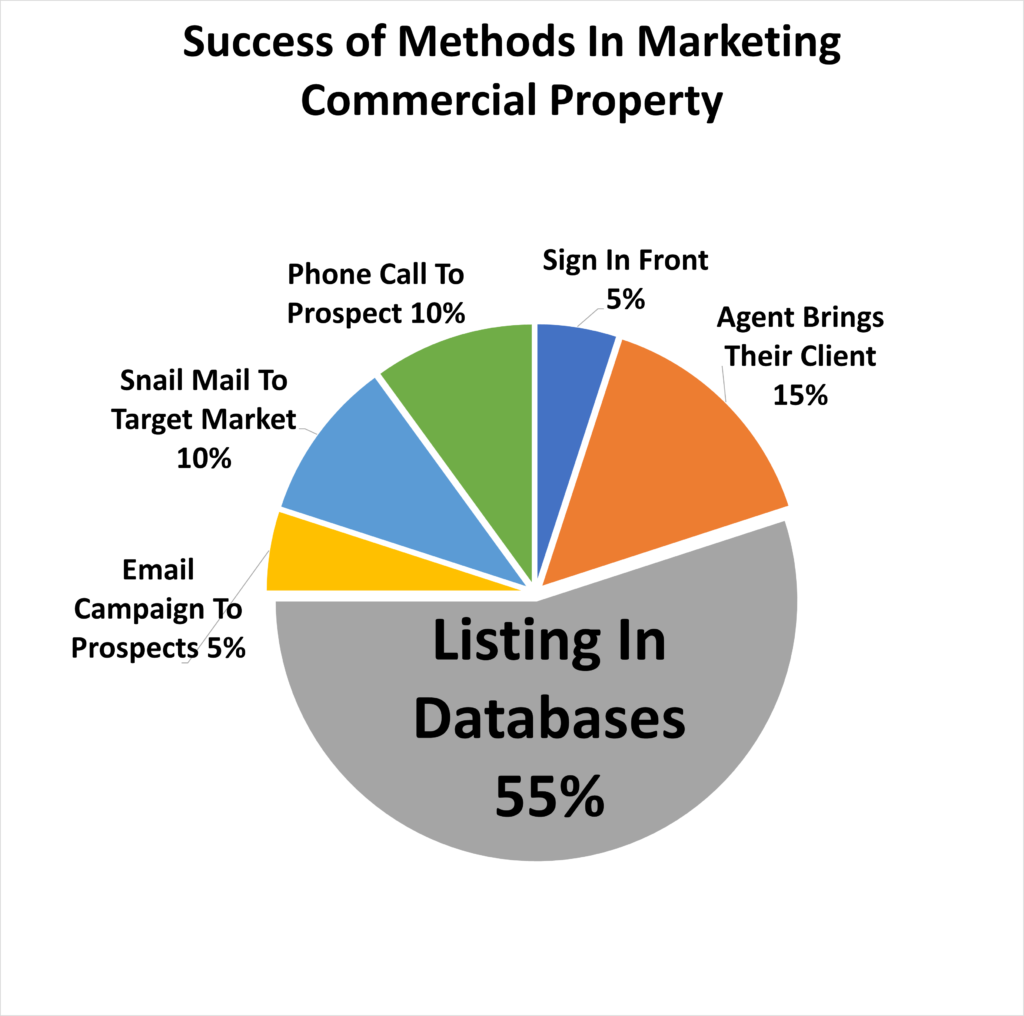
The pie chart above shows the 6 common ways, called marketing channels, that agents can sell or lease commercial property, and the highest estimate is that 55% of prospects are found using commercial databases. In Louisiana there are 3 commercial databases, each having its own reach and costs ranging from $1,000 to $30,000 annually. Here is a deep dive into each database and its strengths.
LACDB
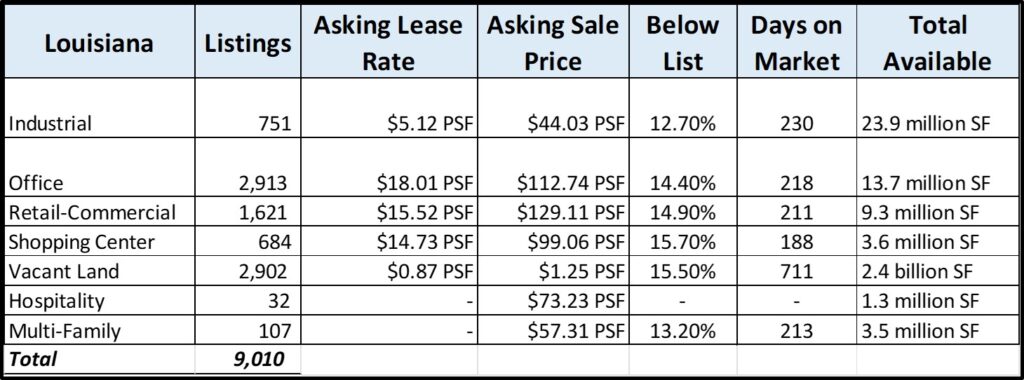
The Louisiana Commercial Database (LACDB.com) reaches 1,500 commercial agent members in Louisiana who post 8,539 listings, with 4,007 properties for sale and 4,532 for lease. The database also has 314 commercial listings in Mississippi, with 187 for sale and 127 for lease. There are free email blasts to promote properties to agents, limited to one daily but unlimited blasts to clients. LACDB uses Catylist as their software provider plus you have access to a national database called Commercial Exchange which gives you wider distribution. Costs for subscribing to the database are $720 annually and agents can add SiteLink to have their listings automatically populate their website for an additional $800 annually. Agents do not have to be a member of the National Association of Realtors before they can subscribe to the database which reaches mostly Louisiana and Mississippi agents and brokers because subscriptions are the least expensive. LACDB offers market statistics showing the average sale or lease price and days on the market in each of the major categories: office, industrial, retail, shopping centers, hospitality and multi-family.
MSCREX
Mississippi Commercial Real Estate Exchange has 106 members who are commercial real estate agents and brokers, with 1,284 listings divided into 680 for sale and 604 for lease. The cost is $720 annually, up from $600, to subscribe to the database which allows you to post listings but it is owned by the Mississippi Association of Realtors, so membership in the National Association of Realtors and Mississippi Association of Realtors is required, increasing the cost an additional $454 annually. MSCREX uses the Commercial Exchange platform which is owned by Moody's, so listings here get regional exposure for tenants and buyers seeking property, but listings only get in front of 106 members in Mississippi.
LOOPNET
Loopnet.com has 1,100,000 properties listed by 300,000 commercial agents nationwide. The marketplace gets 11,000,000 unique visitors monthly. For its massive size, Loopnet.com only has 656 listings for sale and 368 for lease in Louisiana, and in Mississippi has 788 for lease and 726 for lease.
This database brings in tenants and investors both locally and nationwide because Loopnet was purchased by CoStar recently, giving it national exposure; however, not everyone can see a listing on Loopnet. Agents can post listings without paying to be a Loopnet subscriber, but those listings are marked as Basic which are not shown to anyone except paid CoStar subscribers and very few agents subscribe to CoStar because they require everyone licensed under a Broker name to pay. It gets very expensive and just not feasible for most listings.
Loopnet offers 4 platforms: Basic (free), Silver ($5,000 annually for 4 listings and 10 listings for $8,400 annually), Gold ($8,400 annually for 4 listings), Platinum ($14,000 annually for 4 listings) and Diamond ($30,000 annually for 7 listings). The Diamond level offers:
Higher exposure and a dedicated marketing specialist.
Targeted digital marketing strategy that keeps your property front and center across the web through retargeting.
Professional architectural imagery, videography and 3D tours.
CREXI
CREXI Database Has Almost 10,000 Listings In Louisiana & Mississippi
CREXI.com has 1 million commercial real estate agent subscribers but an average 2 million buyers, brokers, and tenants each month exploring over $2 trillion of property value nationwide. Crexi has 2,367 properties in Mississippi for sale and 1,212 for lease, and 2,771 for sale in Louisiana and 3,587 for sale. Crexi Pro cost $4,800 annually for unlimited listings.
Summary
The Highest Number Of Listings Are Posted By The Database With The Fewest Agents
In utilizing a database to reach tenants and commercial agents directly, not all databases are the same. Most local agents who can bring tenants and buyers to a listing subscribe to LACDB.com since it is the most affordable. LACDB only reaches 1,500 agents so, in the chart above, their agent count column is barely visible when compared to the other databases; however, those are the local agents who often have qualified tenants and buyers as their clients and are seriously looking for property in Louisiana and Mississippi.
CREXI is a fairly new database but already has almost as many Louisiana and Mississippi listings as LACDB plus provides a national reach with 1,000,000 agents and investors as subscribers. Loopnet recently merged with CoStar and anything other than a Basic listing gets Louisiana and Mississippi property in front of prospective tenants and buyers nationally. If your property is above average in size, you may not find tenants or buyers easily because the Louisiana/Mississippi economy no longer drives large companies to the area. If you need to reach larger markets such as Houston, Dallas, Nashville or Miami, the Crexi database is for you.
Currently a Louisiana licensed real estate agent can transact business in both residential and commercial real estate, even though agents are not required to be trained in even the basics of commercial property. All agent licenses must be issued by the Real Estate Commission. Agents are independent contractors, not employees, and the license is always held by a broker not the agent themself. The broker can void the license at any time for any reason, leaving the agent unable to practice any real estate business.
No Training for Residential Agents By Their Broker In Commercial Real Estate
Despite the power and responsibility a real estate broker has for their agents, no broker currently trains their agents in even the basics of commercial real estate. Brokers have lots of regulations dictated by the Real Estate Commission, but training in commercial real estate is not required. Since commercial real estate is vastly different from residential real estate, the result is a disaster. When the residential agent who is inexperienced in commercial real estate tries to transact business in the commercial arena, they usually end up harming their client by allowing a faulty contract or paying too much or suffering a difficult transaction which most likely fails to happen. It doesn't have to be that way and Louisiana Commercial Realty is working to change that.
What Other States Require Training In Commercial Real Estate?
None. In promoting residential agent training in commercial real estate, the question always comes up: why doesn't the Louisiana Real Estate Commission require a commercial license? This leads to another question: what other states require a separate real estate license for commercial transactions? So we contacted all 50 states and the answer is: none. No other state requires a separate commercial real estate license. Louisiana would have to be the first.
98% of Residential Agents Want Training In Commercial Real Estate
We polled all 20,000 Louisiana licensed real estate agents to determine if demand exists for basic training in helping clients with their commercial property needs. This includes buying, selling or leasing office, warehouse, apartments, retail, restaurants or hotels. Of the residential agents who responded to the survey, 98% said they would be interested in commercial training, and 50% had already completed at least one commercial transaction within the last 2 years.
Training In Basic Commercial Real Estate Did Not Exist, So We Created It
Louisiana Commercial Realty utilized their 20 years of experience in both commercial property management and also leasing to create a 2 hour workshop specifically for residential agents. We already made progress and presented the workshop to the Real Estate Commission and the Louisiana Association of Realtors, and also to Berkshire Hathaway agents who mostly transacted residential business.
How It's Done
Our workshop details all aspects of a commercial real estate transaction and teaches residential agents how to successfully navigate the nuances of commercial real estate.
Chapters of our workshop teach real estate agents what they need to know about the 6 major types of commercial property to help their clients. The core focus dives deep into the driving factors for buyers, sellers, landlords and tenants. Each of these 4 stakeholders has a different objective so a commercial real estate agent must quarterback all the various entities and tactfully guide the decision-makers, government authorities, bankers, appraisers and property owners, who often conflict when interacting with each other.
Technologically Proficient
Commercial real estate agents need to be proficient in using technology to solve their client's problems. One example is how residential agents can help a retail client determine the best location for their business. Normally, residential agents only know how to provide demographics that include population, income and age, but finding successful locations requires knowledge about how residents spend their money in nearby businesses.
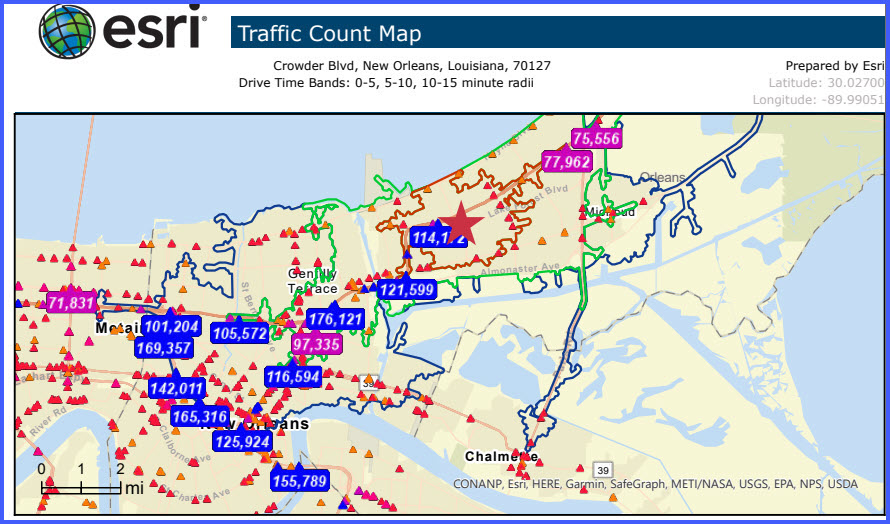
For example, our research for a listing at 5501 Crowder in New Orleans showed within a 5 minute drive time that residents spent $5,591,611 on sporting goods-but there is no sporting goods store in the area. That means residents are traveling outside the area to spend their money; therefore, a sporting goods store in that location would do very well.
This research helps residential agents discuss with sellers and landlords how they will go about finding buyers and tenants. It also helps residential agents show prospective tenants that their business, such as a sporting goods store, can capture $5,591,611 of revenues from day one. This information is easily available but few residential agents know how to access and utilize it. We show them how.
Determining Value
One of the most elusive chapters in the "how to" workshop is valuing commercial real estate. We spent years writing appraisals for two of the top firms in New Orleans: Truax & Robles Appraisers and also Argote & Derbes, so we understand appraisals are meant for a bank committee to justify loaning money but should not be used as a realistic price at which a commercial property can be sold.
If commercial properties produce rent income, the best method of determining market price is to apply a Capitalization Rate to the Net Operating Income. For example, if a property produces $85,000 in income (revenues less expenses) you would divide that by a 7% Capitalization Rate. This means a buyer should, at most, be willing to pay $1.2 million for that commercial property.
Summary
The current absence of training harms the general public and fails the licensed real estate agent. We hope to play a small part in changing that by providing training for agents who dabble in commercial transactions but mostly make their living from residential transactions. If this idea is of interest to you, just contact us today to schedule a free commercial real estate training session.
If you would like more information on the technology available for commercial real estate, we have hundreds of articles on the commercial real estate industry, including popular topics such as prices, zoning, reading flood maps and inflation. Check out two of our popular blogs:
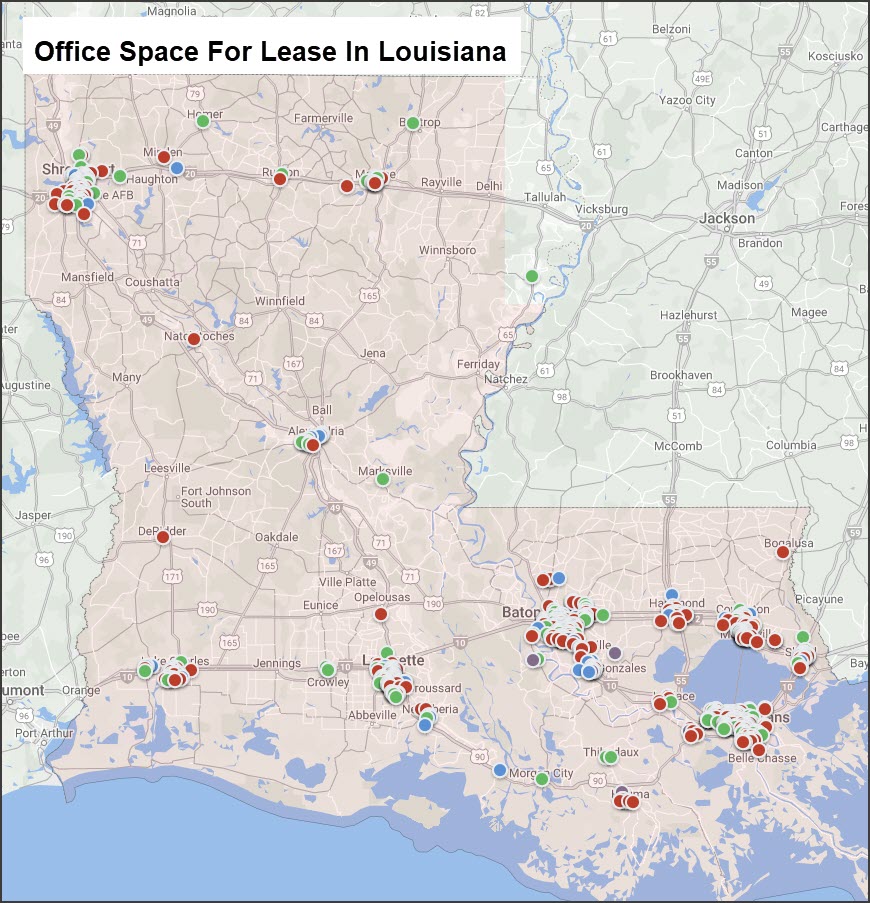
We examined the 2,723 office spaces for lease in Louisiana totaling 8,700,000 square feet, and calculated the average listing to be 4,150 square feet priced at $18.76 per square foot. But that doesn’t tell the whole story. Office space can be priced nine different ways, ranging from Triple Net, which adds on operating expenses, to Full Service which is priced to include electricity, water, taxes, insurance, janitorial and even landscaping. This article takes a deep dive into today's prices of office space across the entire state, including how prices are quoted and who the agents are that lease the most office space.
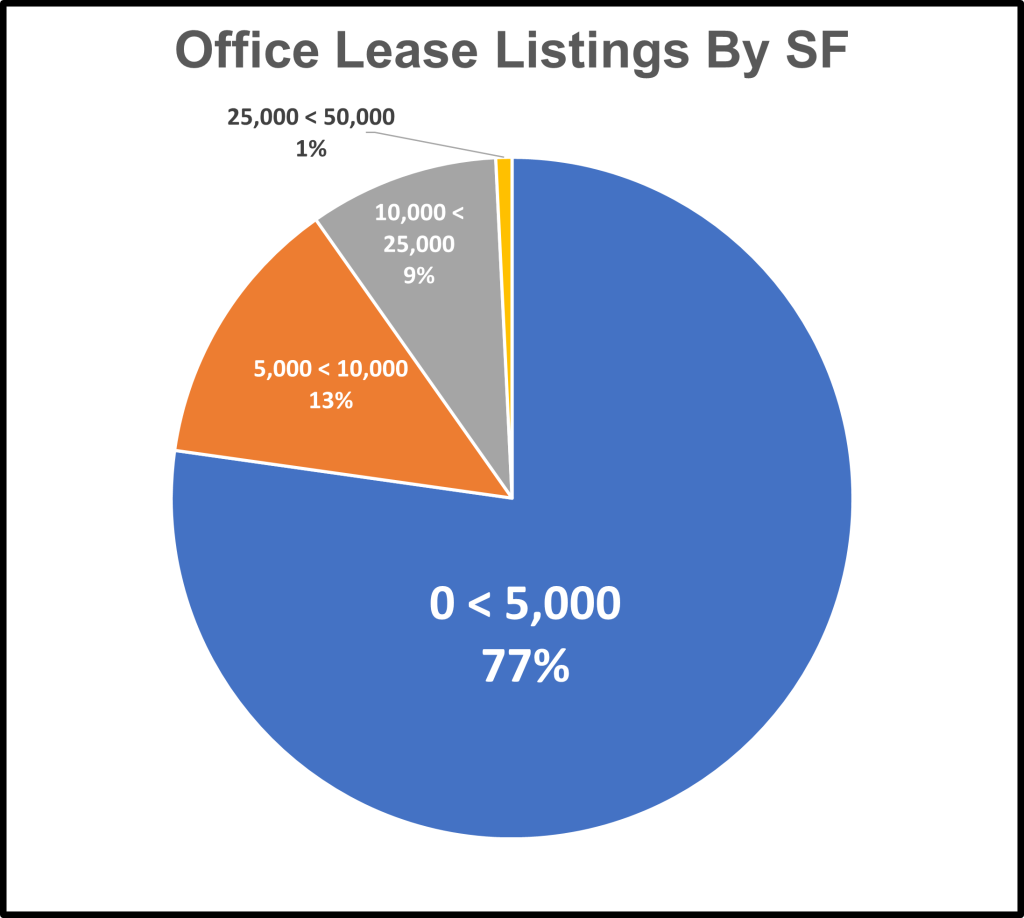
Only 1% of Office Space For Lease Exceeds 25,000 SF In Size
77% of the Louisiana office space is under 5,000 SF in size
Of the 2,723 office spaces for lease in Louisiana, approximately 1,600 spaces with 77% of the square footage are under 5,000 square feet in size. Only 10% of the spaces exceed 10,000 square feet and only 1% exceed 25,000 square feet. This small size office market is a reflection of the types of businesses in Louisiana which has a lack of corporate headquarters and major corporations which need large office spaces.
Prices Depend On Pricing Type
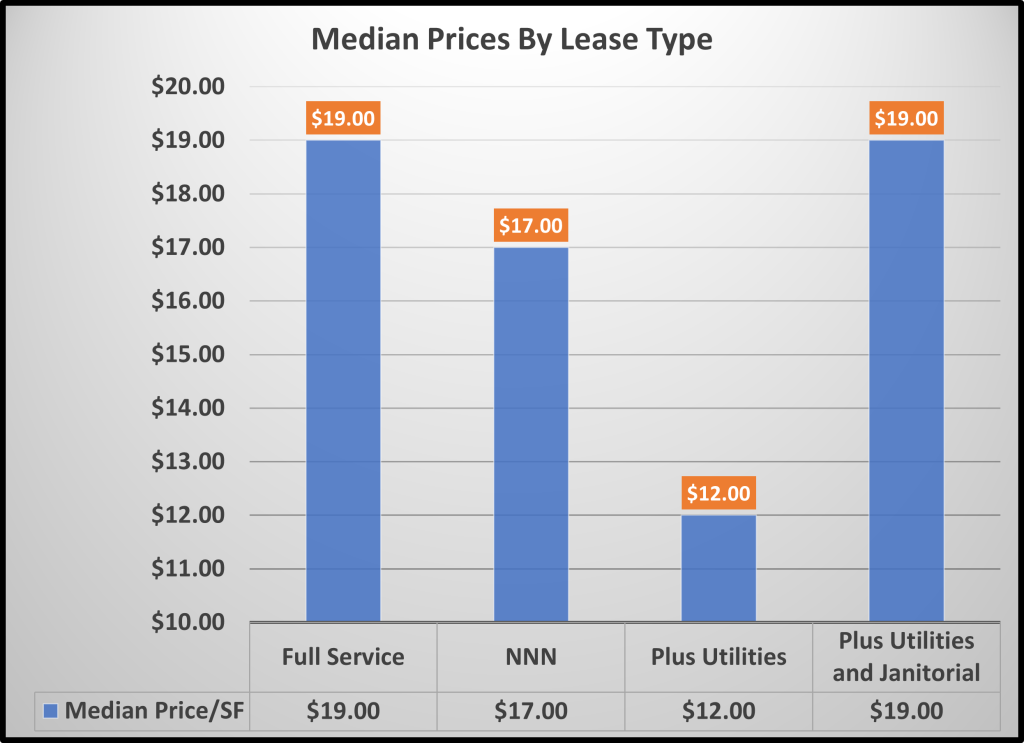
The average Full Service office space is priced at $19/SF
Pricing office space for lease comes in a variety of terms, and the fine points of these terms usually get negotiated during the lease review stage. Here are the major types of office lease pricing we discovered:
Full Service (also known as Gross)-the price quoted includes the base rent plus all other common operating expenses. The landlord pays all costs of electricity, water, property taxes, property management fees, landscaping and hazard insurance.
Modified Gross-includes a base rate and only a few operating expenses are passed along to the tenant. This pricing type usually adds on electricity and water, which are charged to the tenant since most office buildings do not have separate water or electrical meters for each space. The total cost is allocated to each tenant based on the square footage, and is called “additional rent” in a lease. The pro-rata costs are estimated and billed monthly, but reconciled at the end of the year when the true operating costs are known.
Triple Net-Quoted as a base rate but adds on all operating expenses, called common area maintenance, which are passed along separately to the tenant. There may be language in a lease that allows a stop on separate controllable operating expenses versus uncontrollable operating expenses such as property taxes and hazard insurance. The stop would place a cap on the percent increase of expenses that is paid.
We examined 2,723 office spaces for lease in Louisiana and found a range of rates from Full Service to Triple Net (NNN), but also a variety of both. Notice in the table that the quoted Full Service rate of $19 per square foot equals the same as the quoted NNN rate plus utilities and janitorial. This means there may be some additional expenses added that are called utilities but are not. The lowest rate of $12 per square foot plus utilities can be deceiving, since electricity cost can easily average $3 per square foot, water $1 per square foot and janitorial averages $2 per square foot.
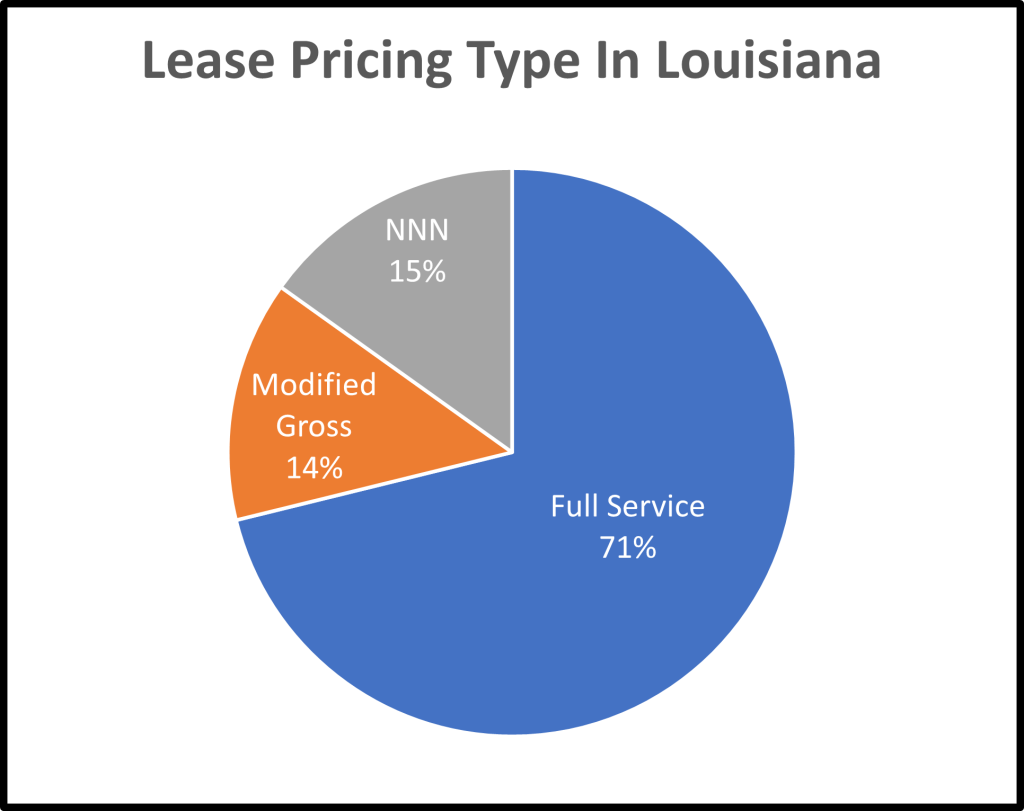
Majority of Listings Are Priced As Full Service
71% of all Louisiana office square footage is quoted as Full Service
Most office space for lease in Louisiana (71% as measured by sector square footage) is priced as Full Service, which includes all expenses except parking. Modified Gross and Triple Net pricing totals 29% of all listed square footage. One reason may be that the majority of office space for lease is in high rise office towers which are always priced as Full Service. The Triple Net pricing is usually associated with suburban locations and older, less attractive, properties, so they quote lower rates but attempt to pass along operating expenses to tenants.
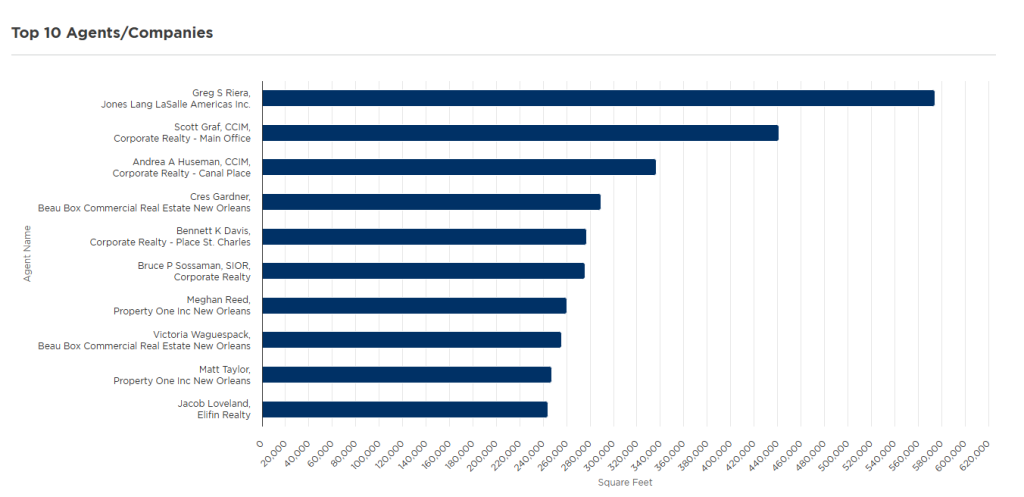
Who Are The Agents Representing The Most Office Space For Lease?
Source: LACDB/Moody's
While Cres Gardner with Beau Box has the most listings at 65, Greg Riera with national Jones Lang LaSalle is the top agent with 574,521 square feet listed, all in downtown office towers that were hit hard by COVID so they have lots of vacant space.
Summary
In summary, the office market in Louisiana is unique. Despite having millions of vacant square feet in downtown office towers, prices quoted have so far remained high as if strong demand for office space still existed. Often the actual lease price is negotiated down and includes some hidden buildout allowances. Full Service office space is about 71% of the 8,700,000 square foot market with an average list price of $19 per square foot, and 77% of the office space for lease is small at 4,150 square feet.
For more information on commercial property prices, read our articles:
Got commercial property to sell? It will not only take much longer than you think but will bring you insurmountable obstacles along the way. Here is how we get it done.
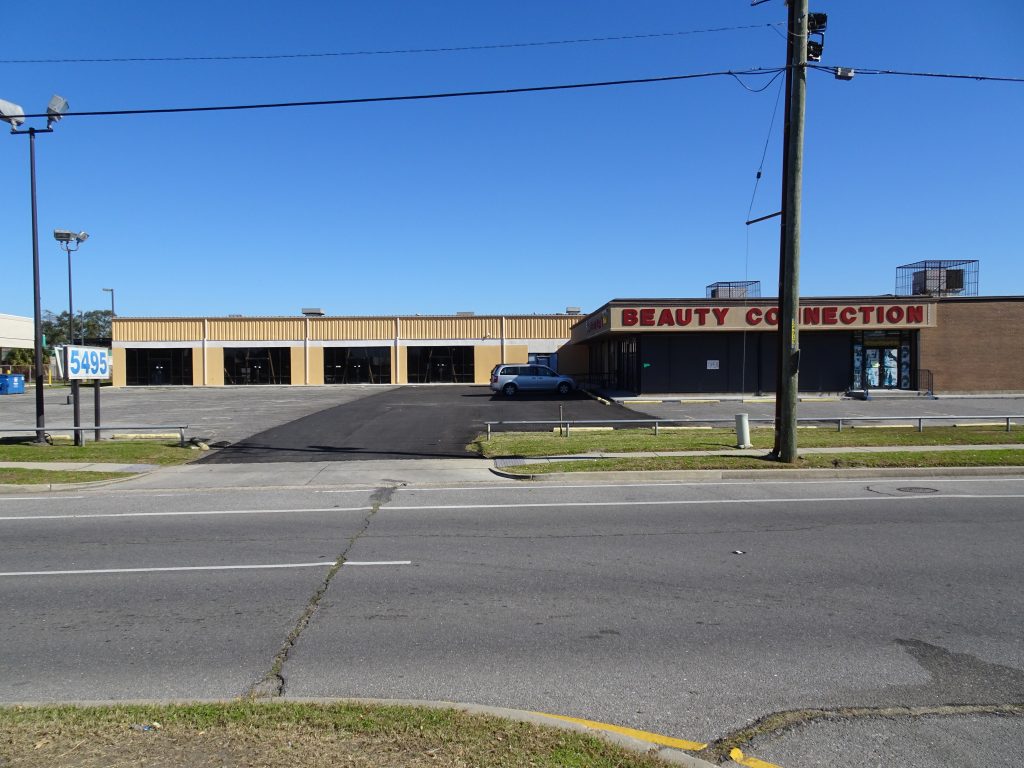
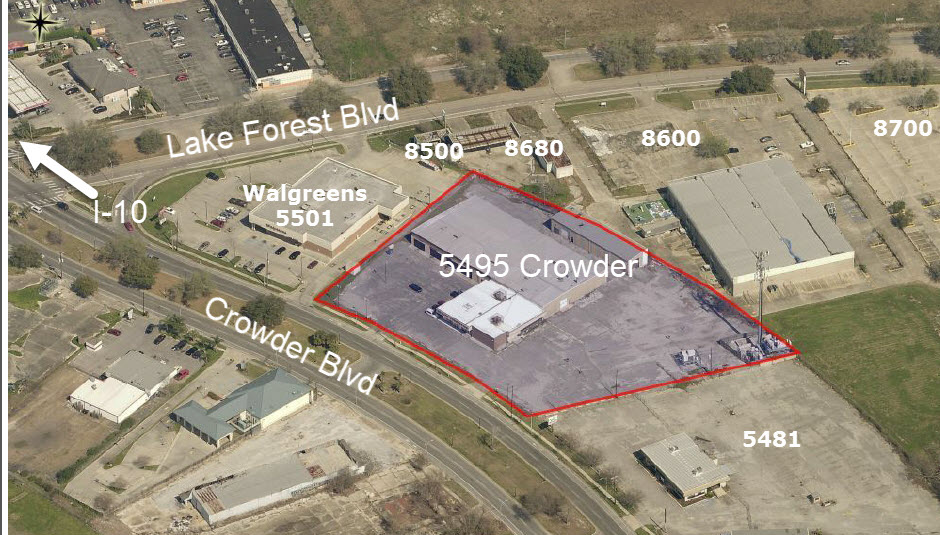
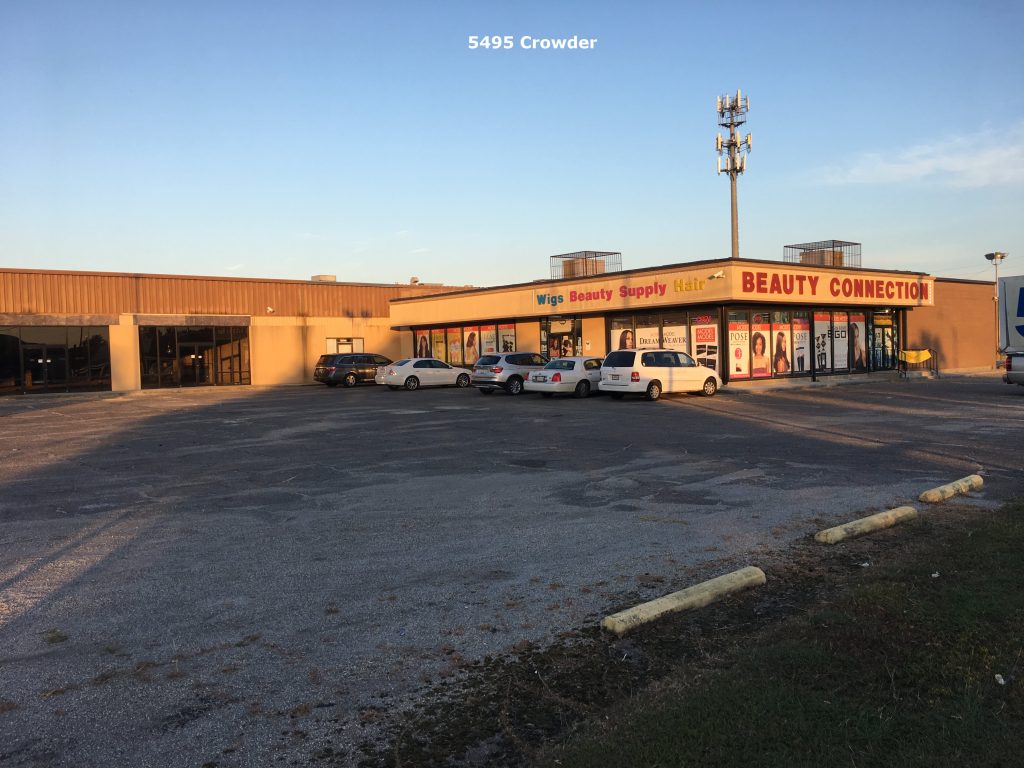
Beauty Connection tenant at 5495 Crowder Boulevard
Louisiana’s economy is not booming like Texas or Florida. Even Alabama is thriving. Louisiana is a great place to live with a fascinating culture but a difficult environment to get business done. That means selling commercial property in Louisiana takes longer than most owners can imagine and will involve overcoming lots of obstacles. The average time to lease or sell commercial property anywhere is the state is 212 days. That is why when selling commercial property, you have to be careful with whom you do business. This article explains how commercial property gets sold and what to look out for.
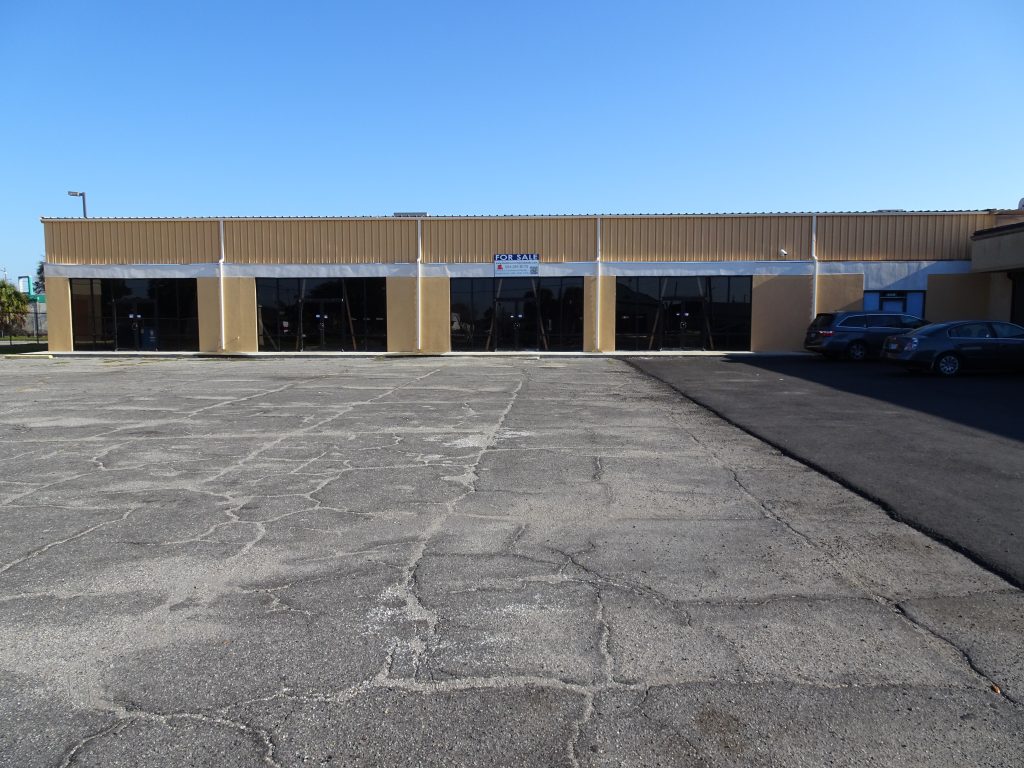
5495 Crowder is a 24,000 SF building on 2.2 paved acres
The story that encompasses all the aspects of selling commercial property is 5495 Crowder Boulevard in New Orleans East. I listed the property in 2016 for $1,150,000. It is a 9,000 square foot beauty supply store that brings in $7,000 monthly rent, surrounded by 15,000 square feet of vacant shell high eave retail and warehouse space, on 2.8 acres of paved parking. The property is near the I-10 exit which has 100,000 cars per day pass by.
Traffic Count at I-10 & Crowder is 114,000 Cars Per Day
After heavily advertising the property in LACDB, LoopNet, Crexi and Google Ads, we received 4 offers, ranging from $550,000 to $1,050,000. The highest offer was financed by First NBC Bank in New Orleans. The buyer had an offer from FNBC to finance 100% of the loan, but during the inspection period, the bank was declared insolvent and was the largest U.S. bank failure of the decade. The deal was off.
Code Enforcement Hearing
The property received lots of interest, despite the New Orleans East location stigma, and the next year, the property received an offer of $700,000 from a nearby church, which the seller declined. The property also received a hearing notice from New Orleans Code Enforcement which stated violations regarding signage and a visible dumpster. I attended the hearing with the seller, since he did not speak fluent English.
The hearing was led by two code enforcement officers in a small room. The officers refused to let me answer questions for the seller even though English was not his primary language. We asked for an explanation of what areas of the property were violating the code but the officer replied, “just give the list to your contractor-he will know”. They were rude and abusive to the property owner. Still not allowing me to talk, they replied, “If you sell your property within the next 30 days, you won’t have these problems”. They then cut the meeting short and explained that they have other cases. Later, we talked with Chad Dyer, the Code Enforcement Director, who explained that all they wanted was for the owner to build an enclosure around the dumpster and remove signs from the windows.
2019
Beauty Connection Tenant Pays $7,000 Monthly Rent ($10/SF)
Two years after that, in 2019, the property received an offer of $1,000,000 from a developer to build a trampoline/entertainment facility. The pro forma showed the project would generate $200,000 net cash flow within 12 months. This was a brilliant idea from a bold developer and would bring a much needed service to the nearby residents. During the inspection period the seller changed his mind after discussing with his wife and they decided not to sell. They wanted to keep the $7,000 monthly income from the tenant and live off that in their retirement. Then in August 2021, category 4 Hurricane Ida hit the property, causing damage requiring one section of roof to be replaced. The owner lived out of state and realized it is stressful managing commercial property when you live elsewhere.
2024
Four 2,500 SF Retail Spaces Need Buildout But Bring $100,000 Rent Annually
In 2024, a developer from Georgia, looking to buy property for a truck stop, offered $795,000, but now the tenant no longer wanted to move. Since 2016 the 9,000 square foot beauty supply tenant told the landlord that he wanted to retire because business was not profitable. Upon receiving the only offer in years, the owner stated the tenant now wanted to stay because business was good and seller felt the tenant was “like a son to him”. Normally, no developer would purchase a property with the disadvantage of having the build around an existing tenant, but we negotiated with tenant, seller and buyer, and were able to reach an agreement, drafting a lease between buyer and tenant that would be effective upon sale.
Unable To Get Bank Financing
After successfully negotiating an agreement between both buyer and seller with a 45 day inspection period, we introduced the seller to two local bankers who processed the loan applications. After the inspection period passed, the seller disclosed he was unable to obtain financing from either bank. We then negotiated owner financing for 5 years at a 7% rate with 40% down, and proceeded to a successful closing.
Summary
In summary, finding a buyer for commercial property in Louisiana takes several months of tactful negotiations. This is why having an expert handle the transaction is vital. Personalities can get in the way, causing transactions that could be successful to fall apart at the drop of a hat. Experienced real estate agents can often find solutions to fragile situations and bring about a successful outcome where all parties are happy.
Surprising Facts About New Orleans East
In researching what businesses would do well in the location, we compiled all our information into a publication, “Feasibility of Developments In New Orleans East” which we presented to city council and hosted a television panel at WWL. Our research will surprise you. New Orleans East, despite the stigma, has areas that are thriving. It is the largest area in New Orleans, with 70,000 residents. About half own their own home, and the last 5 years, the population grew faster than Orleans and Jefferson Parishes.
Population Growth Rate In New Orleans East Since 2018
Retail Marketplace Profile Report
Despite the stigma New Orleans East suffers from the closing of Lake Forest Shopping Center, New Orleans East residents have money to spend. Our research helps businesses determine the perfect location, based on how nearby residents spend their money. The Retail Marketplace Profile shows demand and supply by industry, with the difference resulting in a gap which is the unmet revenues from businesses not in the area. The report shows the number of businesses providing that product in the area, and the Retail Gap is the size of the unmet market demand.
Retail Marketplace Profile Report Shows What Businesses Will Thrive
The table shows the top 10 businesses needed in the area, culled from the previous leakage table. The Retail Gap is the forecasted sales. For example, there is a Retail Gap of $29,480,973 in the grocery store industry. Currently there is $82,656,869 spent in grocery stores, but only $53,175,896 in sales in grocery stores within the area. That means the difference, $29,480,973, is spent outside the area. Therefore, the forecast in revenues for a grocery store opening up within the area would be $29,480,973.
The Future Of New Orleans East
Recently, Wal Mart has come into the area, Lowes has closed but the property was purchased by Goodwill who will convert the building into a warehouse/retail facility. LCMC opened the area’s major hospital, with 120 physicians on staff. If you are looking to grow your retail business, contact us for a free Retail Marketplace Report.
For more information on commercial real estate, catch our articles:
There are 22,544 real estate agent stories in the naked city. This is one of them. We've virtually hired James Franciscus to narrate the story and give insight to the Louisiana real estate industry, ranging from what city has the most agents to how long have most agents been licensed and how was the industry affected by Covid.
How Many Years Have You Been An Agent
The oldest living Louisiana real estate agent was licensed in 1950, and only 37 joined during the next 20 years. Licensing then took off, doubled in 1970, then tripled by 1971, just in time for the nastiest recession ever from 1973 to 1975 when OPEC made oil prices increase four-fold, unemployment rose from 4% to 9%, and mortgage rates rose from 7% to 18% the next 8 years.
Covid Was Good For Real Estate Licensing
The first case of Covid was January 20, 2020, in Washington state, but real estate licensing in Louisiana skyrocketed by 6700 people, or 30 percent, during the next two years. Covid was good to real estate agent licensing. The Louisiana Real Estate Commission received $1.7 million from license fees, plus if you wanted to post your listings you had to join the National Association of Realtors, which Louisiana agents paid $1.3 million, and if you wanted to post commercial listings, you had to pay $720 to LACDB or MLS listing fees of $1,270 which included $59 to lobby politicians.
50 Agents in California Licensed in Louisiana
Louisiana real estate agents live all over the U.S., with 50 real estate agents in California to 138 agents in Florida, totaling 1,403 Louisiana licensed agents that do not live in Louisiana.
Louisiana Real Estate License Types
The 16,185 Louisiana licensees the Real Estate Commission calls salespeople are managed by 2,815 brokers in 238 branches. There are still 81 time share developers with Louisiana real estate licenses.
Over 50 percent of Louisiana real estate licensees live in 3 cities: New Orleans, Baton Rouge and Metairie.
Last But Not Least: Which Firm Is The Biggest?
Latter & Blum is the biggest, of course. Real estate companies are called Supervisors by the Real Estate Commission, and Latter & Blum controls 7.8 percent of the market. The top 2 percent of real estate companies control 50 percent of the market.
Normally when people in New Orleans ask if an area floods they are talking about heavy rains causing water to pool in the streets until the city pumps can suck the water down the drains and into the Mississippi River, but since Hurricane Katrina caused the levees to fail and flood the city with water from Lake Pontchartrain, people now include the risk of levees failing when discussing flooding and debate whether the $14 billion dollar new levee system will save us all. This article explains the various flood zones and provides step-by-step guidance on how to read a flood map and create your own flood map for any location.
Protecting residents from the financial loss due to flooding, no matter whether it is from heavy rains or levee breaches, dates back to 1968 when Congress created the National Flood Insurance Program, giving the responsibility to the Federal Emergency Management Agency (FEMA) for producing Flood Insurance Rate Maps that show areas subject to flooding based on historic, meteorological and hydrologic data.
What’s In a Flood Map?
The Flood Map provides information that allows you to identify not only Special Flood Hazard Areas but the Base Flood Elevation at a specific site, as well as areas of undeveloped coastal barriers where flood insurance is not available.
Flood Maps provide a wealth of information, including:
Common physical features, such as major highways, secondary roads, lakes, railroads, streams, and other waterways.
Special Flood Hazard Areas.
Base Flood Elevation.
Flood Insurance Risk Zones.
Areas subject to inundation by the 500-year flood.
100-Year Flood Zone Is Really a 26 % Chance
A 100-year flood is not a flood that occurs every 100 years, but one that has a 26 percent chance of occurring during a 30-year period, the length of many mortgages. The 100-year flood is a regulatory standard used by Federal agencies and most states, to administer floodplain management programs, and is used by the National Flood Insurance Program (NFIP) as the basis for insurance requirements nationwide. Special Flood Hazard Areas (SFHA) are those areas having at least a 1 percent chance of flooding during any one year. Flood Maps are easy to get and are found online at FEMA's Map Service Center.
Create Your Own Flood Map With Just 3 Clicks
Step 1: Finding the Property.
Let's say we want flood zoning information on the Mercedes Benz Superdome in New Orleans, so we enter the address: 1500 Sugar Bowl Dr, New Orleans, LA 70112.
Step 2: Check Interactive Map Choices.
Next, you can select from two options: 1) a Dynamic Map or 2) a Map Image. The easiest is to select the Dynamic Map.
Step 3: Match Your Address To The Legend.
Next, match the color pattern in your flood map to the legend. This legend shows the Superdome is in flood zone X, a minimal risk area. However, the area just across Poydras Street is flood zone AE, a high risk area.
The map is dated 9/30/2016 and each map has a number, called a panel. This map is panel 22071C0229F.
Optional: Select Map Image
In addition to selecting a dynamic map, you can select to download the map image of a FIRM Panel. This produces a zip folder with 3 files, a pdf read me, a tif image and a tfw file which allows the image to be viewed in a GIS application.
The tif formatted image can be a higher resolution showing more detail but the file size is 10 times larger which causes download problems.
Explanation of Flood Zone Designations
Zone A: This zone has a low risk of erosion and can experience breaking waves less than 1.5 feet. No base flood elevations are calculated.
Coastal Zone A: This zone is subject to erosion, fast and strong water movement, and wave heights of 1.5 to 3 feet during storm events. Base flood elevations are calculated for these zones and displayed on flood maps. Communities have the option of adopting more stringent building codes (up to V Zone standards) in this zone, which would give them points in the Community Rating System. This zone is relatively new, so it may not be applicable to your community’s current flood maps. On the new maps, the landward edge of the zone is marked by the LiMWA line (Line of Moderate Wave Action). An elevation certificate is required to accurately calculate insurance rates in this zone.
High Risk (Special Flood Hazard Area)
These zones make up the Special Flood Hazard Area and are in the 100-year-flood zone. They have at least a 1% chance of flooding each year and at least a 26% chance of flooding over the lifetime of a 30-year mortgage. Structures located in these zones with a federally-backed mortgage are required to purchase flood insurance. On a flood map these zones are referred to as the letters below or, collectively, as the 1% annual chance or 100-year-flood zone.
Zone AE or Zone A1-30: This zone has a low risk of erosion and can experience breaking waves less than 1.5 feet. Base flood elevations are calculated and displayed on flood maps. AE zones are present on newer maps; zones A1-30 are present on older maps. An elevation certificate is required to accurately calculate insurance rates in these zones.
Zones AH, AO, AR, A99: The flood insurance rate zone that corresponds to areas of the 100-year floodplains that will be protected by a Federal flood protection system where construction has reached specified statutory milestones. No Base Flood Elevations or depths are shown within this zone. Mandatory flood insurance purchase requirements apply.
Zone V: This zone faces an additional hazard from erosion, fast and strong water movement, and waves that may be 3 feet or greater during storm events.
Zone VE or V1-V30: These zones face an additional hazard from storm waves, and can experience waves greater than 3 feet. Base flood elevations are calculated for these zones and displayed on flood maps. VE zones are present on newer maps; zones V1-30 are present on older maps. An elevation certificate is required to accurately calculate insurance rates in these zones.
Moderate Risk
Zone X (shaded) and Zone B: The area between the extent of the 100-year-flood (1% annual chance flood) and the 500-year-flood (0.2% annual chance flood). There is no base flood elevation calculated for these zones, so elevation certificates are not necessary. Flood insurance could be much cheaper in these zones because of the lower risk. These areas are not subject to the mandatory purchase of flood insurance.
Minimal Risk
Zone X (unshaded) and Zone C: The area outside of the extent of the 500-year-flood with minimal flood risk. If a structure is located in this zone, however, it does not mean that it is out of harm’s way. The risk determination is based on probability, and the probability of a flood reaching this area is low, but it is not impossible. There is no base flood elevation calculated for these zones, so elevation certificates are not necessary. Flood insurance could be as much as 50% cheaper in these zones because of the lower risk. These areas are not subject to the mandatory purchase of flood insurance.
Undetermined Risk
Zone D: Areas classified as Zone D have not had a flood hazard analysis performed. These are often areas with very low population counts.
Flood Map Glossary Terms
1-percent annual chance floodplain
This is the boundary of the flood that has a 1-percent chance of being equaled or exceeded in any given year. Also known as the 100-year floodplain.
1-percent annual chance water-surface elevation
The height, in relation to the National Geodetic Vertical Datum of 1929 (or other datum, where specified), of the flood having a 1-percent chance of being equaled or exceeded in any given flood year (also known as the 100-year flood or the base flood).
100-year flood
The flood having a 1-percent chance of being equaled or exceeded in any given year; also known as the base flood. The 1-percent annual chance flood, which is the standard used by most Federal and state agencies, is used by the National Flood Insurance Program (NFIP) as the standard for floodplain management and to determine the need for flood insurance. A structure located within a special flood hazard area shown on an NFIP map has a 26 percent chance of suffering flood damage during the term of a 30-year mortgage.
100-year floodplain
This is the boundary of the flood that has a 1-percent chance of being equaled or exceeded in any given year. Officially termed the 1-percent annual chance floodplain.
500-year floodplain
This is the boundary of the flood that has a 0.2-percent chance of being equaled or exceeded in any given year. Officially termed the 0.2-percent annual chance floodplain.
Base Flood Elevation (BFE)
The height of the base flood, usually in feet, in relation to the National Geodetic Vertical Datum of 1929, the North American Vertical Datum of 1988, or other datum referenced in the Flood Insurance Study report, or depth of the base flood, usually in feet, above the ground surface.
Datum
A fixed starting point of a scale.
Federal Emergency Management Agency (FEMA)
An independent agency of the Federal government, founded in 1979, which reports directly to the President. FEMA is responsible for identifying and mitigating natural and man-made hazards. The agency's mission is: to reduce loss of life and property and protect our nation's critical infrastructure from all types of hazards through a comprehensive, risk- based, emergency management program of mitigation, preparedness, response and recovery.
Flood
A general and temporary condition of partial or complete inundation of normally dry land areas. For flood insurance claim purposes, two or more structures must be inundated before flood damage will be covered.
Flood Boundary Floodway Map (FBFM)
A pre-Map Initiatives floodplain management map that delineates the 100-year (1% annual chance) and 500-year (0.2% annual chance) floodplains, floodway, and cross sections.
Flood Insurance Rate Map (FIRM)
A map on which the 100-year (1% annual chance) and 500-year (0.2% annual chance) floodplains, Base Flood Elevations, and risk premium zones (and floodway information on Map Initiatives FIRMs) are delineated to enable insurance agents to issue accurate flood insurance policies to homeowners in communities participating in the National Flood Insurance Program.
Special Flood Hazard Area (SFHA)
Area inundated by the base (1-percent annual chance) flood, identified on the Flood Insurance Rate Map as Zones A, AE, AH, AO, AR, V, VE, or A99.
Elevation
The height, in relation to the National Geodetic Vertical Datum of 1929 (or other datum, where specified) of floods of various magnitudes and frequencies in the identified floodplains of coastal or riverine areas.
Flood zones are geographic areas that the FEMA has defined according to varying levels of flood risk. These zones are depicted on a community's Flood Insurance Rate Map (FIRM) or Flood Hazard Boundary Map. Each zone reflects the severity or type of flooding in the area.
Moderate to Low Risk Areas
In communities that participate in the NFIP, flood insurance is available to all property owners and renters in these zones:
Zone B and X (shaded)
Area of moderate flood hazard, usually the area between the limits of the 100-year and 500-year floods. Are also used to designate base floodplains of lesser hazards, such as areas protected by levees from 100-year flood, or shallow flooding areas with average depths of less than one foot or drainage areas less than 1 square mile.
Zone C and X (unshaded)
Area of minimal flood hazard, usually depicted on FIRMs as above the 500-year flood level.
High Risk Areas
In communities that participate in the NFIP, mandatory flood insurance purchase requirements apply to all of these zones:
Zone A
Areas with a 1% annual chance of flooding and a 26% chance of flooding over the life of a 30-year mortgage. Because detailed analyses are not performed for such areas; no depths or base flood elevations are shown within these zones.
Zone AE
The base floodplain where base flood elevations are provided. AE Zones are now used on new format FIRMs instead of A1-A30 Zones.
Zone A1-30
These are known as numbered A Zones (e.g., A7 or A14). This is the base floodplain where the FIRM shows a BFE (old format).
Zone AH
Areas with a 1% annual chance of shallow flooding, usually in the form of a pond, with an average depth ranging from 1 to 3 feet. These areas have a 26% chance of flooding over the life of a 30-year mortgage. Base flood elevations derived from detailed analyses are shown at selected intervals within these zones.
Zone AO
River or stream flood hazard areas, and areas with a 1% or greater chance of shallow flooding each year, usually in the form of sheet flow, with an average depth ranging from 1 to 3 feet. These areas have a 26% chance of flooding over the life of a 30-year mortgage. Average flood depths derived from detailed analyses are shown within these zones.
Zone AR
Areas with a temporarily increased flood risk due to the building or restoration of a flood control system (such as a levee or a dam). Mandatory flood insurance purchase requirements will apply, but rates will not exceed the rates for unnumbered A zones if the structure is built or restored in compliance with Zone AR floodplain management regulations.
Zone A99
Areas with a 1% annual chance of flooding that will be protected by a Federal flood control system where construction has reached specified legal requirements. No depths or base flood elevations are shown within these zones.
High Risk - Coastal Areas
In communities that participate in the NFIP, mandatory flood insurance purchase requirements apply to all of these zones:
Zone V
Coastal areas with a 1% or greater chance of flooding and an additional hazard associated with storm waves. These areas have a 26% chance of flooding over the life of a 30-year mortgage. No base flood elevations are shown within these zones.
Zone VE, V1 - 30
Coastal areas with a 1% or greater chance of flooding and an additional hazard associated with storm waves. These areas have a 26% chance of flooding over the life of a 30-year mortgage. Base flood elevations derived from detailed analyses are shown at selected intervals within these zones.
Undetermined Risk Areas
Zone D
Areas with possible but undetermined flood hazards. No flood hazard analysis has been conducted. Flood insurance rates are commensurate with the uncertainty of the flood risk.
Louisiana Commercial Realty has been working for 15 years to lift the standards of the commercial real estate industry and this week we are presenting an idea to the Louisiana Real Estate Commission to allow a commercial real estate designation. The idea would require the state legislature to pass a law allowing it.
A commercial designation would simply require additional training in the business of commercial real estate. It would not be a license but would set a standard for the 20,000 Louisiana real estate agents who often dabble in commercial listings but have gone without any training from their brokers, the National Association of Realtors or continuing education vendors.
The Problem
Our research shows most of the 9,000 listings for Louisiana commercial property are associated with real estate agents who do not work primarily with commercial property. The result is a disaster. The residential agents get involved with issues for which they have no knowledge, causing problems for buyers, sellers, brokers and tenants. In addition, brokers who hold the real estate licenses for agents do not provide any training for their agents that gives them the knowledge they need to conduct even simple commercial transactions. On top of that, the trade associations that represent the real estate agents do not provide any training on how to conduct commercial property transactions.
The Solution
We have a solution. After 15 years of working in strictly commercial real estate and negotiating hundreds of transactions totaling over $100,000,000, we have created a workshop for real estate agents that gives them the knowledge required to be proficient in securing commercial property clients, managing the transaction, overcoming obstacles and bringing the transaction to a successful completion.
How It's Done
Our idea for a commercial designation that is authorized by the Real Estate Commission is based on a workshop we created specifically for real estate agents. The workshop details all aspects of a commercial real estate transaction and teaches agents how to successfully navigate the nuances of commercial real estate.
Chapters of our workshop teach commercial real estate agents what they need to know about the 6 major types of commercial property. The core focus dives deep into the driving factors for buyers, sellers, landlords and tenants. Each of these 4 stakeholders has a different objective so a commercial real estate agent must quarterback all the various entities and tactfully guide the decision-makers, government authorities, bankers, appraisers and property owners, who often conflict when interacting with each other.
Technologically Proficient
Commercial real estate agents need to be proficient in using technology to solve their client's problems. One example is how agents can help a retail client determine the best location for their business. Normally agents only know how to provide demographics that include population, income and age; however, finding successful locations requires knowledge about how nearby residents spend their money.
For example, our research for a listing at 5501 Crowder in New Orleans showed within a 5 minute drive time that residents spent $5,591,611 on sporting goods-but there is no sporting goods store in the area. That means residents are traveling to outside the area to spend their money; therefore, a sporting goods store in that location would do very well.
This research helps commercial agents discuss with sellers and landlords how they will go about finding buyers and tenants. It also helps agents show prospective tenants that their business, such as a sporting goods store, can capture $5,591,611 of revenues from day one. This information is easily available but few agents know how to access and utilize it. We show them how.
Determining Value
One of the most elusive chapters in the "how to" workshop is valuing commercial real estate. We spent years writing appraisals for two of the top firms in New Orleans: Truax & Robles Appraisers and also Argote & Derbes, so we understand appraisals are meant for a bank committee to justify loaning money but have little to do with a price at which a property can be sold.
The most common method of determining a market price for commercial properties that produce rent income is to apply a Capitalization Rate to the Net Operating Income. For example, if a property produces $85,159 in income (revenues less expenses) you would divide that by a 7% Capitalization Rate. This means a buyer should, at most, be willing to pay $1.2 million for that commercial property.
Summary
We have 20 other chapters in the commercial real estate workshop for agents who want to be proficient in commercial transaction.
We hope our presentation to the Louisiana Real Estate Commission will encourage them to adopt our workshop as a template for authorizing a designation of commercial agent, raising the standards for the practice of commercial real estate in Louisiana and making the 20,000 real estate agents powerfully knowledgeable about commercial property.
If you would like more information on the technology available for commercial real estate, we have hundreds of articles on the commercial real estate industry, including popular topics such as prices, zoning, reading flood maps and inflation. Check out two of our popular blogs:
Just out today: inflation the last 12 months has not gotten worse and at 3.5% is below the 4.0% average for the last 5 years. Inflation for the last 12 months stands unchanged from last month. That is the good news, but it doesn’t tell the entire story. This article drills down into the components of inflation and exposes how smoking products are driving the crazy train.
How Is Inflation Measured?
Inflation is called the Consumer Price Index (CPI) which is calculated by the Bureau of Labor who examines how consumers spend their money. There are two populations measured: the All Urban Consumer Group which represent 90% of the total population, and the Urban Wage Earners which includes clerical workers but only covers 30% of the population. Not included in the CPI are people in rural areas, farms, military, prisons and mental hospitals.
The major categories are Food and Energy but, like any government agency, there is a 3rd category called All Items Less Food & Energy. It includes apparel, vehicles, medical care, beverages and smoking products.
Smoking Is Driving The Inflation Crazy Train
While inflation averaged 3.5% over the last 12 months, both the Food and the Energy sectors only increased 2%, which means the real driver of inflation is everything else. The highest increase in prices were the Smoking Products category at 6.8%, Shelter at 5.8% and Transportation at 10.7%.
Inflation Components Can Be Finicky
Look for egg prices to skyrocket and Biden had nothing to do with it. Here are some finicky price changes:
Meats, Poultry, Fish, and Eggs rose 0.9 percent in March, caused by Eggs increasing 4.6 percent and bird flu affecting the largest poultry producer in the U.S.
The index for Other Food At Home decreased 0.5 percent in March, caused by a 5.0 percent decline in the cost for butter.
Cereals decreased 0.9 percent, the largest decrease since the start of the Internet in 1989.
The shelter index increased 5.7 percent over the last year, accounting for over 60 percent of the total 12-month increase in the All Items Less Food and Energy Index.
Summary
Data used to calculate the CPI is collected monthly from 75 cities, including 6,000 homes and 22,000 retailers, for prices people pay for goods and services purchased for everyday living. The conclusion is that inflation is not just one number that applies to everything because goods and services have prices that increase but also decline, and each item has its own supply and demand curve.
For more insights into inflation and, most importantly, how inflation affects your lease, read our blogs:
The news just out on inflation is that the Consumer Price Index rose 3.2% for the last 12 months ending February, but what you hear in the news about inflation is that it is only one number which implies that it reflects everything we buy. Not true. This article examines how prices change in various industries and discloses what to look at in order to predict inflation.
Consumer Price Index
Consumer Price Index Sectors
What you hear about most often is called the Consumer Price Index, which is collected from 75 urban areas throughout the country including 23,000 retail and service establishments. Data on rents are collected from about 50,000 landlords or tenants. Inflation is measured by the Bureau of Labor Statistics and includes over 8,000 items, but not all items change prices to the same degree. For example, food prices increased 2% but energy prices dropped 2% over the last 12 months.
Producer Price Index
However, if you really want to know where inflation is headed, look at the Producer Price Index, which measures the prices that domestic producers are charging and includes the very first transaction for many goods and services. As products flow through the supply chain, the Producer Price Index measures the first increase in prices from the producer’s perspective which eventually reach the consumer. This is different from the Consumer Price Index (CPI), that measures price change from the purchaser's perspective.
Producer Price Index Measures Goods & Services
The Producer Price Index covers goods and services. The Producer Price Index increased 1.6% from February 2023 to February 2024. Prices for goods rose 0.3% over the year, while prices for services rose 2.3%.
PPI-Service Sector Includes Wholesale & Retail Trade
The PPI service sector includes 69% of service output including wholesale and retail trade, transportation and warehousing, information, finance and insurance, real estate brokering, rental, and leasing, professional, scientific, and technical services, administrative, support, and waste management services, health care and social assistance and accommodation.
Summary
The past 13 years the Consumer Price Index has averaged 2.6%, with a low of -0.1% in 2015 and a high of 8% in 2022. During the same period, the Producer Price Index averaged 2.6% with a 2015 low of -0.9% and a 2022 high of 9.5%. The PPI peaked in July 2022 and appears to have established a bottom in December 2023, having a series of higher lows with an overall increase since then.
The big trend is still down and will not go back to the supply chain shortage days of 2002, but the short term trend is more of the same, having established a bottom and should trade within a range between 0% and 2%, below the long term average of 2.6%. Inflation should return to its long term average; however, interest rates will come down very slowly since demand is still strong.
The longer inflation maintains its historical average, the faster long term interest rates will fall, because of the reduced premium as a hedge against rising inflation. Long term rates will not reach the pandemic caused lows but should reach equilibrium around 5%. Keep an eye on the Producer Price Index to know for sure.
An estimated $532 billion in mortgages on commercial property comes due in 2024, and since most commercial property loans are made by local and regional banks, the potential damage for commercial property defaults could bring about the same problems we saw in the 2008 crisis which sent the economy off a cliff. Last year's bank victims were Signature Bank which held a 12% market share of New York City commercial property, and Silicon Valley Bank which was the 2nd largest bank failure in U.S. history. This article explores delinquency rates among the major sectors and examines which commercial property sectors are safer than others.
December 2023 Delinquency Rate Jumps
The overall delinquency rate for 2023 was 3.04% which does not seem high but amounts to $16 billion of the commercial mortgages due to mature in 2024. The risk to an average person is if a bank has a high percentage of commercial loans, any defaults could affect the banking industry but also the economy. New Orleans' FNBC bank failure was only $1 billion but was Louisiana's largest bank collapse.
Not All Sectors Have The Same Problems
Note in the chart above how little the industrial sector is affected by delinquent loans, compared to all the other sectors. The explanation is that an industrial plant is not feasible to relocate and is less susceptible to market changes like the lodging and office sectors are. The most vulnerable sector is still retail, which has double the overall delinquency rate, but was the only sector to get better in December compared to the last 12 months. It is no surprise that the office sector is worse, with December's delinquency almost three times its 2023 average.
The Banking Industry Solution Kicks The Can Down The Road
When a commercial loan gets into trouble, most banks will simply extend the loan and add on additional principal payments. The result is that the owner gets to fix things if the cycle reverses and keep the property but will give up equity. While non-performing loans are monitored by the Federal Reserve Bank, especially those over 90 days, the banks have an incentive to extend a loan rather than take over the property. This just throws good money after bad and we can only say a prayer when delinquent mortgage judgement day comes.
We examined 300,000,000 square feet of New Orleans office space for lease since 2010, comprised of 57,000 listings and 1,500 lease transactions, looking for trends and insight to why lease prices have increased the last 13 years despite the fact that supply has increased in the number of square feet for lease. Let's get started.
The Background
First let's look at the averages for the last 13 years. We start in 2010, at the tail end of the nasty 2008 recession where the economy stagnated for 2 years due to the mortgage crisis. Finally by 2011, GDP got back on track.
Gross Domestic Product (In Billions) Since 2008 Recession Source: St. Louis Federal Reserve (Fred.stlouisfed.org)
From 2010 to 2022, 30 year mortgage rates declined, then skyrocketed from 3% to 7% in just 2 years.
30 Year Fixed Mortgage Rates Since 2008 Recession Source: St. Louis Federal Reserve (Fred.stlouisfed.org)
Given declining rates and a slow growth economy in Orleans Parish, population increased 20% over 6 years then peaked in 2016. A declining population should mean less demand for offices in which to house them.
Population Growth In Orleans Parish Since 2010 Source: United States Census Bureau
The Averages
Since 2010, the average monthly supply of office space for lease has been 1,911,000 square feet, compared to 2024 of 2,243,000. There has been a monthly average of 364 listings for lease averaging 5,250 SF at $17.30/SF but only 10 actually leased averaging $16.09/SF.
Office properties for sale totaled 110,000,000 SF since 2010 and averaged 690,000 SF monthly comprised of 32 listings at 21,000 SF at a price of $81/SF.
Data benchmarks for office leasing in New Orleans since 2010
Defying Economic Law
Since 2010, supply for lease, measured by square footage, has decreased 5 times but always rallied back stronger. The anomaly is that those times where supply fell, prices fell twice but rose 3 times.
In 2011, supply fell 525,000 SF but prices increased from $16.80 to $17.35/SF. The number of listing for lease fell 24%. In 2015, supply fell 450,000 SF within 6 months, but lease prices increased from $15.58/SF to $16.64/SF.
The lowest lease price was May 2014 at $15.34/SF, followed by the lowest monthly SF for lease during December 2015, and prices have increased steadily since then to the 2024 all time highs of $19.14/SF and 2,250,000 SF listed for lease.
Summary
So how can prices increase even though supply has increased and population has declined? The answer is a shift in the demand curve. Despite more space for lease on the market, there has been enough demand to soak up the available space and pay the higher lease rates because there are few alternatives.
No new office buildings have been built in New Orleans since 2010 and several hundred thousand square feet has been taken off the market, including the 485,000 SF Plaza Tower and the 1250 Poydras conversion of office to hotel space.
Two days ago, 30 year mortgage rates posted by Freddie Mac dropped to 6.67%, from a peak on October 26th at 7.79%. That is a big drop in a short time. The recent drop in rates was the result of lower inflation data in addition to a dramatic fall in the demand for new mortgages due to skyrocketing mortgage rates which bottomed January 7, 2021, at 2.65%. Rates increased since 2021 due to two main factors: OPEC reduced supply which caused oil prices to increase, and COVID caused supply chain disruptions which caused a shortage in goods which led to higher prices. This was a rapid mortgage rate increase which disrupted businesses who did not have enough time to adapt. Those businesses that were not flexible and loaded with debt were forced to close or merge. Such is the way of the normal business world-adapt or die.
Fastest Surge in Mortgage Rates In 40 Years
Mortgage rates have been in a downtrend the last 40 years, peaking at 18.44% on October 30, 1981, until the bottom in 2021. The chart above shows how rapid the 2021 increase in mortgage rates were, and it was the 2nd largest rate increase in 50 years. The cause for the largest mortgage rate increase in the 1970's was the same cause for the rise in mortgage rates in 2021: OPEC reduced supply which caused oil prices to increase. Inflation is a measurement of many factors, but oil prices have a large weighting in the calculation of inflation.
Summary
What we have experienced with mortgage rates the last two years is highly unusual and should not be taken lightly. Those businesses that lived through it should give themselves credit and build into their future business model the same strategy that pulled them through this crisis.
Today is National Pasta Day so remember the food service workers that bring you that delicious lasagna. We are curious as to why restaurants in Louisiana have such a difficult time getting workers, so we did some research and have the answer.
Average Wage For The Person That Brings You The Lasagna
There are about 1,100,000 food service workers in Louisiana, which include chefs, bartenders, waiters & waitresses, dishwashers and hostesses. Their average annual wage is $25,340, about 20% less than the national average of $32,130 and $2,540 less than what they could earn in Texas.
Bottom 10% Of Wage Earners
The range of wages is wide because food service has a wide skill set. The highest earners are the chefs which may have culinary school training and the bottom 10% of wage earners would be the dishwashers with an average annual wage of $17,390 in Louisiana, about 20% less than the national average.
Top 10% of Wage Earners
The top 10% of food service would be the skilled workers who earn an annual average of $45,150 nationally and $35,480 in Louisiana. The top 10% wage earner gets $13,020 annually more than the average, or 40%. In Louisiana, the top 10% earn $10,000 more than average, which is the same 40%. But if you are a top food wage earner in Louisiana, there is only a $2,000 annual gain in moving to Texas and only a $2,000 annual loss in moving to Mississippi.
Summary
So remember your food service workers in Louisiana and mention that culinary school could make them an extra $10,000 a year and thanks for not moving to Texas.
Valuing commercial property can be a real mystery sometimes because comparable sales are often scarce. This article discusses the 5 things you need to know when working in, buying, selling or leasing commercial property.
Know what to look for in buying, selling or leasing, offices, shopping centers, apartments, hotels and warehouses.
How to use technology, including demographics and zoning, to make better decisions.
How to understand and command the nuances of contracts.
How to utilize basic financial analysis tools for realistic valuations.
How to negotiate with attorneys and agents.
Here Are The Major Sectors of Commercial Property
Office
Industrial
Retail
Shopping Centers
Hospitality
Multifamily
Understanding The Lease Contract
What is CAM? Stands for common area maintenance and is all the operating expenses of the property, including property taxes, insurance, landscaping, water and electricity costs. These costs can be passed along to the tenant or included in the rent price. If they are passed along, the landlord estimates the CAM expenses at the first of the year and charges 1/12 of the yearly cost monthly to the tenant. At the end of the year, if expenses are different from the estimate, the landlord bills the tenant a lump sum reconciliation.
What are rentable and usable square feet? Usable square footage is the actual size of the space a tenant would use, not lease; however, there are other spaces that the tenant uses, such as the hallways and lobby and restrooms. Adding up all the space in the building less the vertical penetrations such as elevators and stairs equals the rentable square footage. This is divided by the total usable square footage which is called the core factor. The usable square footage of an individual tenant space times the core factor is called the rentable square footage. The result is that the tenant pays the cleaning, air conditioning and heat for the hallways and lobby and other common area in the building.
What are gross and net leases? A gross lease is when all the operating expenses are included in the price of the lease. The tenant gets one price per square foot and never has to pay more, unless the lease spells it out. A net lease is a base rent per square foot plus the operating expenses, including everything else. Sometimes in a net lease, the property tax roll is in the tenant's name because the tenant is responsible for property taxes, even if they increase dramatically. Landlords love net leases.
Types of Office Space
The bible of real estate is declared by the Building Owners and Managers Association, or BOMA, and here is how they classify the 3 types of office buildings:
Class A Most prestigious buildings with rents above average for the area. Buildings have high quality standard finishes, state of the art systems and an impressive market presence.
Class B Buildings with rents in the average range for the area. Building finishes are fair to good for the area and systems are adequate, but the building does not compete with Class A at the same price.
Class C Buildings for tenants only wanting functional space at rents below the average for the area.
Class A office buildings tend to have on site parking which is usually covered and have the highest rents. These buildings are the most luxurious and always well kept. Not a drop of trash anywhere. They usually have a cleaning crew operating continuously and a concierge or security guard at a desk in the lobby.
Class B space is nice but not the best. It is priced usually $2-$3/SF less than Class A and not as luxurious but just average in upkeep.
Class C is adequate and usually $5-$6/SF less in price. These are the older building without parking and not well maintained.
Industrial
Industrial space can be anything from breweries to warehouses and 5,000 square feet to millions. Industrial property tenants and owners are interested mostly in:
3 phase electrical-this allows heavy machinery to operate and 99% of all warehouses would already have 3 phase electrical.
High floor density-since warehouses are used to store inventory close to where it is being used, pallets of materials are stacked high, creating a high load on the floor. Over time, the floor would crack, so knowing the floor strength would allow a tenant to not damage the floor. The strength is determined when the floor is poured, so if you are in 300 year old New Orleans, you will need to get PSI Company to drill small holes in the concrete and test for the strength.
Loading docks-could be drive up ramps for a florist's van or dock high loading docks that an 18-wheeler can back into so a forklift can unload the pallets.
Laydown yard-every warehouse or industrial property needs a fenced in side yard to store lumber or steel or long pipes that do not need to take up space under the roof.
Eave height- since the warehouse is used for storage, the height of pallet stacking is limited by the height of the eave which is how high the roof is at the wall. The center height is simply how high the roof is in the middle, which is highest in a pitched roof. Measurements are taken from the bottom of the metal support rafters.
Apartments/Multifamily
Low Income Tax Credits
Almost all multifamily/apartments are financed with help from the government. The most common assistance is Low Income Tax Credits from the Department of Housing & Urban Development, or Community Block Grants or New Market Tax Credits. Every year HUD issues $13 billion in tax credits to the states, which then takes applications from developers. Once the state awards the credits to developers, they can be sold to investors, usually at 90 cents on the dollar.
The investor then applies the full $1 worth against his state income tax obligation and the developer uses the cash payment from the developer as equity for a loan from a bank who acts as the middleman. The developer only has to agree that 40% of the apartment units are rented to tenants with incomes no more than 60% of the area's median income. Minimum wage income for 2 is $30,000 annually so the benchmark would be $24,000 income. All tenants would have jobs and be law abiding citizens, as dictated by the apartment's property manager.
Retailers
Retailers always want to be in an area where there are enough shoppers to make their store feasible. The standard in demographic research is the population count and household income, but the latest technology drills down into how that income is spent.
Data from ESRI shows that within a 10 minute drive time that 5,205 households own a pet which is 59.7% of households and 13% more than the average household in the United States. The retailer now knows that Petco would be a successful tenant.
Retailers-Consumer Spending Patterns
Drilling down further into consumer spending, the data show that $5,596,611 is spent on sporting goods within a 5 minute drive time, but no existing retailer sells sporting goods. This is vital information for the retailer tenant and also the landlord, because now both parties know that type of business will be successful and how much they can expect in sales.
Consumer Price Index Adjustments
The most important language in a lease contract is the clause on increasing the rent amount to keep pace with inflation. This language must be very specific but also clear. Most language states the rent is tied to the consumer price index, but there are actually 4 consumer price indices. Here is how your lease should state the inflation adjustment:
“The rental under this lease shall be four ($4.00) dollars per square foot for the first twelve (12) months, with annual adjustments tied to the Consumer Price Index (published by the Bureau of Labor Statistics, All Urban Consumers, Current Series, Index) for the previous calendar year period.”
Notice that language tells exactly what index is used, where to find it and how to apply it.
How To Value Commercial Property
The value of commercial property is based on the net operating income, which is the actual, not forecasted, rent income minus expenses (but not depreciation or interest). In the table above for a 10 unit apartment building, the rent income is $96,600 annually and the net operating income is $85,159.
The value is calculated by dividing the net operating income by the capitalization rate, which we assume is 7%. The seller would then value the property at $1,216,557. But wait, there's more. Notice that the seller left off management and advertising expenses. The buyer will add this expense back in because he will not manage the property himself like the seller did, who did not charge for his time. Assuming advertising of $500 monthly and management of $500 monthly, plus repairs/maintenance of $1,000 monthly, the buyer net operating income is $61,159 annually, making the value $873,700. The final sale price on this property was $810,000.
Negotiation
Most buyers and sellers can only negotiate on 3 variables, which usually are: price, deposit amount and length of inspection period. Often there might be 10-15 issues, but both parties need to let some issues go. You want to let go of the items that are not that important and negotiate on the items that are deal-breakers.
Be an active listener. Think about what the other party is saying, then repeat it back to them: "If I hear you correctly, what you are saying is ...". There is always the reason stated but then there is the reason behind the reason. Find that out.
This newsletter looks at price trends as of September 2023 for 9,018 listed properties for lease and for sale in the entire state of Louisiana, plus we drill down for major city trends as well as compare asking prices to actual transacted prices. We found some trends that help forecast future prices but also some trends that are harder to figure out than Taylor Swift and Travis Kelce. Let’s get started.
Louisiana Asking Lease and Sale Prices By Sector
First, let’s look at average sale and lease prices for the major sectors in the entire state of Louisiana. We examined 9,018 listings with 26 million square feet for sale and 30 million square feet for lease.
The industrial sector has 13 million square feet for lease and 10 million for sale. Lease and sale asking prices have increased 20% since January 2022 because lease square feet declined by 4 million but, surprisingly, sale square footage is unchanged. That means the demand curve shifted to cause the 20% price increase.
The office sector has 8.7 million for lease and 5 million for sale. Since 2022, lease prices are flat but sale asking prices increased 12%, even though listed square footage increased by 900,000 for both.
The retail sector has 4.9 million for lease and 4.4 million for sale and while square footage for both is unchanged since 2022, asking lease prices have increased 10% and sale prices 23%.
The shopping center sector has 2.6 million for lease and one million for sale. Supply is down for both about 200,000 square feet since January 2022 but prices are about the same.
Office Asking and Actual Lease Prices
We examined 6,967 office listings for lease over the past 3 months which had 194 actually leased. Of the 194 leases closed, Metairie had 21 leases and commanded the highest asking price of $21.27 per square foot and actual transacted lease prices were only discounted 3%, averaging $20.57 per square foot. Lake Charles, Slidell, Denham Springs and Bossier City only averaged 1 lease transacted per month each which explains the anomaly of actual lease prices higher than asking. Baton Rouge closed the highest number of leases at 66, averaging a 17% discount, but Lafayette is again the big winner closing 36 leases at a 3% premium.
Retail Asking and Actual Lease Prices
Of the 3,048 retail lease listings, only 3% or 95 were closed in the last 3 months. Metairie lists 232 spaces and only closed 6 but commands the highest asking lease price at $24.78 with actual price averaging $23.29. Baton Rouge has the most listings at 715 and closed 22 but New Orleans closed the most at 31 which is a large enough sample so is not an outlier but still unusual, averaging $25.83 per square foot which is a 7% premium to the asking price.
Industrial Asking and Actual Lease Prices
Lafayette commands the highest asking lease prices in the industrial sector at $10.03 per square foot but actual lease prices averaged a 20% discount at $8.10, on the 7 leases closed of the 101 listed. Among the major cities, there are 899 industrial lease listings and 42 spaces were leased, with Baton Rouge the most active with 18 leased followed by Shreveport with 13 leases closed. New Orleans and Lake Charles only closed 2 leases, so their actual lease prices at a large premium to asking prices were outliers, proving that in slow markets, only the prettiest warehouses get the attention.
Shopping Center Asking Lease Prices
The shopping center market is slow. The chart shows only the asking lease prices of 1,364 lease listings. Since only 19 leases were transacted, comparing reported prices is as crazy as a Sam Bankman-Fried interview. Baton Rouge had the highest number of transactions at 7, averaging $15.56 per square foot on actual lease transactions or a 5% discount to the $16.34 asking price.
Summary
Three revelations arise when you look at all the data.
Days on the market averages 300 days for all sectors and ranges from 188 for shopping centers to 705 for vacant land. Even excluding the land category, the time it takes to lease or sell commercial property averages 212 days.
Not many commercial properties are leased or sold each month. Of the 6,839 properties for lease or sale in just the major cities, only 219, or 3%, were closed last month. This includes all sectors too.
The good news is that, on average, the range is narrow between actual and asking prices for all sectors. For the entire state of Louisiana, average transacted prices range within a 12.70% and 15.70% discount, averaging only 13%. This means that transacted prices are pretty close to the asking price, no matter what sector or what town, which is a tribute to the agents who are doing the research to place a realistic value on both lease and sale listings.
Footnotes: The Hospitality and Multifamily sectors did not have enough sales in this time period for the data to be reliable, but we will cover those sectors later.
Sources: Crexi, LoopNet, LACDB, MSCREX.
The industrial property market, for lease and for sale in Louisiana, is only 10% of the entire commercial market, but bringing a new industry to your city can have an impact much greater than all other commercial sectors combined. But you don’t just put a sign up and wait for an industry to come to your city. They have to be wooed. This article explores the behind the scenes work to get an automaker to invest $5 billion in a small town and employ 8,000 workers at $58,000 salary. Plus benefits.
How It Starts
The work started 20 years ago when the Port Authority purchased 1,500 acres for $22 million to give to an automaker who would come to the area. The work continued when, in 2018, Georgia Governor Brian Kemp wanted to get an automaker to bring an electric vehicle manufacturer to town. So how did he do it? He went to Seoul, South Korea to meet the CEO of Hyundai.
Over the next 5 years, the terms of a deal were hammered out which involved senators for the state, economic development teams, city officials and the white house. The facility will be located near 150,000 population Savannah, Georgia, a touristy town and home of “The Big Chill”, but will be 16 million square feet under one roof with a 300,000-vehicle output per year plus a battery plant. Here were the freebies given to Hyundai as an incentive to come:
$472 million in waivers of property taxes, but Hyundai will still pay $357 million over the next 26 years.
$86 million given to Hyundai to purchase the plant site, paid by state and local governments.
$200 million from the state for road improvements plus $50 million on machinery and equipment.
$396 million in exemptions on state taxes on construction materials.
$212 million in exemptions on state income tax credits.
Not The 1st Rodeo
This isn’t the state’s first rodeo. They gave $450 million in incentives for a Kia plant in 2009, and $300 million in incentives for an electric vehicle battery plant that created 2,600 jobs. Why is this worth it? New industry creates jobs, which lowers the crime rate and funds the resources to hire more police and increase teacher pay.
May 11, 2022, West Point - Aerial photo shows Kia Motors' US Assembly Plant in West Point on Wednesday, May 11, 2022. Georgia is poised to announce its second electric vehicle plant, a massive assembly complex by Hyundai Motor Group, that could bring with it 8,500 jobs to a site near Savannah, people familiar with the matter have told The Atlanta Journal-Constitution. (Hyosub Shin / Hyosub.Shin@ajc.com)
Summary
Louisiana could be the kid to learn a lesson from Aaron Rogers. Rather than nickel and dime a developer for control over who a tenant would be, we need to realize we are competing against states that will give $86 million to purchase land and a building. Mississippi has a leg up with the Canton Nissan plant which brought a 95% increase in employment to Madison County. So how can real estate agents bring big industry to your city?
Connect with your economic development agency and have them make a presentation at your group's next meeting.
Seek out large land and vacant buildings in growing population areas and put them into commerce.
Make sure your industrial listings show in all the databases that each economic development agency advertises. The local economic development team has a database but so does the local utility and also the state:
Since the major cities in Louisiana have such different economic drivers, lease prices for the same commercial property type can be as far apart as Scooter Braun and Taylor Swift. This article looks at price trends over the 3 months from May to July 2023 for 11,700 listed lease spaces in each major city for the major property sectors: retail, office, industrial and shopping center. We found some trends that help forecast future prices but also some trends that defied proven economic theory. Let’s get started.
Retail Prices-July 2023
First, let’s look at the retail sector. We examined the asking lease price for 2,800 listings where the average lease price was $17.60 per square foot; however, the actual price leased was $16.40. Asking lease prices ranged from $12.58 to $24.45, with Metairie and New Orleans commanding the highest lease prices and Lake Charles and Shreveport suffering with prices half of those. New Orleans accounted for 30% of all spaces leased and Baton Rouge with 20%, with Metairie, Denham Springs, Covington and Lake Charles only leasing 12 spaces. Total. Over 3 months.
Retail Prices Since 2010
From 2010 until 2017, the supply of space for lease declined from 6,000,000 square feet to 3,000,0000, but the asking prices for retail space also declined, hitting a low of $11.87 per square foot in December 2014. Supply then increased until peaking in 2020 at 6,000,000 square feet, then declined again to the current level of 4,600,000 square feet for lease. This defies economic theory that states increased supply must lead to reduced prices. But that theory has an assumption that demand remains steady. So, the explanation that defies Alfred Marshall’s 1890 law of supply is that demand simply changed. From 2014 to 2020, supply increased 100% but prices increased 24%, so demand for retail space increased dramatically. Then came Covid. Retail space for lease plummeted 36% but prices kept rising from $14 to $15.50 per square foot. The conclusion is that since 2015, the Louisiana retail sector has been very healthy, despite online shopping and Covid, with demand for retail space fueled by a fervent shopping consumer.
Office Prices-July 2023
We examined 6,700 office spaces for lease, which comprised 57% of all the sectors. Metairie and Lake Charles commanded the highest office prices and Slidell, Denham Springs and Shreveport were all near the bottom. New Orleans and Baton Rouge have 50% of the market, but the real winner is Lafayette that closed 22% of the office listings in the last 3 months but only has 13% of the listings. Something is going on in Lafayette.
Office Prices Since 2010
The office market since 2010 tells a different story than the retail market does; instead of a decline, then an increase, then another decline and another increase, the office market increased in supply from 2010 to the peak in 2018 but has declined ever since. That leads to the explanation of why prices have increased from $16 per square foot to $18: because there has been little new construction of office buildings. Why no new construction? There is little demand in office space due to a population decline. Office building demand is based on the number of workers, which is based on the number of people at working age. Louisiana’s population has declined, with the 2021 year witnessing the largest one year population decline since Katrina. The decline in office square feet for lease has resulted in an increase in price from $16 to $18 per square feet, but this trend cannot continue if the population continues to decline causing the need for office space to house a declining work force to decline with it.
Industrial Prices-July 2023
The industrial lease market in Louisiana is small with 875 listings accounting for 7% of the total. The big dogs are Baton Rouge and Shreveport with 82% of the leases closed in the last 3 months and 70% of the listings, but New Orleans was sucking hind teat* and only closed 4 leases of their 135 on the market.
Industrial Prices Since 2010
The Louisiana industrial market has the most consistent price, compared to all the other sectors. Over the last 13 years, asking lease prices have been in a narrow range of $3.55 to $5.00 per square foot. Supply has increased from a low of 8,000,000 square feet to 19,000,000 in 2023, with most of the supply coming in 2019 when supply increased from 12 to 19 million square feet.
Shopping Center Prices-July 2023
Baton Rouge and Lafayette closed 60% of the shopping center space for lease in the last 3 months, with the other cities only closing 2 leases each. Baton Rouge alone has 30% of the listings. Metairie only has 57 spaces for lease which is 4% of the market, and their average asking price is the 2nd highest. Lake Charles proves to be the strongest market with 138 listings averaging $21.62 per square foot.
Shopping Center Prices Since 2010
Louisiana shopping center supply bottomed in June 2013 at 2.2 million square feet for lease and peaked September 2019 with 4.5 million square feet. While supply has declined 1.7 million square feet over the last 4 years, lease prices are about the same. In fact, prices are only 5% more now than they were in 2010, over 13 years ago. Owning a shopping center in Louisiana is a tough way to make a living.
Summary
Retail: Metairie and New Orleans command the highest lease prices, but Baton Rouge closed 20% of the deals these last 3 months with prices 10% below average.
Office: Lafayette closed 22% of all deals with only 13% of the number of listings. New Orleans and Baton Rouge have 50% of the market, but Baton Rouge closed 58 deals or 30% of the listings in the last 3 months. Metairie has the highest prices but only closed 9% of the listings.
Industrial: Lake Charles and Lafayette have the highest prices, almost double the other major cities but Baton Rouge and Shreveport closed 82% of the leases. New Orleans closed 4. Total.
Shopping Center: Prices are highest in Lake Charles and Metairie, but they only closed 3 leases in the last 3 months. Asking lease prices overall are only 5% higher than in 2010.
This is the kitchen sink article: we look at all the commercial sectors across the state of Louisiana to examine current asking and actual prices and size of the market, then we drill down into the office sector in the major cities to determine trends in prices and supply since 2011. Let’s get started.
Louisiana Market Share By Sector
First, let’s look at Louisiana. The total market value for all commercial property sectors, for sale and for lease, is $5.1 billion, with only $367 million for lease and $4.78 billion for sale, but the data uncovers two surprises: one, that 60% of the dollar value is in the vacant land sector and, on top of that, the driving force of the New Orleans economy-the hospitality sector-has the smallest market share of 1.67%.
Louisiana Prices By Sector
Even though we are examining last month’s activity for the entire state, each sector is driven by its own supply and demand. For example, the industrial sector lease prices are the most stable, with the average asking price for lease across the state at $4.90 per square foot and the actual price leased at $4.89 per square foot for the 10 spaces leased last month of the 287 properties on the market.
The office sector failed to get its Covid shots and is still sick, with average asking prices of $18 per square foot but landlords, so anxious to find any tenant, were willing to settle for $16.10 per square foot for the 60 spaces leased of the 2,406 on the market.
The retail sector averaged lease rates of $18.23 per square foot, 18% higher than the average asking price of $15.50, for the 34 spaces leased of the 1,079 on the market. The explanation is that the higher priced retail stores are in better locations and the only ones in demand.
The shopping center sector averaged actual lease rates of $21.98 per square foot, an increase of 53% over the average asking lease rate. There were only 15 lease transactions of the 655 listed, so the large variance in actual prices means that the well-maintained, best location, shopping centers were the ones attracting tenants.
Office Price Trends & Supply-2011 to 2023
This week we drill down into the office market in Louisiana where there are 2,406 lease listings, approximately 20% more than the 2,162 average since 2011. The average lease listing since 2011 is 3,900 square feet with an asking lease rate of $16.35 but actually leased at $14.35 per square foot. Asking lease rates are at their highest levels with the July 2023 average asking lease price at $18 per square foot, up 9% from $16.50 per square foot in January 2021. The increase in rates was produced by a supply of office space that peaked at 11,500,000 square feet in December 2017 and declined 26% to 8,500,000 square feet as of July 2023. These numbers are for the state as a whole, but each city has a different dynamic.
Office Sector Moves To Quality Over The Last 3 Months
Drilling down into the office sector for the last 3 months, Baton Rouge and Lafayette accounted for 52% of all office lease transactions. Baton Rouge averaged only 2nd to last in prices however, with an average lease rate of $14.99 which was a 20% discount to asking lease rates. There were 58 office spaces leased the last 3 months in Baton Rouge, of the 1,872 on the market.
The Slidell office market has proven to be the strongest, with the highest lease rates averaging $25.15 per square foot for the 6 spaces leased of the 152 listed. Asking prices average $15.75, so the highest quality office spaces at the top of the price range were the spaces tenants wanted.
Summary
The commercial market in Louisiana is not homogeneous by sector nor by city. Prices as of July 2023 show that the industrial market is stable, the office market has the highest lease prices of all time but deals are done at a 20% discount, the retail sector is strong with actual lease rates higher that the overall asking rates, and the shopping center sector last month had 15 transactions at a 53% premium to the average lease price. Slidell reported the highest office lease prices but Baton Rouge scored the most spaces leased because prices were discounted 20%.
The most important unknown in valuing commercial real estate is the Cap Rate, which is the multiple applied to income from property to determine market price. Cap Rates vary by city, state and sector but are also influenced by rates of returns in other investments such as US Treasury Bonds. This article drills down into Cap Rates for the US, and highlights Louisiana and Mississippi Cap Rates for all the major sectors: Office, Industrial, Hospitality, Retail and Multifamily.
National Average Cap Rates
First, let’s summarize the national markets and then drill down into each sector in Louisiana and Mississippi. Nationwide, we examined 176,120 properties totaling $959 billion, which provides a large enough population of data so the results can be statistically significant. The data show that the average property is priced at $175 per square foot and was on the market 158 days with an average asking Cap Rate of 6.1% but the actual sale Cap Rate was 6.3%, which means that the property sold at a slight discount to asking price. The asking Cap Rate ranged between 6% and 6.5% except for an outlier in the Hospitality sector where the nationwide asking Cap Rate was 8.8%. The explanation is that in the Hospitality sector, 40% of the properties are smaller properties valued under $1,000,000 and listed at higher Cap Rates.
Louisiana Cap Rates
Louisiana asking Cap Rates average 7%, with 4.2 billion in property averaging $113 per square foot for 8,000 SF. The Hospitality sector has an asking 12.6% Cap Rate because over 50% of the properties are priced under $1,000,000.
These lower priced properties tend to be in less demand but the averages are offset by the 10% of Hospitality properties priced over $6,000,000 which are more in demand. Asking Cap Rates on Industrial are 7.7% and Retail is back in strong demand at a 6.5% asking Cap Rate.
Mississippi Cap Rates
Mississippi asking Cap Rates average 6.8% with 2 billion in 3,072 properties averaging 7,790 square feet for $105 per square foot. The Multifamily sector averages a 9.5% asking Cap Rate with over 75% priced under $1,500,000 which can carry a higher Cap Rate that raises the average.
The Hospitality sector also stands out with an average asking Cap Rate of 9.20% because over 80% of the properties are priced under $1,200,000. Industrial asking Cap Rates are 7.4% but Retail is back in strong demand at a 6.7% Cap Rate.
Summary
Nationwide, actual sold Cap Rates over the last 12 months increased from 5.7% to an ending June 2023 of 6.3%. While this increase in Cap Rates seems small, the effect on the market price of the asset can be dramatic because any change in asset value can trigger loan parameters that a bank may have on a property. In a worse case future scenario, a bank may require the owner to come up with additional money on a loan, so that the loan to value ratio is unchanged. For example, the Cap Rate change just these past 12 months from 5.7% to 6.3% means that for every $10,000 in net operating income, the value of the asset would have fallen $16,700.
The Louisiana market followed the national average these last 12 months, with the Hospitality sector having a much higher asking Cap Rate of 12.6% due to a large number of lower priced properties. Overall, the Louisiana asking Cap Rate increased from 6.5% to 7%.
The Mississippi Cap Rates were unusual in that both the Hospitality and Multifamily sectors had asking Cap Rates over 9%. While overall asking Cap Rates over the last 12 months ranged from 6.9% to 7.4%, now the average is 6.8%.
Want more information on using Cap Rates to value commercial property, rather than articles on recipes? Check out our blog: How To Value Real Estate Using Cap Rate.
Hard data is from Crexi, LACDB and LoopNet/CoStar.
Today marks 20 years licensed in the real estate industry. The relationships formed along the way in doing the deals are the most meaningful but my body of work is how I keep score:
Benchmark
Count
# transactions
125
# properties targeted/pitched
527
# brokers worked for
3
# real estate brokers rejecting my job application
5
# brokers who fired me for not responding to an email
1
# times sued broker
1
# times sued by client
0
# times sued client
1
# website redesigns
23
# times website hacked by Russians
1
# times published in national magazine
6
Businesses looking to expand and open a new location always research demographic criteria such as population count, income, age and how nearby residents spend their money; however, one of the most reliable indicators of future success of a business is nearby employment that affects the ability of customers to purchase goods and services. This article explores the major cities in Louisiana and Mississippi to see who ranks #1 in putting people to work.
Louisiana
First, let’s examine how Louisiana and Mississippi as a whole are doing and then we will drill down into the top cities in each. For Louisiana, employment increased steadily from 1.4 million in 1976 when data was first collected until 2014 when the number of people with jobs peaked at 2 million and has been stuck there the last 9 years with only a gain of 11,123 workers since. The average gain in employment has been .92% per year since 1976.
Mississippi
Mississippi paints a grim scenario with increased employment from 900,000 in 1976 until peaking at 1.24 million in 2000 and never recovering. That is a total loss of 35,000 workers the last 23 years.
Next let’s drill down into the top 4 cities in Louisiana and then get into Mississippi cities. What we uncover is a wide variety of employment growth, with ups and downs characterized by each city’s competitive advantage such as natural resources or being closely tied to the oil industry or to government.
Louisiana Top Cities
Baton Rouge
Baton Rouge tells a Cinderella story with employment in 1990 of 280,000 growing steady to 440,000 in 2023. In the 32 years of data, Baton Rouge employment rose each year 80% of the time and the worst decline was only 5% due to Covid in 2020.
New Orleans
New Orleans since 1990 has been in cardiac arrest. Starting in 1990 with employment of 552,000 and ending in 2023 with 565,000, New Orleans has only gained 13,000 workers, or 2.5% over the 33-year time frame. Even before Katrina in 2005, New Orleans had been stagnant, with only a 6% total gain of 13,000 workers for the 14-year period from 1990 to 2004.
Shreveport
Shreveport grew steadily with 169,000 employment in 1990 until 1999, then declined for 3 years, then exploded 30,000 jobs or 17% for 7 years until 2006 due to oil prices climbing from $26 per barrel to $61 during the same 3-year period.
Employment then declined steadily for the next 17 years to 179,000. The result is a total employment growth of 10,000 jobs, or 6% during the 33-year time frame.
Lafayette
Lafayette is the 4th largest municipality in Louisiana with a population of 240,000, and solid growth in employment of 156,000 in 1990 growing 33% to 207,000 in 2023. Lafayette also benefitted from the 2002-2006 oil price increase, but peaked in 2014 with employment at 220,000, followed by a 6% decline over the next 9 years.
Mississippi Top Cities
Mississippi ranks at the bottom in household income, 3rd to the bottom in percent graduating high school, and bottom in health care among all 50 states. Let’s examine how Mississippi’s major cities are growing.
Hattiesburg
The Hattiesburg MSA which includes Laurel has a population around 170,000 and enjoyed a steady 40% employment growth from 47,000 workers in 1990 to 67,000 on 2023. In the 33-year period of recordkeeping, employment increased 65% of the time and never declined more than 4% from one calendar year to the next.
Jackson
Jackson enjoyed solid growth from 1990 with 216,000 people employed until peaking in 2004 at 264,000 workers and for the last 19 years has lost 9,000 workers total. There were 3 severe drops in employment: losing 24,000 people from 2004 to 2010, building it back up but then losing 16,000 from 2012 to 2014, then building employment back up, only to lose 42,000 workers in 5 months but then building it back up to almost the 2004 level.
Gulfport/Biloxi MSA
Gulfport has a population of 72,000 and Biloxi has 50,000 and the Gulfport/Biloxi MSA includes the surrounding 4 counties with a population of 246,000 people. Employment since 1990 grew from 126,000 to 1999, peaking at 171,000 for the next 24 years. The most severe loss was 31,000 workers within 6 months due to Hurricane Katrina in August of 2005. The area never recovered. Total growth since 1990 has been 32,000 people working, averaging only .8% growth per year.
Rockstar Cities
Baton Rouge and Hattiesburg stand out as having the best employment growth, but they are dwarfed by other cities with spectacular growth rates from 70% to over 200%. Unfortunately, those cities are located in other states. Let’s look at a few cities with exceptional employment growth, making them a no-brainer as the perfect new location for a business.
Austin, Texas MSA
Austin grew employment consistently from 445,000 in 1990 to 1,380,000 in 2023, with total employment growth of 935,000 or 210% which averages 6% growth per year. The only decline was due to Covid, causing employment to decline 15% but within 12 months employment had recovered to the 1,240,000 number and is now 138,000 workers above the Covid peak and at an all-time high.
Dallas, Texas
Dallas grew from 1990 employment of 2.1 million to 4.2 million in 2023 with only one 4-month Covid decline of 10% then a recovery.
Huntsville, Alabama
Huntsville grew employment consistently from 145,000 in 1990 to 250,000 in 2023, with total employment growth of 105,000 or 72% which averages 2% growth per year. The only stagnant period was from 2008 to 2015 was due the mortgage meltdown, but in the past 8 years employment has increased 20% by 50,000 jobs.
Summary
The cities that have a definite trend in creating jobs are Baton Rouge, Louisiana and Hattiesburg, Mississippi, so locating a new business in these thriving economic areas would increase the chance of being successful. There are many reasons certain cities grow their economy and create jobs, such as a business-friendly environment with low government restrictions or a high number of corporate headquarters. Our next article drills down into what the top cities are doing to increase employment that the laggard cities are not.
Kenner & Metairie Class A Capture Office Tenants While CBD and Class A Lose
The first 3 months of 2023 confirmed that downtown high rise office buildings are suffering a loss of tenants to Metairie and Kenner. During Covid, from 2020 to 2022, the common hypothesis was that employees would learn to work from home and employers would adapt their processes and controls to accommodate the change. In 2023, we are seeing confirmation that the expectation is proving to be fact. The result is a collapse in rented office space downtown because employers are renting office space in Metairie and Kenner rather than downtown New Orleans, resulting in a $30,000,000 loss due to vacant office space for downtown high rise office landlords. Every year.
Kenner Office Buildings Captured The Most Market Share of New Tenants
The first 3 months of 2023 saw the total New Orleans downtown Class A office market only lease 1,720 net square feet, while in Kenner 27,838 square feet was leased and in Metairie 19,575 Class B square feet was leased. While the quoted rates for downtown Class A space average $20 per square foot, Metairie Class A averages $24 and Kenner averages $19, often much lower rates plus a tenant improvement allowance can be negotiated when new tenants lease in buildings that have a high vacancy.
Where Is The Highest Vacant Office Space?
Kenner Has The Lowest Occupancy At Only 70%
Kenner has the lowest occupancy rate at 70%, compared to 89% for the highest occupancy rate, not in the Class A CBD office buildings but in the Class B Metairie office buildings. The Class A office rate averages $20/SF compared to the Class B rate averaging $16/SF.
Market Share
Downtown Class A Office Buildings Are Two-Thirds Of The Market
The office market in the New Orleans/Metairie/Kenner area totals 14,000,000 square feet, dominated in size by the downtown Class A office space which is two-thirds of the market. Metairie only has 14% of the market and Kenner only 1%, so their impact of taking space away from downtown may not initially be felt; however, the vacant space outside the downtown market totals over 4,000,000 square feet which could lead to heavy price competition. Normally, in a competitive market, a shift in demand causes a fall in prices until they reach equilibrium. In the office market, that seems to be between $16 and $20 until the vacant space is no longer available.
Summary
In summary, if you lease office space, now is the time to check out alternative spaces and negotiate a rate that can lower your rent expense which can make your business instantly more profitable. You can find commercial real estate agents to represent you who are trained in negotiating and have years of experience. Just look for the CCIM or SIOR designation, which means they are the most qualified in the industry and may specialize in the office leasing market.
CCIM Designation: CCIM designees must have proven experience, such as closing ten qualifying activities totaling $10 million or more and completing several years of training culminating in a 6 hour comprehensive exam.
SIOR Designation: SIOR is a Washington, DC-based international professional organization of 2,600 commercial real estate agents who completed at least five years of creditable experience in the highly specialized field of industrial or office real estate, meeting stringent education requirements and demonstrating ability, competency, ethical conduct, and personal integrity.
Your lease always has language that describes how the rent you pay can be adjusted using the Consumer Price Index, meaning your rent payments increase at the end of each year because the rent rate you paid last year is multiplied by the index to determine the rent you pay in the next year.
The problem is that there is more than one Consumer Price Index and there are different ways to calculate each, so make sure your lease agreement contains language that is very specific. Most leases refer to the All Urban Consumers Price Index, but here are all four CPI databases:
The idea got its start in the 1970's when inflation was 20 percent and is meant to benefit only the landlord because it means the rental income to the landlord retains its purchasing power. One example of lease language referencing the CPI is:
How The CPI Is Calculated
So what is the Consumer Price Index and how is it calculated? The Bureau of Labor Statistics, under the Department of Labor, calculates the latest Consumer Price Index numbers. The CPIs are based on prices of food, clothing, shelter, fuels, transportation, doctors' and dentists' services, drugs, and other goods and services that people buy for day-to-day living. Prices are collected each month in 75 urban areas across the country from about 6,000 housing units and approximately 22,000 retail establishments (department stores, supermarkets, hospitals, filling stations, and other types of stores and service establishments).
The All Urban Consumers Price Index consists of all urban households in Metropolitan Statistical Areas (MSAs) and in urban places of 2,500 inhabitants or more. It represents about 93 percent of the total U.S. population. Nonfarm consumers living in rural areas within MSAs are included, but the index excludes rural nonmetropolitan consumers and the military and institutional population.
In calculating the CPI, the urban portion of the United States is divided into 38 geographic areas called index areas, and the set of all goods and services purchased by consumers is divided into 211 categories called item strata. This results in 8,018 (38 × 211) combinations.
What Is Included In The CPI ?
The CPI represents all goods and services purchased for consumption by the reference population with all expenditure items divided into 211 categories, arranged into eight major groups:
MEDICAL CARE (prescription drugs and medical supplies, physicians’ services, eyeglasses and eye care, hospital services).
FOOD AND BEVERAGES (breakfast cereal, milk, coffee, chicken, wine, full service meals, snacks).
APPAREL (men’s shirts and sweaters, women’s dresses, jewelry).
TRANSPORTATION (new vehicles, airline fares, gasoline, motor vehicle insurance).
RECREATION (televisions, toys, pets and pet products, sports equipment, admissions).
EDUCATION AND COMMUNICATION (college tuition, postage, telephone services, computer software and accessories).
OTHER GOODS AND SERVICES (tobacco and smoking products, haircuts and other personal services, funeral expenses).
Latest CPI Numbers Show a Trend Change
For the month of June 2023, the All Urban CPI rose 2/10ths of one percent and over the last 12 months increased 3.0 percent before any seasonal adjustments. This was the smallest 12-month increase since the period ending March 2021 and while some categories increased in price, others dramatically decreased. For example, the cost of shelter accounted for 70 percent of this increase because prices were 7.8 percent higher, but there was a major decline in the energy index which plummeted 16.7 percent.
CPI Data Just For The Southeast
The CPI is calculated for the U.S. as a whole but additional data is calculated for each state and also for each of the 7 regions. Louisiana specific data falls into the Southwest Region and Mississippi specific data falls into the Southeast Region. Above is the chart of CPI for the South Region whichis comprised of Alabama, Arkansas, Delaware, District of Columbia, Florida, Georgia, Kentucky, Louisiana, Maryland, Mississippi, North Carolina, Oklahoma, South Carolina, Tennessee, Texas, Virginia, and West Virginia. If you wanted your lease to more accurately reflect the CPI in your region, you would substitute these region numbers for the U.S. CPI numbers. For example, the 12 month South CPI rose 3.3 percent for the 12 months ending June 2023 compared to the U.S. number of 3 percent.
Summary: The 5 Things You Need Clear In Your Lease
It Is Clear Where The CPI Is Published-If rent is tied to an index, what index is used and where can you find it? For example, the lease language can spell out that the rent is adjusted by the All Urban Consumer Price Index, and points out that the data is published by the Bureau of Labor Statistics, which is found easily online.
It Is Clear What Type of Consumer Price Index Is Used-There are 4 methods used to calculate the Consumer Price Index, and if the parties both agree, they can select any method that works best.
It Is Clear Whether The CPI Is Adjusted For Seasonal Changes-The CPI can be adjusted for changing climatic conditions, production cycles, model changeovers, holidays, and holiday sales which can cause variation in prices. For example, oranges can be purchased year-round, but prices are significantly higher in the summer months when the major sources of supply are between harvests.
It Is Clear Whether The CPI Is National or Local-The CPI publishes unadjusted price indexes at the national, metropolitan area, and regional levels. So you could drill down and calculate your CPI based on your city’s MSA. This would be more meaningful if your economy is an outlier, such as Houston, Detroit, or New Orleans.
It Is Clear How The Adjustment Is Applied-The CPI adjustment can applied to a lease payment monthly, quarterly, or annually, but be clear about what period of CPI is used. It is best that landlord and tenant agree the CPI is calculated based on the previous 12 months and applied to the last rent payment.
If you are looking to grow your business, first look at where the population is growing. Last week the Bureau of Labor Statistics released data on the fastest growing cities in the US, and this article looks at trends and where Louisiana and Mississippi rank.
The last 12 months show that the fastest growing cities for jobs were in Texas, with Midland ranking #1 at 7.7% job growth and Odessa ranking #6 at 5.5%. Both cities benefit from spending by the oil industry.
If you are looking at just the numbers of jobs, Texas grabbed first place with growth of 529,000 jobs and a 4% growth in jobs, followed by California adding 427,000 jobs but only 2.4% growth.
Which State Has The Most Fast Growth Cities?
The best chance of success for a business would be in a city with the highest growth rate in jobs, but also in an area where there are several high growth cities. Texas tops the list again, with 11 cities that have 3.3% or higher job growth over the last 12 months, followed by Florida with 8 cities, Georgia with 5, and the other 47 states have only 3 or less cities with job growth over 3.3%.
Summary
So what does Texas do that Louisiana & Mississippi doesn't to attract jobs? It can't be the education level, because only 84% of Texans graduate high school, which is among the lowest in the US. Here are the reasons companies flock to Texas:
No income tax on individuals.
No corporate income tax-Texas does impose a tax on gross sales but does not have a corporate income tax.
Electricity costs are 20% lower. The average cost is 8.5 cents per kilowatt hour.
Texas ranks first with 55 Fortune 500 company headquarters, compared to two in Louisiana and none for Mississippi.
Recently nola.com staff writer Blake Peterson reported on the future development possibilities for the largest land site to become available in Metairie, and interviewed Louisiana Commercial Realty on future possible uses and insights. The 8 acre site currently is the Haynes Academy and is one of 174 properties owned by the Jefferson Parish School Board since 1909 who will demolish the buildings at a cost of $300,000 and put the land on the market for sale. The property has an unusual boundary, with a triangle shaped 2 acres including 550 feet fronting Metairie Road connecting to 6 acres in a rectangle shape fronting the Magnolia Drive side street.
Property Surrounded By Highest Income Population
Within a 3 mile drive time, the 8,600 residents have the highest income in the New Orleans MSA, with an average household income of $145,000 annually. The median age is 46 and 54% have household incomes exceeding $100,000. This makes the property attractive to retail stores that offer high-end products and, since these products are the most profitable, this means those stores have a business model that allows them to pay higher than normal rent, which means the developer who buys the land and develops the stores then rents them to the retailers can afford to pay a higher than normal price for the land. So this land sale is destined to be the highest dollar per square foot sale in the area.
Residential Zoning Prohibits The Most Profitable Use
The property is zoned R1-A, Single Family Residential but the Future Land Use Zoning is Suburban Residential for the 6 acre rectangle and Mixed Use Zoning for the 2 acre triangle fronting Metairie Road. Zoning districts regulate the type of business that can operate from the property and Land Use dictates what goes on the land. The property also has an overlay called MRTPD, Metairie Ridge Tree Preservation District which requires a Tree Protection Plan and parish arborist review and a separate permit to be submitted.
Summary
The highest and best use would be to development the Mixed Use 2 acre triangle as retail stores since 550 feet fronts Metairie Road, providing easy access, high traffic and visibility to retailers. The remaining 6 acre rectangle would have to be single family homes, but the land could be worth twice as much to the School Board at sale if they could get the zoning changed to R-3 zoning which is multi-family and allows apartments which are more valuable than single family homes to a developer. The neighborhood would be against apartments because of the traffic but if the property could be designed to have access to the apartments from Metairie Road which would alleviate traffic, the residents might go along with it.
In this article, we examine the permitted uses in various commercial real estate zoning districts for New Orleans including Orleans and Jefferson Parishes. Zoning uses and density can determine feasibility, so gathering this information is imperative before you make an offer.
Real Estate Developers Are a Special Breed
Commercial real estate development is not a feat undertaken by the weak. The entrepreneurs making things happen today are a special breed. They not only have a vision and an instinct of where opportunities exist, but they put their money where their mouth is, risking millions on just an idea. There is no guarantee that building a $25 million dollar apartment complex to solve the housing problem will produce the rents needed to break even and there is no guarantee that spending $6 million to make a shopping center look better will result in higher rental income, and it is really a long shot to build an office building since tenants can find current office space at $15/SF. Even with all the risks, developers are coming to New Orleans anyway and trying to make things happen because they like our culture and vibrant tourism based economy.
The Correct Zoning May Not Even Be Available
Many developers find our commercial real estate zoning and planning codes to be convoluted, but zoning codes are no more restrictive than in Atlanta, Memphis or Birmingham. Zoning is more lax in Covington and Mandeville than in New Orleans, but then you don't have the demographics to support a large project once you get away from New Orleans. In fact, New Orleans zoning and planning codes make sense, and it helps to know how they apply to what you are developing before you get started.
Let's examine building an apartment building in either Orleans or Jefferson Parish; ideally, you would want RM-4 zoning for the highest density, and you would need four to six acres. The first problem you'll face is finding four acres of land. It doesn't exist. The next problem is finding land zoned RM-4. Maybe you'll find a duplex or two but nothing of scale. One solution in Jefferson Parish is to use C-1 or C-2 zoning which allows multi-family use; however, Jefferson Parish requires 50% non-residential use on the ground floor of a multifamily structure over 30 units. Non-residential uses include parking, lobby, management office, mail or laundry room, and health club.
Another solution is to purchase industrial zoned land but change the zoning since multi-family is not allowed in industrial zoning.
Zoning Designation vs. Land Use Designation
One important issue is how the zoning code applies to the use of the space but there is also a code for land use which is easily identified by a map. The future land use map illustrates the preferred location of development over the next twenty years, and is comprised of eighteen future land use categories and provides for an adequate mix of land use types in appropriate locations. Residential categories range from low-density residential development to high-density residential development. The future land use map also provides a variety of commercial, office and retail, industrial, mixed-use, public, and recreation lands. In developing the plan, each of these uses, which are described below, are designed to protect existing neighborhoods, provide shopping and recreational uses in close proximity to residents, and to make the most efficient use of infrastructure.
Land Use Classes
(1) Low-density residential (LDR): The low-density residential land use category includes single-family, detached-unit residential development at a maximum net density of up to 4 dwelling units per acre.
(2) Low-medium density residential (LMR): The low-medium density residential land use category includes single-family detached-unit residential development at a maximum net density of 9 dwelling units per acre.
(3) Medium-density residential (MDR): The medium-density residential land use category includes single-family detached, two-family, three-family, and four-family dwellings, townhouses, and condominiums at a maximum net density of 25 dwelling units per acre.
(4) High-density residential (HDR): The high-density residential land use category includes townhouses, condominiums, and multi-family apartments up to a maximum net density of 65 dwelling units per acre.
Commercial Zoning Categories
In Orleans Parish, commercial zoning categories are:
MS: allows RM-2 uses plus medical, parking garages, and adult day care.
RO: allows RM-2 plus offices, motels, and clinics.
RO-1: retail, hospitals, clinics.
B-1: allows RM-1 uses plus retail, hospitals, and clinics.
B-1A: allows RM-2, hospitals and retail, but not boarding houses.
B-2: allows RM-2, hospitals and retail, but not timeshares.
C-1: allows RM-4, B-1 and B-2, apartment hotels, boarding houses, and retail.
C-2: allows B-1 or B-2, RM-4, and retail.
Residential Zoning Categories
Orleans Parish Residential Zoning: C-2 zoning allows the same uses as RM-4, which, for multi-family exceeding 41 units, has a density of 1,000/SF lot area per dwelling unit, with a minimum 400/SF lot area for a residential planned community. In addition to the zoning, you might have a specific land use or an overlay district. The Urban Corridor Overlay is a part of B-1 zoning in Jefferson Parish which means any development must undergo a complete review by the City Planning Department, which usually takes several months. B-1 allows uses approved by RM-1, which has a minimum density of 1,800/SF minimum lot area for a three-family or more development.
Orleans Parish Residential Zoning:
C-2 zoning allows the same uses as RM-4, which, for multi-family exceeding 41 units, has a density of 1,000/SF lot area per dwelling unit, with a minimum 400/SF lot area for a residential planned community. In addition to the zoning, you might have a specific land use or an overlay district.
The Urban Corridor Overlay is a part of B-1 zoning in Jefferson Parish which means any development must undergo a complete review by the City Planning Department, which usually takes several months.
B-1 allows uses approved by RM-1, which has a minimum density of 1,800/SF minimum lot area for a three-family or more development.
Orleans Parish Multi-Family Zoning:
RM-1: low-medium density residential, garden-style apartments and single-family. Density 1,800/SF minimum lot area per dwelling for multi-family. Maximum height 40 feet.
RM-2: 1,000/SF minimum lot area per dwelling. Maximum height 75 feet.
RM-2A: 1,000/SF minimum lot area per dwelling. Maximum height 40 feet, or 60 feet if fronting a street.
RM-3: 1,000/SF minimum lot area per dwelling. Maximum height 75 feet.
RM-4: 1,000/SF minimum lot area per dwelling, or 400/SF minimum for a planned residential community. No limit to height.
Developer's Dilemma: Meet With Neighborhood Group vs. Not
The fact is you'll need a simple letter backing the project from the City Council member in the district where your development is, but no City Council member will back a project that the neighborhood associations are against. A short meeting, one-on-one, with the president of the neighborhood associations (there may be more than one) will go a long way towards building support. You will need floor plans and architectural drawings to help explain the details of your project. Neighborhoods prefer developments that bring unique businesses to the area and only want two things: no increased traffic or littering. Little things like rebuilding playgrounds go a long way to getting neighborhood support.
City Council Members Have Not Encouraged New Businesses, Especially In New Orleans East
Some areas allow multi-family as a conditional use, such as B-1 zoning, which means the Executive Director of the Planning Department must recommend the City Planning Commission conduct a public hearing, and the City Council is the final decision-maker. For years, New Orleans City Council members have not been willing to even meet with developers to learn how they can bring new businesses into their district, and the result of their action is a lack of growth, especially in New Orleans East.
How Do You Change Commercial Real Estate Zoning?
How do you change commercial real estate zoning? File the paperwork, meet with neighborhood leaders and the City Council Representative, present at a public hearing, then wait for the City Council vote. Total time: six to twelve months.
Summary
If all this zoning information seems confusing, the solution is to build a team of experts you can rely on including a knowledgeable commercial real estate agent along with a seasoned contractor and architect.
For more articles on commercial real estate, click here for our blog.
The most popular method of appraising commercial real estate is not the most accurate. Usually, we compare past sales of property and apply the price per square foot, but this is valid only if all the properties compared are homogeneous, which is never the situation. This article examines three common methods of valuing commercial real estate and explains which method is best.
Valuing Commercial Property With a Sales Approach
The most common method of valuing commercial property is the least accurate, because it only works if all properties have the same characteristics. Called the Sales Approach, it requires gathering the sales price of nearby comparable property, then making adjustments for different traits. This leads to inaccuracy, since the unique quality of real estate is that location can contribute greatly to how a property is used which determines what its value might be, and no two properties can occupy the same location. Other characteristics such as floor plan, parking, zoning, ingress and egress can also contribute greatly to value.
Valuing Commercial Property With a Cost Approach
Sometimes, owners value real estate based on what they paid for it, or what someone last offered for the property, or the cost to build a new building. These valuation methods are always wrong. In reality, the market value has little to do with the cost of property, and an offer made by one buyer does not mean a different buyer would value the property at the same price. The market value is the price a property would bring in an open and competitive market, with a willing buyer and seller knowledgeable about the property condition. The cost approach only works when you have the time and financing plus a reliable contractor to build an identical structure on identical property.
Valuing Commercial Property With an Income Approach
Whether you own stocks or bonds or real estate, the best method of valuing an asset is calculating the present value of all future cash flows. The underlying principal is that a dollar one year from now is worth less than one dollar today, because you could invest that dollar today at some interest rate which will grow in one year to a value of more than one dollar.
FV is the nominal value of a cash flow amount in a future period;
i is the interest rate, which reflects the cost of tying up capital
n is the time in years before the future cash flow occurs.
Let’s put this information to work and say a property delivers $10,000 annually in cash flow after taxes. The current value is the sum of future cash flows. You calculate each year’s cash flow, discounted back at an interest rate you could earn on other investments. Let’s assume 7 years at a 5% interest rate and change the n value to match the number of years in the future.
YEAR
INCOME
CURRENT VALUE
1
$10,000
$9,523
2
$10,000
$9,070
3
$10,000
$8,638
4
$10,000
$8,227
5
$10,000
$7,835
6
$10,000
$7,462
7
$10,000
$7,106
TOTAL
$57,861
Summary
In summary, $57,861 today is the same as $10,000 for 7 years, assuming 5% interest rates. Therefore, if a property had a 7 year lease that produced income of $10,000 annually, the current value of that lease income alone would have a value of $57,861.
Can Opportunity Arise from Tragedy?
Unless you go back to the 1970s, New Orleans East has never been an economic driver for the area. Even though it is the largest land area in New Orleans, if you ranked all the cities over 50,000 population by income per capita, the East would rank not in the bottom 10 percent but in the bottom ten. The closest city comparable to its economy is Flint, Michigan.
There is an opportunity, however, discovered in a research report by Louisiana Commercial Realty which concludes there is a real need for grocery stores, sporting goods stores and restaurants in the East.
Using the latest technology to determine consumer spending which measures demand, then matching demand with supply, measured by sales figures from the 1,300 businesses already in the East, the research found what is called the Marketplace Gap. This is the amount of money flowing out of the area because there are not enough businesses to satisfy demand.
For example, businesses in New Orleans East sell $53 million of groceries annually; however, residents of the East spend $82 million annually, with $29 million leaving the area. That means there is a real need for a grocery store in the East, and forecasted sales would be at least $29 million. Businesses just have to find a way to fill the void and offer products that consumers are already buying elsewhere.
75,000 Residents In the East Buy Lots of Things
The East has a population of 75,969 with 56,089 adults in 27,142 households with a median annual income of $33,431. Where they spend their money can now be measured scientifically, by an calculation called the Market Potential Index. If the number exceeds 100, it means that a good or service is purchased more than average. The Retail Market Potential Analysis shows the number of adults purchasing specific products; for example, the index of 122 for buying cigarettes at a convenience store the last 30 days means that behavior occurs 22% more than normal, which means there is more demand, but there are only 7,488 adults making that purchase. Businesses coming into the area need a higher number of buyers, such as these purchases:
• 33,709 shopped at a convenience store the last 6 months. • 20,807 purchased a cell phone the last year. • 40,617 drank bottled water. • 10,784 bought costume jewelry, but 10,697 bought fine jewelry.
Retail Market Potential Analysis
When investgated, Louisiana Commercial Realty found that residents of the East are 32% more likely to buy an Android smartphone and 37% less likely to buy an iPhone. They are big into fast food, with 23,000 visiting a fast food restaurant more than 9 times per month.
• 31,213 attended a movie even though no movie theater exists in New Orleans East. • 21,112 dined out. • 7,244 gambled at a casino. • 39,809 visited a doctor and 27,274 purchased vitamins. • 49,573 read an electronic or printed magazine. • Of beef, chicken, turkey, and fish, 18,122 adults purchased beef at the grocery the last 6 months. • 50,222 spent money at a fast food restaurant the last 6 months, and 40,000 visited a family or steakhouse. • 10,273 traveled outside the US the last 3 years. • 18,000 have homeowner’s insurance and only 8,988 have auto insurance.
75,000 Residents in the East Spend Hundreds of Millions
The Retail Goods and Services Expenditures Analysis shows how much money was spent, which can be used to determine market size for new businesses moving to the East.
• $138,595,522 was spent on food, with $82,390,590 spent on food at home and $56,204,932 spent dining out. • $16,503,337 spent on cable and satellite television. • $3,210,066 spent on membership fees for clubs. • $10,044,806 spent on furniture and $5,562,838 spent on appliances. • $7,639,413 spent on child care. • $3,210,066 spent on club memberships.
Retail, Scientific & Government Are Almost 40%
Of Businesses In The East
There are approximately 1,300 businesses employing 17,000 people in New Orleans East, and the largest sector is retail where 2,488 people are employed. Professional and scientific occupations are the next highest category with 2,351 employees (14% of total), followed by 1,989 government jobs (11%), and hotel, warehousing and health care the remaining employment sectors.
Over 50% of businesses located in New Orleans East have revenues under $1,000,000, with 34% having revenues under $500,000. This creates an opportunity for government assistance to educate small business owners on skills to improve their operations, such as marketing, social media, accounting, banking and human resources. There are 36 businesses with revenues exceeding $5,000,000 so an opportunity exists for the 256 businesses with revenues under $1,000,000 to provide services to these larger businesses, offering reduced transportation costs and a higher level of service.
Over Half Of Businesses Have Revenues Under $1,000,000
60% of businesses have under 9 employees, with the largest size of less than 4 employees amounting to 29% of all businesses.
Most Businesses In The East Are Family Owned
Nearby Universities Are a Competitive Advantage
New Orleans East is close to three Universities and Lakefront Airport. This offers an opportunity to partner with universities on housing and student activities.
Enrollment at Nearby Universities:
Southern University at New Orleans: 2,715 students.
Dilliard University: 1,300 students.
University of New Orleans: 7,112 students.
Over 100,000 People Drive Through New Orleans East Every Day
The Louisiana Department of Transportation shows the I-10 traffic at the Crowder Boulevard interchange in New Orleans East averages 125,000 cars per day. This equals the traffic at the CBD Poydras Street interchange, and is 80% of the traffic at Causeway Boulevard and Clearview Parkway.
What Do New Orleans East Residents Believe?
The Lifestyle Tapestry Analysis utilizes leading-edge technology of data mining to look beyond typical demographics of age, income and education level and drill down to the socioeconomic quality of the neighborhood and what residents believe is important in their life. The Tapestry Analysis recognizes that our country is diversified and uses socioeconomic and geodemographic data to organize neighborhoods into 14 LifeMode Groups and then into 67 Market Segments, which help businesses determine optimum locations for success, more efficient advertising and fly-off-the-shelf inventory that appeals to what consumers in the neighborhood want.
Tapestry Analysis Shows What People Believe Is Important
New Orleans East Tapestry is called Family Foundations, which encompasses 27% of the population compared to 1% normally in the U.S. Members belonging to this Tapestry Segment believe family and faith are most important, and have these traits:
• It is common for older children to continue to live at home. • Work in health care or government. • Style is important, and purchases important to them include smartphones and clothing, especially for children. • Shop at Kmart, Sam’s and Dollar Stores. • Own 3-4 televisions and use the Internet for entertainment. • Read magazines. • Live mostly in New Orleans, Houston, Birmingham and Atlanta.
Louisiana Commercial Realty's Summary and Recommendations
Taking into account the needs of the 75,000 people living in New Orleans East and the 1,300 businesses in the area, there is sufficient demand for these businesses to enter the market and be successful:
Grocery Stores
Sporting Goods Stores
Restaurants
Furniture Stores
Actionable Items
Here are a few actionable ideas that can bring about immediate improvement:
Organize leaders that can bring resources to the area, including:
Hotels and restaurants in CBD.
Bankers.
Churches.
Mayor and Governor.
Senate, House and committee members.
Bring rapid, frequent direct bus service from a staging area such as Walmart or Lowes to the CBD where residents work.
Offer emergency daycare so residents don’t miss work due to child care.
Utilize existing railroad to provide transportation to/from work in CBD.
Organize micro-finance startups for residents to open new businesses in the area.
Money is made in commercial real estate by having the vision to create value where none existed before. Since commercial property prices are not transparent like stocks quoted at the bottom of your screen TV, the person who accurately determines value is the one who comes out ahead. Smart commercial real estate investors use a tool called the Capitalization Rate, or Cap Rate, and this article shares the basics and how you can use it to your advantage.
Whether you are investing in stocks or bonds or real estate or certificates of deposit, you do so to realize a greater value in the future, which is determined by two inputs: cash flow and appreciation. With stocks, you might get a dividend and hopefully capital gain, and with CD's you get income and no gain- just your principal back, and with bonds you get interest, or cash flow, and principal back at maturity and maybe a gain or loss if the value of the bond trades higher or lower before maturity. With commercial real estate, you also get rental income and maybe appreciation when you sell.
The smart way to value all of these investments is to calculate the present value of the cash flows. That is, what you would pay today for the future income generated by the investment. If you expect to receive $100 one year from now, how much would you pay for that investment today? First, you have to know your opportunity cost, or how much interest you would earn on your next best opportunity.
Let's say you could earn 3% in a CD for one year, then comparing that to an alternative investment for one year that would pay $100, you would divide the $100 by one plus the interest rate (1 +3%), or 1.03, which is the same as $100/1.03 which equals $97.08. Therefore, you would pay $97.08 today for $100 in one year.
To value commercial real estate, you use a variation of the same principal. You start with the calculation of the Net Operating Income, which is Gross Income less Operating Expenses, including vacancy and credit losses but not depreciation. You determine value for commercial real estate by dividing the Net Operating Income by the Cap Rate, which can vary by region and by category of real estate, and below is a chart showing the history of average Cap Rates.
The chart shows Cap Rates average 5.4 percent. The way you use this is the following: divide your Net Operating Income by the Cap Rate, and the result is the value. Let's say you have a commercial property that produces $1,000,000 in Net Operating Income, and you then divide that by the Cap Rate: ($1,000,000/5.4%=$18,518,518). Therefore, you would pay $18,518,518 for the property. This assumes no increase in value due to appreciation, but you use the same strategy to calculate an additional appreciation (as an investor though, you don't pay other people for appreciation which you create). A small change in Cap Rate makes a big difference in value, so this tool is important in valuing commercial real estate.
For more information on valuing commercial real estate, you can get workshops on Commercial Real Estate Financial Analysis at CCIM.
One of the first challenges in opening a business is to find the right location, and the most likely concerns about the location are traffic count, visibility, access and nearby consumer spending patterns. However, one thing that should be high on your to-do list should be to check out the zoning and permitted uses. If you are considering opening a restaurant on Magazine Street, read this first.
For example, let's say you want to open a restaurant on Magazine Street in New Orleans; should be a no-brainer, right? There are lots of restaurants already on Magazine Street and the affluent residents have a propensity to dine out often, making it a perfect location. Almost the entire Magazine Street is zoned by New Orleans Planning Department as HU-B1, shown in orange on the map above. This zoning category allows restaurants as a permitted use. Everything is a go, right? Not so fast.
The most restrictive is the Magazine Street Overlay which requires approval for a conditional use for any standard restaurant, subject to the New Orleans Comprehensive Zoning Ordinance section 18.20, which requires:
For outdoor areas: show how you will control alcoholic beverage consumption on-premises.
Provide exterior security cameras.
Submit a summary of the location of places of worship, educational facilities, and parks and playgrounds within three-hundred (300) feet.
Submit a noise abatement plan, to be reviewed by the Director of Safety and Permits, and all other relevant City agencies.
The holding bar, an area of a restaurant where alcoholic beverages are prepared and served at the bar, can be no larger than 15% of the floor area, or 300 square feet.
Hours of operation should be:
Sunday thru Wednesday: from 6:00 am to 10:00 pm.
Thursday thru Saturday: from 6:00 am to 12:00 am (midnight).
Approval For Conditional Use Process
Getting approval for a conditional use requires a city council vote plus a detailed 50-100 page report and approval by the planning department, plus a public meeting of neighborhood homeowners within 300 feet. And once approved, an ordinance must be drafted by the city attorney, then a mandatory 21 day waiting period, then the mayor has to sign the ordinance. Then you have to submit drawings and plans to the New Orleans Planning Department who has to approve the plans and then the Clerk of Court records the plans at the Office of Conveyance. Then you can apply for the required building permits. One drawback is that the city planning commission only meets every two weeks and the city council only meets every two weeks, and each has a different schedule. The result is that the conditional use approval process usually takes about 6 months, and that is if there are no hiccups.
Developments like this can be done, and often this barrier to entry will discourage many. The end result can be a lack of competition. Restauranteurs and developers just need to factor in the lost time and opportunity cost, along with additional interest expense on funding, to determine if projects are feasible and how the zoning can affect the rate of return on your investment.
Starting a business in a new location often means you need to make some changes in the layout so the space is efficient for your business, so you will need two things for a successful project: first, a good contractor and, second, a building permit from the City. This article details the steps in obtaining a permit and why some can be issued quickly and others may take years.
Building Permit ABC's
A building permit is meant to protect the City, neighbors and the neighborhood by ensuring compliance with building codes. Just ask Joe Bruno. You need a permit for any repair that changes the structure or use, but there are different requirements for minor changes versus changes over 50% of the assessed value. The only times you do not need a permit involves simple repairs, such as:
Repairing flooring.
Removing aluminum siding.
Interior painting.
Roofing or gutters
Fences
How To Obtain Your Building Permit
Building permits are issued by the Department of Safety & Permits at City Hall, and while the application can be filed online, your contractor has to make the application.
Here is the information you will need to file for a building permit:
Municipal address of the property
Market value of work to be done (even if you’re doing the work yourself)
Owner’s name, address and telephone number
Architect / Contractor name, address and telephone number (where applicable)
Recorded Act of Sale, if the property has recently changed ownership
Detailed description of work to be performed
Plot plan reflecting all dimensions of the lot and all structures, setbacks to property lines and the location and dimensions of off-street parking spaces. If you are building an addition the square footage of the existing structure and the proposed addition are also required.
Complete plans, stamped with live seals from a Louisiana licensed Architect or Civil Engineer, are required for all new construction, additions, and structural renovations.
Previous/current and proposed use of the structure
Number of floors or levels in the structure
Certificate of Appropriateness, if the property is within a local historic district or a designated landmark
Benchmark Certificate for all new construction or projects where work exceeds 50% of the value of the existing building
Copy of a current Certificate of Registration for your contractor as well as the company name and license number.
Check or money order payable to the City of New Orleans.
That is just for a Building Permit. These are the other permits you will need:
Electrical: if you replace any electrical fixture other than changing light bulbs.
Mechanical: Any repair of the air conditioning system, gas lines or elevators.
Plumbing: Any water pipes replaced or remove any plumbing fixture. Only an Orleans Parish master plumber may apply for this permit.
If you remove paint for a building, first you must notify the Building Division. The penalty for renovating before getting a permit is a fine of twice the building permit price of around $1,000, plus the normal fee.
You may also need approval from the Historic Districts Landmark Commission, The Vieux Carre Commission. If the renovation exceeds 50% of the value of the structure, here are the estimated costs for some of the items needed just to file a permit:
Plot plan showing the lot and dimensions- $2,500 to $5,000
Architectural plans- $10,000 to $25,000
Benchmark certificate-a survey within the last 6 months. $2,000 to $5,000
Foundation drawings-stamped by an architect or engineer. $2,500 to $5,000
Contract for renovation stating the value. Free provided by contractor.
Keep Your Permit In Mind When Negotiating Your Lease
Permits for simple building renovations can take a few weeks but renovations valued at over 50% of the assessed value can take months and even years. Here is one example where a future tenant signed a lease and started the process November 3, 2021 and received the Certificate of Occupancy 18 months later on March 21, 2023. The moral of the story is: when you are negotiating a lease, make sure your lease payments to the landlord start when you receive your certificate of occupancy.
African Americans in the New Orleans/Metairie area were denied as much as 85% more loans when compared to white applicants in the same income bracket, according to research by commercial broker Louisiana Commercial Realty. Data from the Consumer Financial Protection Bureau show that 24,571 loans for New Orleans home mortgages were made totaling $5.3 billion, but African Americans were denied loans totaling $303 million, or approximately 25% of applications, compared to a denial rate of 12% for white applicants.
Reasons For Loan Denial
There are many reasons for loan denial. For home purchase applications, lenders cite low collateral as the most common denial reason. For refinance applications, lenders cite the debt-to-income ratio, insufficient cash, unverifiable information, and incomplete applications as the most common denial reasons. However, these common reasons would not fully explain why the denial rate was higher across the board for any income bracket, even those with income above the median average. Louisiana Commercial Realty researched the data as part of their efforts to revitalize New Orleans East, and commercial broker Robert Hand explains:
"My firm has focused on bringing business to New Orleans East for the last 10 years, so we were curious as to why people were constantly unable to obtain financing to start new businesses even though entrepreneurs had great ideas and the businesses were feasible. When we examined the mortgage numbers, we found that at every level of income, African Americans were denied a much higher percent of loans than whites in New Orleans and Metairie, and also denied loans at a higher rate than the national average."
The study examined 5 income brackets relative to the median income in the New Orleans and Metairie area:
Income under 50% of the average.
Income 50% to 79% of the average.
Income 80% to 99% of the average.
Income 100% to 119% of the average.
Income over 120% of the average.
Results show, even in the income bracket 100% to 119% of the New Orleans average, that denial rates were 24% for African Americans, but only 13% for whites. Percentage-wise, that's an 85% difference and totals $303 million. Since the average loan application was $155,000, that would have denied an additional 1,954 home purchases.
Where Mortgage Information Comes From
The mortgage data is available from the Consumer Finance Protection Bureau, which was established in 2010 under the Dodd-Frank Act and is an independent bureau within the Federal Reserve System, with a $500 million budget financed by up to 12% of Federal Reserve revenues. The Bureau collects the data with the power enabled by the Home Mortgage Disclosure Act, enacted by Congress in 1975 and implemented by Regulation C which requires financial institutions to maintain, report, and publicly disclose loan-level information about mortgages. These data help show whether lenders are serving the housing needs of their communities and designed to shed light on lending patterns that could be discriminatory.
For more information on the New Orleans commercial real estate market, read our other articles: