The most popular method of appraising commercial real estate is not the most accurate. Usually we compare past sales of property and apply the price per square foot, but this is valid only if all the properties are homogeneous, which is never the situation. Let's examine three methods of valuing commercial real estate.
Sales Approach
The most common method of valuing commercial property is the least accurate, because it only works if all properties have the same characteristics. Called the Sales Approach, it requires gathering the sales price of nearby comparable property, then making adjustments for different traits. This leads to inaccuracy, since the unique quality of real estate is that location can contribute greatly to how a property is used which determines what its value might be, and no two properties can occupy the same location. Other characteristics such as floor plan, parking, zoning, ingress and egress can also contribute greatly to value.
Cost Approach
Sometimes, owners value real estate based on what they paid for it, or what someone last offered for the property, or the cost to build the property new. In reality, the cost of property has little to do with market value, and an offer made by one buyer does not mean a different buyer would value the property at the same price. The market value is the price a property would bring in an open and competitive market, with a willing buyer and seller knowledgeable about the facts. The cost approach works when you have the time, financing and a reliable contractor to build an alternative structure.
Income Approach
Whether you own stocks or bonds or real estate, the best method of valuing an asset is the present value of all future cash flows. The underlying principal is that a dollar one year from now is worth less than one dollar today, because you could invest that dollar today at some interest rate which will grow in one year to a value of more than one dollar. Here is the math:
DPV=FV / (1+i)n where
DPV is the discounted present value of the future cash flow (FV),
FV is the nominal value of a cash flow amount in a future period;
i is the interest rate, which reflects the cost of tying up capital
n is the time in years before the future cash flow occurs.
Let’s put this information to work and say a property delivers $10,000 annually in Cash Flow After Taxes. The current value is the sum of future cash flows. You calculate each year’s cash flow, discounted back at an interest rate you could earn on other investments. Let’s assume 7 years at a 5% interest rate and change the n value to match the number of years in the future.
In summary, $57,861 today is the same as $10,000 for 7 years, assuming 5% interest rates. Therefore, if a property had a 7 year lease that produced income of $10,000 annually, the current value of that lease income alone would have a value of $57,861. If an investor required a 10% rate of return, he or she would be willing to pay $578,610 for the property, just to get the lease income.
Not all income is the same however. Let's examine how to determine cash flow income.
Determining Cash Flow
With commercial real estate, the best measure of income is called Cash Flow After Tax, and here is how it is derived.
Potential Rental Income
- Vacancy and Credit Losses
- Operating Expenses
- Annual Debt Service
- Tax Liability
= Cash Flow After Taxes
Determining Operating Expenses
Operating Expenses do not include:
Interest
Depreciation
Capital Expenses
Personal Income Taxes
Reserves for Repairs and Maintenance
Tenant Improvements
Real Estate Commissions
Operating Expenses do include:
Property Taxes
Insurance
Management Expenses
Repairs
Utilities
Source: CCIM Financial Analysis, "The Appraisal of Real Estate", 14th edition, Mark Rattermann, MAI, SRA.
Determining accurate prices for commercial real estate can be elusive. It's not what economist call a highly competitive market such as buying a stock or a bond where the bid (highest price for buyer) and ask (lowest price for seller) is actively visible for all to see. Market prices for commercial real estate can be vastly different from appraisal valuations and can vary widely by property type, location and tenant. The unpredictability of determining a price means that the person with the most knowledge makes the best decision and capitalizes on the opportunity that others may not recognize. This article researches the commercial property markets in Louisiana and Mississippi to provide the knowledge with which you can make better commercial real estate decisions.
The Louisiana Commercial Real Estate Market
For $4.2 billion, you can buy all the listed commercial property in Louisiana. There are 26.9 million square feet for sale and 24.2 million for lease.
Average Time To Sell Or Lease Property
There are 8 sectors of commercial property, shown below. The time it takes to sell or lease most of these 8 types of property is longer than the gestation period of most animals, ranging from 144 to 596 days. Only Apartments and Retail property can be leased or sold faster than it takes to give birth to a human.
Days It Takes To Sell Or Lease Commercial Property, By Type
Industrial-460 days
Office-293 days
Retail-266 days
Shopping Centers-596 days
Vacant land-439 days
Farm & Ranch-not enough data points
Hospitality-Hotels-not enough data points
Multi-Family-Apartments-144 days
Average prices for space for lease and for sale are listed in the table below. The tightest sector is recognized by how close to the list price the transaction takes place. With 700 transactions, Shopping Centers rank the highest demand, having an average transaction at only 6.9% below their list price, followed by 2,493 transactions in the Office sector averaging only 10% below list, land at 15%, Industrial at 16% and in last place is the Retail market that averages a transaction 20% below list.
How Does Louisiana Compare To Mississippi
Louisiana is 4 times the Mississippi market size in property for sale, and 9 times the size in property for lease.
Lease and Sale Prices in Louisiana Compared To Mississippi
The average lease rate in Louisiana is only 10 to 20 percent higher than in Mississippi, but the average sale price in every significant sector is 30 to 100 percent higher. This is due to the more vibrant economy and demographics which drive commercial property to produce more income and therefore hold more value. For example, Industrial sale prices average $34 per square foot in Louisiana compared to $15 PSF in Mississippi, and Office property averages $80 PSF compared to $63 PSF, Retail averages $94 PSF compared to only $48 PSF, and Shopping Centers average $88 PSF compared to $43 PSF.
New Orleans Compared To Baton Rouge
We examine a city's MSA, which is the Metropolitan Statistical Area, designated by the Census Bureau and defined by the Office of Management and Budget as an area with a high degree of social and economic integration . New Orleans MSA is the larger market measured by square feet for sale, with 8.4 million vs. 5.7 million in Baton Rouge, but Baton Rouge is the larger market by total sale price with $1.3 billion vs. $1.1 billion.
New Orleans and Baton Rouge Have Similar Prices In Some Sectors
New Orleans has more properties on the market than Baton Rouge in every significant sector. Office and Industrial sector lease and sale prices are very close in both cities, but 371 transactions in Retail averaged a 46 percent higher price in Baton Rouge while 261 Shopping Center transactions occurred at an average 25 percent lower. Since there were hundreds of transactions, the price data cannot be skewed by outliers.
What About Gulfport-Biloxi-Pascagoula
Who would have thought Gulfport even had an MSA. The market is about 13 percent of the size of New Orleans, as measured by square footage for sale and 6 percent of the market size as measured by lease space. Prices per square foot are within 10 percent of the New Orleans market for the Industrial, Office and Retail sectors, but average 57 percent of the Shopping Center lease price. Sale prices are 20 percent higher for Industrial due to a shortage in supply, but Retail and Office sale prices average 10 to 20 percent lower.
Summary
Now that we have the average sale and lease prices of the various sectors in major markets in both Louisiana and Mississippi, where is the opportunity? If you own properties in several cities, it is called arbitrage, but the average person must look for areas and sectors where prices are simply out of sync.
You might think Shopping Centers in Baton Rouge are a steal at a sale price 26 percent less than in New Orleans, but lease rates are 26 percent less also. That's no coincidence. Office property in Baton Rouge is a bargain compared to New Orleans; even though lease rates are 3 percent less, sale prices are 14 percent less. The real bargain is Retail in New Orleans which has 12 percent higher lease rates than Baton Rouge but sale prices averaging 32 percent less.
For more information on prices on commercial real estate, click on these articles:
Office Space Prices In New Orleans
How To Value Commercial Real Estate
Sources: Census Bureau, Department of Labor & Statistics, LACDB, LoopNet
In this article we examine current market prices for every type commercial real estate in Louisiana.
Louisiana Largest Sector On The Market For An Astounding 460 Days
In Louisiana, there is 26.9 million square feet of commercial space for sale and 24.2 million square feet for lease, which can be broken down into these major categories:
INDUSTRIAL: The Industrial sector has 926 properties totaling 21.1 million square feet and an average asking sale price of $34 per square foot and average lease rate of $4.77 per square foot. The average property is on the market an astounding 460 days.
OFFICE: The Office sector has a population of 2,493 properties with and average sale price of $80 per square foot and average lease price of $15 per square foot and on the market an average of 293 days.
RETAIL: Comprises 1,476 properties averaging $94 PSF in sale price and $12.76 PSF for lease with 266 days on the market.
SHOPPING CENTER: Classified by most as part of the Retail sector, but separated out here as 700 properties averaging a sale price of $88 PSF and lease price of $15.87 PSF with 596 days on the market.
LAND: The largest sector with 1.7 billion square feet and 2,570 properties averaging a sale price of $1.43 PSF and lease price of $1.65 PSF. Seems like its a no-brainer to buy the land at $1.43 PSF and lease it out at $1.65 PSF but it takes so long to transact a deal that the Average Days On The Market does not even show in records. It can take decades to lease or sell land.
MULTI-FAMILY: 102 properties averaging a sale price of $38 PSF , although most are sold based on Net Operating Income or Price Per Unit. Multi-Family is the category in the highest demand, as witnessed by the lowest days on the market at 144. Since the recession in 2008 and the housing market collapse, it has required a higher deposit to purchase a home, causing an increase in renting, resulting in a higher demand for apartments, which leads to higher occupancy rates, which results in large institutions changing their asset allocation away from shopping center investment to apartments, which causes a shift in demand leading to higher prices for apartments and lower Capitalization Rates. Whoo! Yes, it is a Domino Effect, and the trend will continue.
TABLE OF PRICES AND DATA FOR COMMERCIAL PROPERTY SECTORS IN LOUISIANA
Industrial Market In Detail
Let's carve out one of the sectors comprising all Louisiana commercial real estate and break it down. The Industrial market is comprised of 926 properties with 570 for lease and 356 for sale. There is 10 million square feet for lease and about the same for sale. On average the last two years, 29 properties have been leased at an average of $3.68 per square foot and 10 properties have sold at an average of $46 per square foot. This is an average of all the industrial properties in Louisiana, and certain areas may be stronger or weaker.
INDUSTRIAL SECTOR DATA
Industrial Market Price Volatility
Just like the analyst on Bloomberg and CNN who prognosticate with 100% accuracy that the markets will be volatile and fluctuate, providing no more insight than a zoo animal throwing a dart, the chart below shows that over the last 2 years the price of leasing Industrial space on average in Louisiana has gone up and down but not gone anywhere at about $4 per square foot. The average days on the market ended up where they began at around 300.
CHART OF DAYS ON THE MARKET AND LEASE RATE FOR INDUSTRIAL PROPERTY IN LOUISIANA
Tune in next week for a detailed look at prices of other sectors of commercial real estate in Louisiana.
For more information on prices on commercial real estate, click on these articles:
Office Space Prices In New Orleans
5 Things You Need To Know About Pricing Multi-Family
A vacant hotel property that is among the largest pieces of available real estate along Tulane Avenue recently changed hands after more than three years on the market.
The Americas Best Value Inn, 2820 Tulane Ave., sold on March 25 for $1.06 million, according to Orleans Parish conveyance records. The 16,000-square-foot hotel, which is spread across three separate buildings, sits on a more than 30,000-square-foot tract of land near the Orleans Parish Criminal District Courthouse.
Conveyance documents show the property, which had also gone by the name Patio Motel, sold to an entity known as 2820 Tulane LLC. Records from the Secretary of State list New Orleans residents Bahram Khoobehi and Hossain and Mahmood Mogharehabed as members. The new owners could not be reached for comment.
Commercial broker Robert Hand, president of Louisiana Commercial Realty, said the property has been vacant since 2011 when a fire in one of the rooms caused severe damage to the roof and most of the second and third floors. The property was put on the market in “as-is” condition and listed at land value.
According to Hand, buyers came forward twice in 2011, but neither could arrange financing. The property sold in 2012 for $650,000 to a local hotel owner who intended to restore it as a hotel, but the project became too expensive. Prior to this most recent deal, Hand said a verbal offer came in 2014 from a local construction company, but a deal couldn’t be reached.
“It was rather surprising that it took this long to close a promising deal,” Hand said. “Tulane Avenue is among the most anticipated areas in New Orleans for new developments and we had a number of written offers, but none materialized.”
“Negotiations with this most recent buyer began in February,” Hand said. “The plan is to include retail on the ground floor, which is required by zoning, and office space on the upper levels.”
The hotel’s seller is listed as WHCTC II, LLC, which lists New Orleans resident Wen Chuan Chen as a member.
According to assessor’s records, Khoobehi owns several residential properties along Broadway Street uptown.
The common belief that homes prices rise during the summer months because everyone wants to be settled in before school starts is true. The facts show us that the highest prices concentrate around the month of June.
Examining The Trend of 10,323 Homes Sold Over The Last 5 Years
Using the Multi List Service from the Realtor database, home sale prices can be sorted by month, as shown in the table below in a sample of 10,326 single family detached home sales. The highest price month is highlighted yellow, and the second highest price month is highlighted blue. The results show in all but one month since 2010, the highest average price for homes sold occurred in June, and in the second highest price in 3 of the last 5 years occurred in the month of July.
Average Sale Price By Month For Single Family Homes The Last 6 Months
Chart Home Sales By Month
The concentration of homes sold in June can easily be seen in the chart below because almost every year it is the month where prices reach their highest level.
Source: GSREIN MLS database, Stats customized by average sale price and exported.
Note: Average sale prices were used. Results differ if median sale prices are used.
For prices on commercial real estate, click here for charts of current list and lease prices on Industrial, Retail, Office & Retail sectors.
Over the last 4 years, available office space for sale in the New Orleans area has plummeted to one third of its previous supply, due to a lack of new office space construction. The result is a strengthening of sale prices in the office market. This article examines the supply and demand of office space and the trend for the future.
Just 4 years ago, there was just as much office space for sale as there was for lease: around 1.9 million square feet. Each month, on average, there have been approximately 322 properties for lease at an average of $16.30 per square foot and 34 for sale at an average of $58 per square foot. Sale prices averaged 8 percent below the list price and the average property was on the market 354 days.
Today; however, tells a different story. Even though the supply of office space for lease has increased slightly from 1.9 million square feet, the amount of office space for sale has dropped by two-thirds to only 622,000 square feet.
Chart of New Orleans Office Space For Sale and For Lease Since 2010
Economics 101: Supply and Demand
Basic economic theory says, given all other variables unchanged, a decrease in supply leads to an increase in price. That theory can be seen in practice in the chart below which compares the prices over the last 4 years of office property for lease and for sale. The result is that with the strength in supply in office space for lease, prices declined approximately 8%, while prices of office property for sale have increased 20%.
Chart of New Orleans Office Space Prices Since 2010
Summary
Equilibrium in prices is not reached until the supply approximates demand, so the future for office space is that lease prices will continue to fall since the amount of office space for lease appears to increase slightly. Sale prices will continue to rise, causing a new wave of sellers of office properties to enter the market and take advantage of higher prices. This will eventually stabilize the prices of office space for sale.
Sources: Louisiana Commercial Database, LoopNet
For help leasing, buying or selling office space, contact Louisiana Commercial Realty at 504-289-8172 or by email at roberthand@cox.net.
For additional articles on office space supply and demand, click:
Fire Damaged America's Best Hotel Going Back Into Commerce As Office/Retail Center
NEW ORLEANS, Louisiana. March 26, 2015 – Tulane Avenue is the most anticipated area in New Orleans for new developments, and the largest tract of land in the area will finally be put back into commerce after 4 years of work by a local commercial real estate broker. Louisiana Commercial Realty president Robert Hand says, "Our firm has been involved with almost every major development in the Tulane Avenue area, and we are proud to announce another vacant property will be put back into commerce. The fire-damaged America's Best Hotel at 2820 Tulane Avenue has been sold to a local businessman who hopes to transform the property into a new office and retail development."
The 4 year struggle to get the 32,579 square foot of land developed started in April 2011, after the property was severely damaged by fire caused by one of the hotel's residents who was cooking on a hot plate in a room on the third floor. The fire destroyed the roof and most of the third and second floor. The property went on the market to be sold in AS-IS condition, and many hopeful developers thought it could be revived as a moderately priced hotel. In June 2011, a developer agreed to purchase the property, but it turned out they did not have the proper financing and the property went back on the market. In October 2011, there were negotiations from a nearby property owner to purchase the property, but things fell apart when the buyer again could not get financing. Finally in January 2012, the property was purchased for $650,000 by a local hotel owner who believed Tulane Avenue was a good location and envisioned putting the property back into commerce as a hotel. The new owner incurred over $100,000 in fees from architects and attorneys just so he could present the development to the City Planning Department for approval, but after nearly three years he was still unsuccessful. The owner decided a hotel would require more effort and expense than he expected, and decided to entertain offers to purchase the property. A verbal offer from a local construction company in December 2014, for $1,000,000 could never be finalized in writing, but in February 2015, negotiations started with a local businessman who owned nearby retail property and wanted to do more in the area. Finally in March 2015, the businessman purchased the property for $1,060,000 under the name 2820 Tulane, LLC.
Hand says, "We are reminded when properties like this are put back into commerce, that real estate is often the vehicle by which the average person can achieve their lifelong dream. The seller of this property moved to the area 25 years ago, arriving in the middle of a recession with a dream to operate his own hotel. He purchased a small hotel in Houma and built the business up successfully, then sold it and used his family's life savings to buy this property. The buyer of this property is a trained physicist from Europe, whose most likely job was work in the military but sought a better life in the US. He now does work with the National Institute of Health and saves his money so he can buy real estate. It is the grit and determination of an average person, looking to make a better life for their family who in the end helps revitalize New Orleans and transform its landscape. We are proud to have been a part of helping people realize their dream."
About Louisiana Commercial Realty LLC
Louisiana Commercial Realty LLC, based in New Orleans, Louisiana, is known for marketing high value, complicated commercial properties. President Robert Hand is the only commercial real estate broker in Louisiana with an MBA and the CCIM and SIOR designations.
Valuing New Orleans commercial real estate accurately can be difficult at times, but using basic financial principles can help you calculate the market price with a higher level of confidence. Just remember that the price of any object is the equilibrium of supply and demand, but commercial real estate supply and demand can depend on emotional as well as logical factors. The challenge is to avoid these emotional traps and use rational analysis to price your property. Here are the three most common pricing traps that sellers fall into that are imperative to avoid.
1. I'm Just Going To Hold It Until I Get My Price
While the price the seller paid has nothing to do with the value of the property nor what the seller thinks it might be worth, many sellers use their purchase price as the bottom line they will take when negotiating a price with a buyer. It is called "benchmarking" and it is an easy mistake because nobody likes to lose money on an investment. In more cases than not however, a seller is better off taking the highest price they can get and then reinvesting their money elsewhere to recoup their losses since trying to get an above market price might happen, but it might take you ten years to do so. You can prove it with math using the formula for present value: where i is the interest rate you can earn elsewhere and n is the time. Therefore if you wait 10 years to finally get a buyer at the $1,000,000 price you paid for property, you would have the same amount of money as if you sold the property today for $613,913 and put that money to work at 5% annually. This is a real disaster when holding land that does not appreciate in value since you still have to pay taxes and keep the grass cut.
2. The Appraisal Was Much Higher
Appraisals are restricted to using three pricing methods:
a. Income Approach-value based on the net operating income the property generates.
b. Cost Approach-based on what the cost would be today to build your property.
c. Market Approach-based on what other properties in the area have already sold for, adjusted for inequalities.
The appraisal is always based on assumptions which, using today's methods, don't allow an accurate price. For example, the income approach assumes the tenant does not default on the income, that taxes and expenses do not increase and that current expenses stated by the seller are accurate. Rarely does an appraisal calculate net operating income including maintenance sinking funds, even though air conditioners and roofs have a finite life and need to be replaced. And these are very large expenditures which can easily eliminate a years' rental income. The cost approach assumes you can build a new structure for a certain price, usually a per square foot estimate, when any accurate pricing would require a firm bid from a contractor based on specific drawings for the new project. The market approach assumes properties already sold would still have those buyers interested in your property and would have the same demand. Just because one person paid one million for the property down the road to build an apartment doesn't mean a different person who wants to build a po-boy shop would pay the same amount, or that the apartment buyer would have any money left to purchase your property.
3. It's What I Paid For It
Buyers don't care what you paid for it, just like the television show Pawn Stars, when someone walks in to sell an old item they bought long ago. The Pawn Store is only interested in what they can sell it for. Your cost is called a "sunk cost" in that you spent that money regardless of whether you hold or sell the property.
The Best Method For Valuing Commercial Real Estate
Pricing commercial property accurately can depend on the use a buyer might have, so it pays to ask a lot of questions. Here is a real world example. The subject property is a 10,464 square foot vacant building with three separate spaces: a 4,930sf restaurant, a 3,600sf retail space and a 1,934sf retail space.
This property could be sold to an investor who might rent the space for $16/sf, for a gross income of $167,424, if taxes and insurance costs are passed along to the tenants in a triple net lease.
Pricing Commercial Real Estate Using Net Operating Income
The price of any investment property, stock or bond, is the present value of future cash flows, adjusted for risk and opportunity costs. The income on commercial real estate is measured by Net Operating Income, which is the income stream generated by the operation of the property, independent of external factors such as financing and income taxes. Gross income includes both rental income and other income such as parking fees, laundry and vending receipts, and any other income. Operating expenses are costs incurred during the operation and maintenance of a property, including repairs and maintenance, as well as insurance, management fees, utilities, supplies, property taxes and others, but excluding principal and interest, capital expenditures, depreciation, and income taxes. For a 10,000 square foot property 100% leased at $10 per square foot producing income of $100,000 annually with expenses of $25,000 annually, the Net Operating Income would be $75,000. If a buyer needs a 9% Cap Rate, the price of the property would be $833,000. If the buyer felt there was more risk than normal and required a 12% cap, the price would be $625,000. If the property were a high quality AAA rated large company such as CVS or Walgreens, the same property with the same income would trade at a 5.5% to 6% Cap Rate since 30 year Treasury Bonds trade at 2.97%, resulting in a price of $1,363,000.
If the investor had to lease the space, the risk of leasing the space would be factored in and there would be an expectation at least a 15% cap rate to assume that risk which would value the property at $500,000, using the formula below.
The seller could be able to command a higher price simply by finding a user of one of the spaces who would buy the property and lease the two remaining spaces. Simply by putting yourself in the buyer's position, you can determine the maximum price a buyer would pay. Here is how it works. A user, for example, of the restaurant is comparing the cash flows of buying versus leasing space. Using the "Law of Substitution", the restaurant owner would compare the alternative of leasing versus buying this property, and the market lease rate is $16.sf, plus $3/sf triple net costs, for an annual lease cost on 4,930sf of $93,670. The buyer could justify purchasing the building if the costs were less than the lease cost. Here is the cost to the potential buyer at various purchase prices. If the potential buyer can lease elsewhere for $93,670 annually, he/she would not be willing to pay a price for the property which would result in a cost of more than that, after taking into account the rental income. The above spreadsheet can be graphed to produce a maximum price which is the intersection of the line of rental cost and the line of net purchase cost.
The maximum price for this property a buyer could justify would be $1,320,000 which would result in a cost of $93,670 annually which is the same as the alternative property lease cost. There are some considerations, such a tax savings from depreciation but that is offset by the tax when the property is sold since the recapture rate is close to the ordinary income rate. There is also the benefit of principal paydown on the mortgage note which is offset by the owner's space cost of taxes and insurance and the maintenance and roof expenses. In summary, the best method to value a property is to put yourself in the most qualified buyer's position and determine what the alternative costs are for the buyer, then price your property using basic financial principals..
Definitions:
"benchmarking"- valuing a property not on the current market value or analysis but on some price you have in your mind that it is worth, based on what you paid for the property or a price someone, somewhere, long ago offered you that you turned down.
"net operating income" - gross income less operating expenses (maintenance, insurance, property taxes, management expenses, utilities) but before income taxes, interest and depreciation.
"sunk cost" - past costs that have already occurred and cannot be recaptured.
"cap rate" - capitalization rate. The rate of return used to value an income stream which can be composed of current and future income or expected capital gain.
copyright 2012 www.louisianacommercialrealty.com.
Last Wednesday, President Obama was the lead story on many television stations, proposing a new plan to eliminate "conflicts of interest" that investment advisors have with their clients.
This begs the question: Can government regulate ethical behavior? This article explores how ethical behavior is incentivized, either on purpose or by neglect, even down to how the real estate industry regulates emails and signs posted that property is for sale.
Shades of Gray: AARP, Secretary of Labor & Vanguard Mutual Funds
In speaking to AARP last week, President Obama said, "Financial advisors...shouldn't be able to take advantage of their clients." What you didn't hear on the news was Secretary of Labor, Tom Perez, discussing "the corrosive power of fine print, hidden fees and conflicted advice" and that the president also promoted Massachusetts Senator Elizabeth Warren, who has been popular since her 2012 election with a platform stating that the financial industry takes advantage of people.
Obama's plan to regulate ethics is to be presented by Labor Secretary Perez, who on a conference call with reporters, was joined by John Bogle, founder of the largest mutual fund family, Vanguard. What you also did not hear is that Vanguard's business model doesn't offer financial advice and Vanguard directly competes with firms that do offer one-on-one education on financial issues. For the average person who wants personal financial education, the best source is often a highly trained, licensed financial advisor. There is always a fascinating story behind the story, and the backstory here is that the new claim for additional government regulation will not work.
The Untold Story: Morris Bart Could Never Be A Financial Advisor
The untold story is that the financial industry is already one of the most heavily regulated industries. Financial advisors only get into the industry after an intensive hiring process where only the most qualified are accepted. Advisors must pass a test to become licensed by FINRA (Financial Industry Regulatory Authority), the not-for-profit organization authorized by Congress to supervise the 637,000 brokers in the US. In addition, each office where the financial advisors are employed has an operations staff that reviews account paperwork and transactions, and most offices have replaced their sales manager with a compliance officer. The accounts of each financial advisor are reviewed regularly to insure compliance with a client's investment objectives, and accounts that are too active receive letters and phone calls from the office's compliance office. Financial advisors cannot send emails or letters to clients without approval and can not use excessive language in any communications.
Morris Bart could never be a financial advisor because he could not imply that all you needed to do was call him to get your money. The reality is that financial advisors are trained to provide a high level of service to clients which encourages referrals which helps them grow their business. Like buying a car or a house, consumers have the responsibility to become educated about their purchases to make the right decision, and in the investment arena the best education on investments can come from your local financial advisor.
The free market is more efficient than government at weeding out the poor performers, if we just let it work. Educated consumers seek out the best service providers, and poor service providers go out of business. That's why businesses are always evolving, trying to provide the highest level of service.
Government Regulates Realtors But Most Of The Training Is Done By NOMAR
The real estate industry is also highly regulated, but not like you thought. Licenses are issued by each state's Real Estate Commission. There is HUD and FHA and FNMA and GNMA but there is no federal government real estate agency regulating real estate agents. Louisiana created its Real Estate Commission in 1920 but it wasn't until 1972 that agents had to pass a test to obtain their license. While the Louisiana Real Estate Commission's main function is to issue the licenses, they are also charged with protecting the public's interest.
The LREC is the only resort for consumer/agent disputes and while every purchase and sale agreement references the parties will abide by the LREC rules regarding deposits, the fact is that the LREC tells parties in deposit disputes to take their claim to court. The only other real estate body is a trade organization, NOMAR (New Orleans Metropolitan Association of Realtors) which was chartered in 1915 by the National Association of Realtors that applies ethical standards only to its paid members.
Rules Lay The Groundwork For Ethical behavior And Tell Us How To Send Emails
The Louisiana Real Estate Commission has adopted Rules and Regulations pursuant to the authority granted in the Louisiana Revised Statutes, Title 37, Section 1435. The Rules and Regulations serve as an extension of the Real Estate License Law and assist the Commission in enforcement. The rules regarding the conduct of agents cover a wide range of topics, including advertising, mold, franchise operations, presentation of offers, and broker cooperation, but nothing about procuring cause, which is widely misunderstood.
The rules lay the groundwork for ethical behavior and agents are required to complete continuing education. The rules are sometimes very detailed, even going as far as explaining how to send emails. In 2012, 14 years after Google was founded but only 12 months after Snapchat, a special section of rules was finally adopted on how to properly use the Internet:
Internet advertising must include the broker's name, city & state, and license jurisdiction.
Emails must include must include the broker's name, city & state, and license jurisdiction.
Advertising by signs must include the following:
Broker name
Phone number
Finally Some Information We Can Use
Nominate a friend's best or worst email signature and get $10 donated in your name to your favorite charity. Send your nomination to roberthand@cox.net.
Interested in graduate school? For a free lesson on configuring email signatures to add pictures and hyperlinks to websites, or icons that link to facebook, twitter or linkedin, send us an email.
Every year, on average, the Corps of Engineers allows 20,000 acres of wetlands to be impacted by developments but at the same time they require 56,000 acres of wetlands to be restored. This article explores how developers protect our wetlands under a program administered by the US Army Corps of Engineers by purchasing mitigation bank credits which offset the impact a development might have on wetlands.
Since New Orleans is technically under sea level, you would expect many real estate developers to be eventually confronted with wetlands on their property, which the Environmental Protection Agency defines as “an area that is regularly saturated by surface water or groundwater and is characterized by a prevalence of vegetation that is adapted for life in saturated soil conditions”. Although these areas make up a very small percentage of the total land found in the United States, Southern Louisiana contains 40 - 45% of the wetlands found in the lower 48 states. This is because Louisiana is the drainage gateway to the Gulf of Mexico for the Lower Mississippi Regional Watershed which drains more than 24 million acres in seven states from southern Illinois to the Gulf of Mexico.
Mitigation Banking
Compensatory mitigation for unavoidable wetland impacts may be accomplished through three distinct mechanisms:
• Permittee-Responsible Mitigation: Restoration, establishment, enhancement or preservation of wetlands undertaken by a permittee in order to compensate for wetland impacts resulting from a specific project. The permittee performs the mitigation after the permit is issued and is ultimately responsible for implementation and success of the mitigation. Permittee-responsible mitigation may occur at the site of the permitted impacts or at an off-site location within the same watershed.
• Mitigation Banking: A wetlands mitigation bank is a wetland area that has been restored, established, enhanced or preserved, which is then set aside to compensate for future conversions of wetlands for development activities. Permittees, upon approval of regulatory agencies, can purchase credits from a mitigation bank to meet their requirements for compensatory mitigation. The value of these “credits” is determined by quantifying the wetland functions or acres restored or created. The bank sponsor is ultimately responsible for the success of the project. Mitigation banking is performed "off-site," meaning it is at a location not on or immediately adjacent to the site of impacts, but within the same watershed. Federal regulations establish a flexible preference for using credits from a mitigation bank over the other compensation mechanisms.
• In-Lieu Fee Mitigation: Mitigation that occurs when a permittee provides funds to an in-lieu-fee sponsor (a public agency or non-profit organization). Usually, the sponsor collects funds from multiple permittees in order to pool the financial resources necessary to build and maintain the mitigation site. The in-lieu fee sponsor is responsible for the success of the mitigation. Like banking, in-lieu fee mitigation is also "off-site," but unlike mitigation banking, it typically occurs after the permitted impacts.
Here’s how mitigation works in real estate development. Let’s say a private developer is building a subdivision on 900 acres of land, of which 300 acres has been declared wetlands by the U.S. Department of Army under the Corps of Engineers. Once federal and state regulatory agencies have agreed that the developer cannot avoid or even minimize the effect on those acres, the developer must compensate – hence, the word mitigation – for the wetlands’ loss by purchasing credits in a mitigation bank.
The mitigation bank is the area that has been restored-not a bank as we know it- and has four distinct components:
1. The bank site: the physical acreage restored, established, enhanced, or preserved;
2. The bank instrument: the formal agreement between the bank owners and regulators establishing liability, performance standards, management and monitoring requirements, and the terms of bank credit approval;
3. The Interagency Review Team (IRT): the interagency team that provides regulatory review, approval, and oversight of the bank; and
4. The service area: the geographic area in which permitted impacts can be compensated for at a given bank.
Before a bank can be permitted, and approved for wetland credit sales, federal and state government regulatory agencies form a Mitigation Banking Review Team (MBRT) that must approve plans for building the bank, from the hydrological and planting design to maintenance and monitoring arrangements. The MBRT also approves the number of mitigation credits that may be earned by the banker.
A developer can buy credits only if they have applied to the federal and/or state agency responsible for wetland permitting, and have provided adequate justification of a need to impact wetlands on their development. Mitigation regulations recommend that the impact and compensation be located in the same watershed and that the impact and mitigation be the same habitat, of similar ecological value or ecologically preferable.
In-Lieu Fee Mitigation
A permit applicant may make a payment to an in-lieu fee program that will conduct wetland, stream or other aquatic resource restoration activities. In-lieu fee programs, as shown in Chart One, are generally administered by government agencies or non-profit organizations that have established an agreement with the regulatory agencies to use in-lieu fee payments collected from permit applicants.
Usually a non-profit organization acts as an intermediary to restore, enhance, create and preserve wetlands and assumes responsibility for their long-term maintenance, earning mitigation credits for their efforts. Non-profits can then sell these mitigation credits to developers who have a permit who must compensate for having impacted wetlands. The sale of wetland credits legally transfers the liability for wetland mitigation from the permittee to the wetland banker.
New Rules
In 2008, the U.S. Army Corps of Engineers adopted new rules that dramatically changed its approach to mitigation under Section 404 of the Clean Water Act, which regulates fill in wetlands and other waters of the United States. The new rules adopt a mitigation hierarchy that moves away from the prior preference for onsite mitigation in favor of mitigation banks and watershed-based mitigation programs. If you wish to obtain a permit to impact wetlands, you must first minimize impacts, and then compensate for unavoidable impacts. The basis for the new rule is that despite progress over the last two decades, there are still gaps in the science of restoration ecology.
The new rule state a permittee must have mitigation plans which include the following:
*objectives
*a mitigation work plan
*site selection criteria
*a maintenance plan
*baseline information (for impact sites)
*credit determination methodology
* performance standards
*a long-term management plan
*site conservation easements
*monitoring requirements
*financial assurances
Source: 1 Federal Register, Guidance for Establishment, Use and Operation of Mitigation Banks, November 28, 1995
Text and images are copyrighted. Contact author for permission.
Louisiana Commercial Realty announced today they were hired to market the 16,000 square foot two-story office building at 739 South Clark Street, near Tulane Avenue and Jefferson Davis Parkway in New Orleans. The building was completely renovated by Ellis Construction and features a unique design including open area for collaborative work flow, cypress flooring, ample controlled parking and large windows allowing light to flow throughout the space.
Tulane Avenue in recent years has experienced a rebirth with more new multi-million dollar developments than any other area of New Orleans, including several large apartment buildings, retail centers, retirement facilities, and the largest hospital development in the United States: the Veterans Administration and the LSU hospitals.
739 south clark
Robert Hand, president of Louisiana Commercial Realty said, ” This is a very special renovation; there is no other building like this in New Orleans. Ellis Construction put real heart into this spectacular renovation, and we think the space is perfect for a growing architectural firm, software design firm, or digital media company. The building is for sale at $2,050,000 and the 2nd floor is also for lease."
Tulane Avenue has witnessed over $1 billion dollars in developments since Hurricane Katrina. Louisiana Commercial Realty has been instrumental in almost all of the Tulane Avenue developments, representing the Domain Company in their development of the 228 unit Crescent Club Apartments, the 72 unit Meridian Apartments, the 183 unit Preserve Apartments, the 18,000 square foot Shops at Crescent Club Retail Center and representing Provident Realty in their development of the 250 unit Marquis Apartments.
More information is available by downloading the 739 South Clark marketing presentation.
Technology has taken a giant leap forward in the last few years by expanding the traditional tool of demographic research into an analysis of lifestyles and consumer spending behavior. The old-school strategy was to look at population count, income, and age to determine a good location for a business. But new-school tools such as leakage factor, retail gap, and Tapestry lifestyle analyses take decision making to a higher level and reduce the risk of failure.
This article examines how these new technologies can help commercial real estate professionals make better real estate decisions. We examine an actual 10 acre tract in New Orleans, utilizing the latest technology of the Certified Commercial Investment Member database to generate sophisticated site analysis information on the best use by examining the lifestyle of the residents in the area — and how they spend their money — to determine what retail businesses were needed.
Drive Times
Typically the target-area population analysis looks at demographics within a radius of 3 miles, 5 miles, and 10 miles. However, a better approach is drive-time analysis, which provides more-useful information when there are natural boundaries to an area: For example, north of New Orleans is Lake Pontchartrain and east of New Orleans is a wetlands area and wildlife preserve.
Within the drive times, knowing the population density, per capita and household income, home ownership, and age brackets helps to determine which retailers might thrive: Brooks Brothers or Dollar General? For multifamily, we can examine how many people rent and are in their 20s, the prime apartment renting age. For example, in the 5- and 10-minute drive times from the target 10-acre site, future growth trends show increases in household formation and income. (See Table 1: Demographic Summary.)
Traffic counts also provide useful data, particularly for retail site analysis. The 2008 traffic study by the Louisiana Department of Transportation showed Interstate 10 traffic in New Orleans East at 34,000 cars per day, and the 2010 estimate from Datametrix (www.stdb.com) is 30,000 cars per day.
Demographics – New School
Market Potential. The Market Potential Index measures the relative likelihood of households in the specified trade area exhibiting certain purchasing patterns compared to the United States as a whole. An MPI of 100 represents the U.S. average; a higher number indicates a higher propensity to spend in that category, compared to the national average. (See Table 2: Market Potential Index.)
Two conclusions can be drawn from consumer spending data. First, the MPI exceeds 100 on seafood and chicken/turkey in both the 5- and 10-minute drive time areas, revealing a higher than average propensity to spend on these items. Second, the population is high enough to support at least four supermarkets, using the market assumption that a 50,000-square-foot supermarket needs approximately 8,000 residents.
We can zero in on how much money residents spend annually in specific categories. For example, within a 5-minute drive time of the site, the total amount of money spent on food at home exceeds $39 million and within a 10-minute drive time exceeds $111 million. We also can drill down to determine what types of items a supermarket could sell to have a competitive advantage. For example, within a 10-minute drive time, $38 million was spent on “snacks and other food at home.” (See Table 3: Specific Spending.)
Retail Opportunity. Using industries categorized by North American Industry Classification System, or NAICS, codes, we can pinpoint where demand exceeds supply and shows a need for a business to fill a void. We determine supply by estimating sales to consumers by establishments, while excluding sales to businesses. We forecast demand, or retail potential, by estimating the expected amount spent by consumers at retail establishments.
The gap between demand and supply is called the leakage factor, which presents a snapshot of retail opportunity. This is a measure of the relationship between supply and demand that ranges from +100 (total leakage) to -100 (total surplus). A positive value represents “leakage” of retail opportunity outside the trade area. A negative value represents a surplus of retail sales, a market where customers are drawn in from outside the trade area.
NAICS represents one of the most profound changes for statistical programs focusing on emerging economic activities. The system groups establishments into industries based on their primary activity. NAICS moves down in detail from sector to subsector to group then to industry. This is an improvement over the previous method, the 1987 Standard Industrial Classification, or SIC, system.
The highest leakage factor shows a need for miscellaneous retailers such as florists, office supply, and pet shops; furniture; sporting goods; clothing; and food stores. (See Table 4: Leakage/Surplus by Subsector.)
The leakage factor shows what businesses are needed, by the percent that demand exceeds supply and the dollar amount of the unfulfilled demand, which can forecast sales for a business coming into the area. Retail Gap Analysis represents the difference between retail potential and retail sales: Industry groups with the largest retail gap in the target area are grocery and food and beverage. (See Table 5.)
Zip Code. Retail Marketplace Reports are available by theme, such as grocery store sales, and can drill down to county, city, zip, census tract, and block group, the smallest unit of measurement of census data. Themes can get very specific, even down to a map of the population that used aluminum foil in the past six months. We searched for grocery store sales by zip codes south and west of the target area that are above $28 million; since there is only one Winn-Dixie store in that area, we know the market will bear additional stores. We can use information on expected sales to right-size building square footage and land area.
Tapestry Reports. Tapestry identifies neighborhood segments and describes the socioeconomic quality of the immediate neighborhood. The index is a comparison of the percent of households or population in the area, by Tapestry segment, to the percent of U.S. households or population by segment. An index of 100 is the U.S. average.
The top two Tapestry segments in the target area are Family Foundations and Metro City Edge. These segments include lifestyle traits such as playing basketball and watching courtroom TV, so we can tailor our advertising around that media rather than newsprint. (See Table 6: Top 10 Tapestry Segments.)
Our use of technology has delivered important information for determining the best businesses for the target 10-acre site while reducing risk of business failure. We have progressed from simply knowing the population count, age, and income to knowing detailed information about who lives in the target area, how they spend their money, and what businesses are missing that could satisfy that demand. We have been able to conclude the target area has the highest unfulfilled demand for furniture, sporting goods, clothing, and food stores, and we have been able to forecast the total sales of a future grocery store and can plan our capital expenses such as store size accordingly. We know what makes the nearby residents unique and where they spend more of their money compared to the average consumer, so we also can lower our inventory costs by stocking the goods with the highest demand. We also can reduce our advertising costs by targeting the media that our customers will use.
These new-school tools are available to everyone facing a real estate decision, not just the Walmarts of the world.
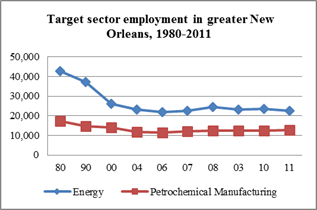
Two out of three ain't bad. The percent of new business start-ups since Katrina has exploded, far outpacing the national average, but the population has continued its shift out of Orleans Parish and government is still the highest job giver. This article examines where the jobs are in the 10 parish region, how we are more productive than the US as a whole, how jobs are leaving Orleans Parish and where they are going.
10 Parish Region
The New Orleans MSA ( Metropolitan Statistical Area) refers to the 7 parish area surrounding New Orleans. A MSA is an area exceeding 50,000 population with a high degree of similarity in social and economic traits. The 10 parish region includes St. James, Tangipahoa & Washington parishes since their economic traits are interwoven.
Jobs By Sector
job chart
Since 2010, four sectors have lost jobs: manufacturing, oil, government and administration services, but government is still the major employer in the 10 parish region around New Orleans with 17% of the nonfarm jobs, followed by wholesale and retail trade at 15% and hospitality at 13%.
Job Distribution
job distribution
Most of the jobs in Orleans and Jefferson Parish fall into three areas: Downtown, Elmwood Shopping Center and Lakeside Shopping Center. Notice the blank area in New Orleans East.
New Orleans Metro Jobs By Parish
jobs by parish
Jobs have been leaving Orleans Parish since 1980. Neither Dutch, Sidney, Marc, C. Ray or Mitch could make any difference. The jobs went to Jefferson Parish and St. Tammany. Looking at the rate of change, Orleans Parish lost 39% of its market share, Jefferson Parish gained 31% of the market share, and St. Tammany gained 275% market share. Job growth is a strategic driver because it leads to housing booms, new demand for office space, new warehouses to store the goods that industry produces and new retailers to sell to the new consumers.
Productivity
productivity
Gross metro product (GMP) measures the average value of goods & services produced by each job in the region. Since 1980, productivity in the New Orleans metro area rose 24%, but the US productivity during the same time period rose 57%. More recently though, the data show a change in trend: since the 2008 recession, productivity has increased far more than the national average.
New Business Start-Ups
New businesses fled the New Orleans metropolitan area for the decade prior to Hurricane Katrina, but then things changed: existing residents decided after Katrina to start their own businesses and the influx of new residents to the area to help rebuild it led lots to stay and open their own business. The percent of new businesses due to Katrina more than doubled, which far exceeded the national trend.
Sources: Bureau of Labor, The Data Center, GNO Inc, LED
Louisiana Commercial Realty announced today they were hired to market the 69,000 square foot tract of land at 5550 Crowder Boulevard for GTE Financial. Robert Hand, president of Louisiana Commercial Realty said, " This tract of land is a great opportunity to bring retail businesses to an underserved market. Our research shows within a 5 minute drive time there is a population of 24,000 with an average household income of $48,000, and there is a real need for businesses to come into the area and provides goods and services to these residents. There are three main businesses that are needed: Motor Vehicle, General Merchandise and Restaurants. Our research shows these businesses could have annual sales exceeding $20 million dollars."
site plan
The area is replete with new developments, including:
New Walgreens at Crowder & Lake Forest Boulevard.
New Dorsey Retail Center on Crowder with tenants Pizza Hut & Planet Fitness.
New 500,000 Wal-Mart on Bullard.
Methodist Hospital on Lake Forest & Read Road in operation.
New Dollar General on Crowder.
Hand says, "With a resurgence of new businesses flooding the area, the quality of life for residents goes up which encourages more residents to move into the area. The Crowder area has the most affordable housing for people looking to build their life. Luxurious homes near the country club are priced around $250,000 and two-bedroom apartments are priced around $850 per month. It's a great place to get started."
Within a 5 minute drive time, the population, according to the 2010 Census, was 20,733 and is forecasted to grow to 29,217 by 2019. This growth rate exceeds 3.5% annually, which is 4 times higher than the average US population growth rate.
Hand says more information is available on the available property at LoopNet.com.
If you want to see Louisiana grow, which jobs would you prefer to bring in: oil or tourism? One of these two top industries delivers twice as many jobs but has one-third of the wages. This article examines jobs and wages, defining what is called Export Jobs which in the long run determine our economic future.
Mardi Gras is a perfect example of the strength of our economy to attract people who spend money on hotel rooms, taxis, car rentals, dining out, the latest fashions, site seeing, voodoo dolls and a host of other unique experiences found only in our nearly 300 year old city. But there is a bigger picture; it's called export jobs. These are the jobs that serve customers outside the region, as opposed to jobs that serve local customers. The reason we define export jobs is because if you have none, your economy is confined to growth of the region. Without export jobs, you can grow no more than the average, which today is around 2 to 3% annually. With export jobs, you have specialized industries that attract jobs from other regions that are void of those industries, resulting in faster than average growth.
Half As Much At Three Times The Price
In the 10 parish region surrounding New Orleans, the highest export job industry is the 40,000 job tourism industry with an average wage of $32,162 annually. Second on the export job list is the oil & gas industry which is less than half the number of jobs at around 18,000 but with average wages of $109,362. Multiplying the number of jobs by the average wages results in an economic wage total of $1.2 billion for tourism and $1.9 billion for Oil & Gas, a 58% difference. The problem is that of all the export industries since 1980, only four (motion picture, higher education, insurance agencies, and legal services) have increased job growth and the other seven are in a state of decline or stagnation. Oil & gas jobs have been leaving the region since the 1980's, and the same for the shipping industry. Katrina killed our shipbuilding industry but boosted construction and engineering.
10 Parish Region Export Industries Since 1980
Increasing Jobs:
Motion Picture
Insurance Agencies
Higher Education
Legal Services
Decreasing Jobs:
Heavy Construction & Engineering
Tourism
Oil & Gas
Shipping
Ship Building
Food Manufacturing
Export Industries In 10 Parish Region
Future Growth Depends On 50 Percent of Jobs
There are 195,507 jobs in the top 10 export industries, compared to 392,736 jobs in other industries, so our future growth depends on 50% of the jobs. The average annual wage of export jobs is $64,540, compared to $42,360 for local jobs. While the future growth may be in the motion picture, higher education, insurance and legal industries, the number of jobs produced still don't surpass ship building. But that is a snapshot of how the economy looks today, and our economy is always evolving and adapting to trends.
Conclusion
One look at the chart above and you can easily determine the downward trends today but also forecast where the job trends might be ten years from now, and it doesn't look good. Looking forward, thank goodness the Louisiana legislature a decade ago passed the Louisiana Motion Picture Act that made the movie industry think of us and thank you to Tulane for spitting out so many lawyers. We will save for later the research on why the insurance industry is growing; but at least we have four great export industries driving growth of the Louisiana economy. If you want to help Louisiana grow, preserve our oil industry and keep churning out petroleum engineering graduates, but also court our motion picture, higher education, insurance and legal industries that could determine our future growth.
Sources: Department of Labor, GNO Inc., The Data Center
Snowden was right. Big data is collecting information on you, but you will be astounded at how the latest technology can help commercial real estate buyers and sellers, landlords and tenants, to not only select the perfect location for their business but reduce advertising expenses and drive sales.
For example, if your business is selling toothbrushes, we can now tell how much people spend monthly on toothbrushes and toothpaste within a 1, 3 and 5 minute drive time from any location in any town, and compare that to the average across the United States.
The old school strategies include traffic counts and demographics, income and age; the new school strategy is Tapestry Lifestyle Behavior Analysis which drills down into how you think, what your beliefs are, and how you live your life.
Click on the link to the podcast that will explain.
Even though Louisiana has a diverse culture and varying economic drivers among its major cities, the range of prices of office space will surprise you. For the most part, office lease prices vary by roughly 20%, from a low of $15.03 in Lake Charles to a high of $19.19 in Harahan, with Shreveport/Bossier city being an outlier around $12.32. Sale prices range from $95.44 to $132.24, a 30% variation.
Office Lease Rate By City In Louisiana
office lease rates by city
Average Office Sale Prices By City In Louisiana
chart office sale prices by city
Does Population Affect Commercial Office Real Estate Price?
Loyola University's Institute of Politics believes Louisiana is divided into three main cultures:
Southern-New Orleans and Cajun country with French influence and driven by tourism and oil.
Middle-Alexandria and the agricultural economy.
Northern-Shreveport/Bossier City to Monroe with industrial and entertainment, so it is often considered an outlier.
The different cultures and population don't have an affect on average lease rates or sale prices, as shown in the table below, because each city has its own supply and demand factors which influence the market price.
Table of Average Lease and Sale Prices With City Population
table lease and sale rates
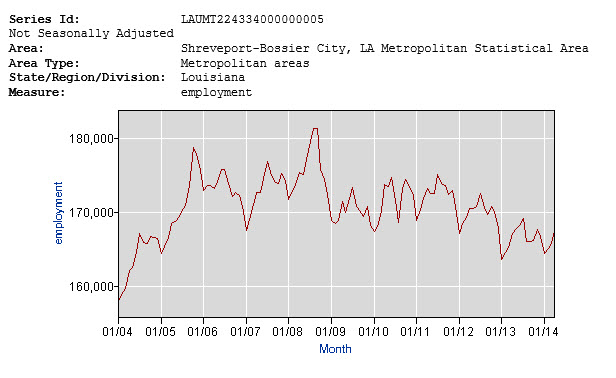
What surprises most people is the average time that it takes to fill empty office space. The fastest average time period is still 10 months, and the time it takes for leasing or selling office property ranges from 330 days in New Orleans to 752 days in Shreveport.
Table of Market Size For Lease and Sale By City With Days On The Market
table sf and dom
Pie Chart-Size Of The Office Market In Louisiana
chart pie office market for lease
Trends In Office Lease and Sale Prices
The best way to determine where prices are heading in the office market is to chart prices in the past. Below are prices for office space, for lease and for sale, by major city.
Lake Charles
The yellow line below shows the Lake Charles average office lease price is at its highest level in 4 years, which at $15.03 is up 5.6% over the last 3 months.
chart office lease lake charles
Kenner
The yellow line below shows the Kenner average office space for lease is up 15.8% year over year at $15.82.
chart office kenner
Harahan
The yellow line below shows the Harahan (zip 70123) average office lease price is at its highest level in 4 years, which at $19.19 is up only 0.3% year over year.
chart office Harahan
Covington
The yellow line below shows the Covington average office sale price is at a steady price of $132.24 and lease prices while fluctuating the last seven years without really going anywhere, average $18.20, down 4.3% year over year.
chart office Covington
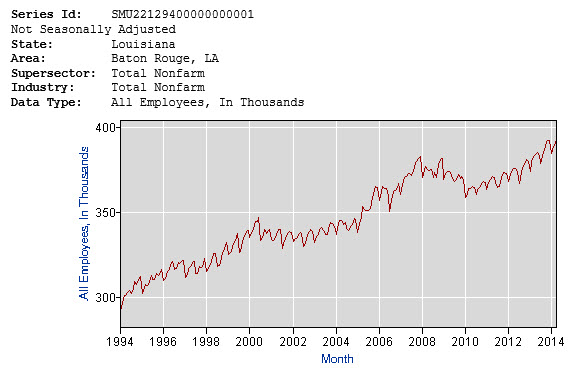
Baton Rouge
The blue line below shows the Baton Rouge average office sale price is at its lowest level in 7 years, which at $97.44 is down 4.5% year over year. The average lease rate at $15.61 is below its $17 peak 4 years ago.
chart office baton rouge
Shreveport
The blue line below shows the Shreveport average office sale price at $79.46 and the yellow line in the lease chart is $12.32, down 2% year over year.
chart office Shreveport
Lafayette
The yellow line below shows the Lafayette average office sale price is steady at $104.21. Average lease rates are not available.
office lafayette
Metairie
Metairie is a small market so for sale price data we use the Metairie/New Orleans Metropolitan average, shown by the blue line below at $113.73, up 8.6% year over year, and the yellow line in the lease chart is $17.48, down from the 2006 peak of $18, but up 4.5% year over year.
chart office Metairie
New Orleans
The yellow line below shows the New Orleans average office sale price at $109.02, up 3.4% year over year, and the yellow line in the lease chart is $16.31, down 0.3% year over year.
chart office new orleans
Summary
Prices vary by city and are based on supply and demand factors unique to economic drivers in the area. Pricing office space is not like pricing stocks and bonds, where there are many buyers and sellers who openly state their bid (buy) price and ask (sell) price, with transactions occurring in the middle when buyers and sellers agree. The best way to determine price levels is examine each property that is available within the same market in the same city, and adjust for differences and quality of the space.
Sources: LACDB, LoopNet, Census 2010, Loyola University
For help determining commercial real estate market prices, see our other articles at www.louisianacommercialrealty.com/blog or contact Robert Hand at 504-289-8172.
Are you a thorough reader? The 1st person to find the spelling, grammar or math error in this article wins $10. Email your error to roberthand@cox.net. Winner is announced in the next article.
jethro bodine ciphering
Whenever Beverly Hillbillies star Jethro Bodine needed to do math, he would commence to ciphering by the cement pond, proving that math can be simple if you have enough fingers and toes. Commercial real estate is sometimes that way but sometimes not. Fortunately, when we need to do some math to answer the simple question, "What is the average price of a full floor of Class A Office space in New Orleans?", the data is easily available and the work has already been done. There is just one catch: you can't get the answer the way you were taught.
Weighting The Average Is Not That Heavy
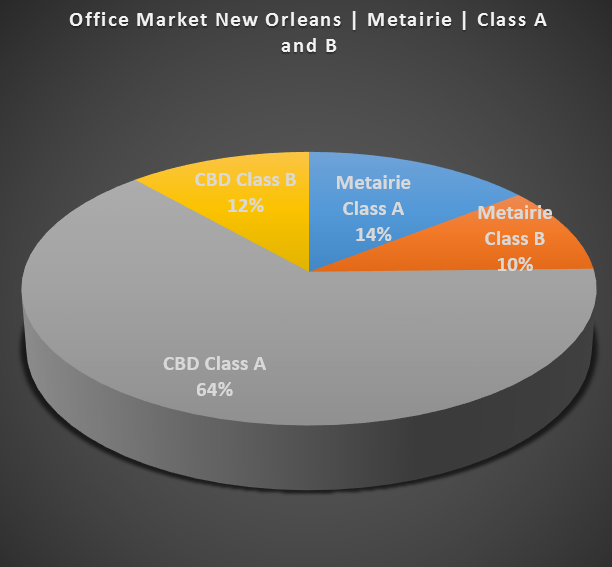
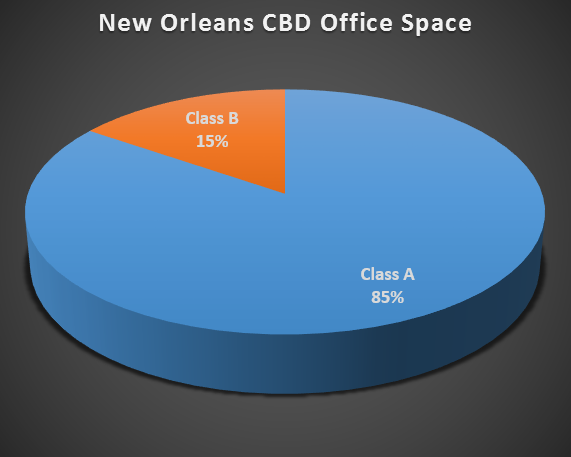
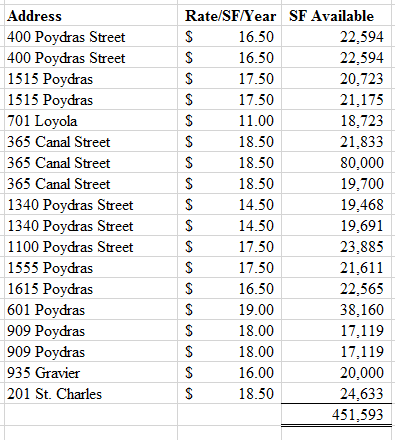
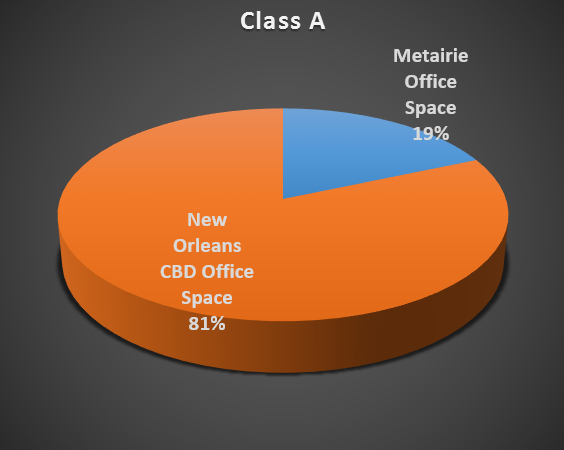
There are 14 Class A office buildings in New Orleans CBD, with a total square footage of approximately 9 million square feet, with one million square feet of that currently for lease, and 428,464 square feet of that comprised of full floor space.
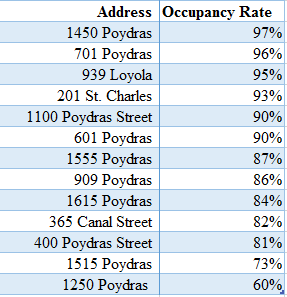
TABLE ONE: New Orleans Class A Full Floor Space
list full floor space
Prices range from $15 per square foot for sublease space to $19 per square foot, and each space varies in how it passes along the cost of taxes, insurance and common area maintenance.
TABLE TWO: List Rates of Class A Office Space
prices full floor Class A
What is the average price? The simple way to determine the average price is to add up all the prices in the table above and divide by 20 ( the number of spaces), but that would not be the most reliable method because it assigns an equal weighting to each of the 20 spaces, as if they all had the same influence on the total square footage of 428,464. The best method for getting the average price is to take into account how much square footage each space has relative to the total. This way the number 15 space at 601 Poydras, which is the largest at 38,160 square feet, has a bigger impact on the final number than does the smallest space, number 5 at 1515 Poydras with only 16,439 square feet.
There Are Only Two Intermediate Steps For The Weighted Average Number
Step 1 is to determine the percent each space is relative to the total. Take the square foot available and divide by the total (in space #1, 22,594 divided by 428,464). Space #1 amounts to about 5.27 percent of the total space. Fill down and you can see that space #15 amounts to 8.9 percent of the total space and, therefore, its price has more weight on the total market than does any other space. Note the total of the weighted square feet equals 1.
TABLE THREE: Weighted Square Feet
weighted price process
Step 2 multiplies the weighted square footage by the listed rate to determine the weighted price for that space. The value for each space is how much that space contributes to the average price, taking into account the amount of square feet contributed to the total square feet. The total of all 20 spaces is $17.264, which is the most reliable answer to "What Is The Average Price?".
TABLE FOUR: Weighted Price
weighted price times SF
Summary
The weighted average method utilized here can provide more reliable results for any sum of data. It works best when there is a large variation in the variables, such as square footage and price. The big surprise is that list prices of Class A office space in the New Orleans CBD are fairly close together, and further adjustments could be made for the variance in terms. While other amenities can affect price and are the judgment of the tenant or landlord, using the weighted average price in negotiations can be a good place to start.
For more information on office space, click on these articles:
The following buildings are deemed Class A but had no full floor space:
1450 Poydras Street
701 Poydras Street
650 Poydras Street
639 Loyola Avenue
Excluded in this analysis but included in previous totals is 701 Loyola, which has a full floor 18,723 square feet in suite 501, but the building is no longer deemed Class A office space.
The Class A office market in New Orleans is 90% leased but the 10% that is vacant is almost half comprised of full floors, and full floors take an eternity to lease since they are configured for a single tenant. Full floors range from 18,000 square feet to 24,000 square feet which can accommodate 50 to 75 employees depending on the configuration.
pie chart full floor
Private Offices Are History
Gone are the days of 10' x 10' private offices, which accommodate the fewest employees per full floor. The modern office configuration has plenty of open desk areas that facilitate collaboration and teamwork, and can accommodate the highest number of employees. Full floor space can be difficult to lease to multiple tenants due to the layout of restrooms, hallways, and conference rooms; therefore, the most likely tenant is a large company with at least 50 employees moving into the downtown area. Even with the 35% payroll rebate as an incentive to media and software companies moving into the city, no full floor space has been leased in the past 6 months and the amount of full floor space has increased 19,000 square feet.
Of the one million square feet of Class A office space for lease in New Orleans, full floor space comprises 447,187 square feet.
chart full floor
Full Floor Space Is A Different Market
The result is that vacancy rates will stay higher for those buildings with empty full floors compared to other Class A office buildings, and lease rates will include a larger amount of free rent and buildout allowance. Once the market reaches equilibrium; however, the buildings that can offer the last Class A full floor space will have the highest pricing power and can command a higher than market rent. The tradeoff is that the present value of the higher rent several years down the road may be less than a lower rent price today.
For more information on the Office Market, see our publications:
The biggest surprise to most sellers of commercial property is that the average time to find a buyer is well over one year. For example, in New Orleans, the average industrial property for sale or lease in the last 24 months has been on the market 510 days. And still counting.
Industrial Properties In New Orleans-Days On Market & Lease Rates
chart industrial days on market
The industrial sector has the longest waiting period. There are 81 industrial properties for sale or lease totaling 1.4 million square feet, with 632,000 square feet for lease and 770,000 square feet for sale. Of the properties on the market today, the average lease rate is $5 PSF and the average sale price is $40 PSF.
It's All Relative
Contrast this with the residential market where in uptown New Orleans the average time it took to find a buyer was 46 days. But that doesn't tell the whole story. Of the 503 residential properties so far in 2014 that sold, 27% sold within 5 days and 5% sold within one day. So the benchmarks we might have for residential property do not apply to commercial property.
503 sold residential days on market
503 sold residential days on market
Time It Takes To Sell Commercial Property Differs By Type
Each type of commercial property has its own supply and demand curve, with the economics of retail and office property making those sectors in higher demand than industrial property; therefore, the days on the market are less but still average almost one year.
There are 381 office properties for sale and for lease totaling 2.7 million square feet with 2 million square feet for lease and 700,000 square feet for sale. Lease prices average $15.60 PSF and sale prices average $64 PSF. The average office property has been on the market for 332 days.
There are 179 retail properties for sale and for lease totaling 915,000 square feet with 600,000 square feet for lease and 300,000 square feet for sale. Retail prices average $14 PSF and sale prices average $118 PSF. The average retail property has been on the market for 336 days.
There are 102 land sites for sale and for lease totaling 119 million square feet with 1 million square feet for lease and 118 million square feet for sale. Lease prices average $1.40 PSF and sale prices average $2 PSF. The average land site has been on the market for 345 days.
days on market commercial sectors
Three Things To Do Today To Sell Or Lease Your Commercial Property
Commercial real estate can provide excellent returns to investors, especially since 30 year US Treasuries only return 4% today. But there is a trade-off, which is liquidity. Given that it takes a long time to sell or lease commercial property, have a plan and a marketing strategy to shorten the time period. Ideas that work include:
Compiling a Marketing Presentation that includes information to create demand for your property, such as zoning and permitted uses.
Getting your property to come up on the first page in a Google search.
Promoting your property locally and also nationally to a target market that is most likely to buy or lease your property.
There are 13,439 active Louisiana real estate agents, but the city with the most and the company with the most will surprise you. The location of real estate agents does not match up identically with the location of the home buying public. For example, New Orleans has the most licensed agents but does not have the highest population count unless you add in Metairie. Shreveport is the 3rd largest agent count in the state but only has the 5th highest population.
Agents and Population Percentages Are One Surprise
The table below ranks the top 15 areas, comparing the number of agents with the population.
Table of Agents and Population
Agent Ranking
Population Ranking
1
New Orleans
BATON ROUGE
2
Baton Rouge
NEW ORLEANS
3
Shreveport
METAIRIE
4
Metairie
LAFAYETTE
5
Lafayette
SHREVEPORT
6
Lake Charles
MANDEVILLE
7
Kenner
SLIDELL
8
Bossier City
LAKE CHARLES
9
Monroe
COVINGTON
10
Alexandria
BOSSIER CITY
11
Houma
DENHAM SPRINGS
12
Marrero
KENNER
13
New Iberia
MONROE
14
Laplace
WEST MONROE
15
Slidell
ALEXANDRIA
Ranking Louisiana cities by the ratio of real estate agent count to population shows that Baton Rouge and Lafayette have the lowest agent count ratios while Denham Springs, Kenner and Monroe have the highest ratios.
Chart by City of Agent Ratio To Population
chart agent count to population
Broker Count In Baton Rouge Is Surprise #2
Agents must have their license held by a broker, as required by the Louisiana Real Estate Commission. The broker is held to a higher standard and requires 150 hours of classroom education in order to become licensed. New Orleans and Baton Rouge are 19% of the market, and the top broker in the state is Latter and Blum with 1,163 agents, but they only have 8.6% of the market.
Who Is The Number One Broker In Louisiana?
BROKERS TOP 20 STATE
The broker market is not only fragmented but localized, with differences in agent count within areas just a few miles apart, as shown in the two tables below which compare the agent count by broker for New Orleans and Metairie.
Who Are The Top 10 Brokers In New Orleans?
table broker count new orleans top 10
Who Are The Top 10 Brokers In Metairie?
TABLE TOP 10 BROKERS METAIRIE
Surprise #3: Top Broker in New Orleans | Metairie Is Not Latter & Blum
In the Metairie and New Orleans combined area, the top broker is actually GBS Properties, known as Gardner Realtors with 318 agents, compared to Latter and Blum with 277 agents.
chart agent count new orleans.metairie
For more information on the real estate industry, choose from over 150 articles at our blog page at LouisianaCommercialRealty.com/blog
The recent census found 1.2 million people live in the New Orleans Metropolitan Area, down only 7% from the 1.3 million in 2000, but the makeup of who lives here and the driving forces of the economy will shock you.
What Jobs Drive The Economy?
Government, hotels / restaurants and hospitals are where the jobs are in Orleans Parish, and in that order. The most jobs per industry are shown in the chart below. The latest technology divides each industry by NAICS code, the North American Industry Classification System, designed by the Office of Management and Budget in 1997 to replace the outdated SIC codes. The chart shows the tourism industry now is the driving force of the economy, with the New Orleans Convention Center bringing in tourists, who spend their money in hotels and restaurants that employ most of the residents who spend their disposable income that further drives the economy. Economists call it a Multiplier Effect. The New Orleans' tourism industry saw 9.28 million visitors in 2013, an increase from 9.01 million in 2012, but visitors spent $6.47 billion, an increase of 4.5% from 2012, and a 45% increase compared to pre-Katrina peak of $4.5 billion spent in 2003.
Who Lives Here Has Changed Dramatically
We have almost as many people living here as in 2000, but the culture has changed. Since 2000, the Census shows that New Orleans has 30% fewer African Americans, 4% fewer Whites, and the major growth demographic has been a 40% rise in the Hispanic population-and that is just in Orleans Parish.
The increase in the Hispanic population is highest in Jefferson Parish with almost 70% growth. Hondurans are 29% of the Hispanic market, which is 7 times the norm for the United States.
A 300 Year Old City Has Lots of Inherited Property
New Orleans is almost 300 years old, so there has been lots of time for generations to pass down their wealth in the form of real estate. Inherited wealth is managed vastly different from created wealth, since there is a hesitancy to take risks such as improve property and adapt to changing uses, which is why there are thousands of properties in New Orleans that have not been put to "the highest and best use". The impact is that opportunities exist to create value where non existed before. The proof of inherited property can be seen in the chart below showing Orleans Parish leads the pack with 45% of the properties having no mortgage, compared to an average of 36% in the United States.
New Driving Forces Mean Extinction For The Status Quo
The changing population means businesses must adapt to the needs of their customers, creating both opportunities for those who have vision, but extinction for the status quo. Here are a few of the opportunities created by the new driving forces:
A new crop of businesses with be created to meet the needs of the exploding Hispanic industry, with growth in ethnic grocery stores, restaurants and clothing stores.
Orleans Parish with its high rental demographic will continue to need new apartments, with developments needed in the downtown area and also in New Orleans East. Older apartments will see reduced rents and will be transformed into shopping centers as new apartments draw tenants.
Real estate will experience a change to "highest and best use" with properties being reinvented into new and creative uses.
There will be new businesses created to serve the tourism industry that we haven't thought of before. Ideas like Uber will flourish. Personal vacation applications with all sorts of features will be created to make the New Orleans experience more dynamic. Technology will be utilized to serve convention goers.
For more information on New Orleans' driving forces, read our article called Economic Drivers in New Orleans-The Petrochemical Industry, and select from over 150 articles on commercial real estate at Louisiana Commercial Realty website blog.
Sources: The Data Center, NAICS, City of New Orleans
Adaptive Re-Use of Strip Retail Center Into Office Space Due To Kenner's Changing Demographics
4224 Williams
Things are changing in Kenner, Louisiana. One of the major trends is how commercial real estate in the area is changing to adapt to the new demographics. According to Robert Hand, president of Louisiana Commercial Realty, "Gone are the high end wine stores and expensive restaurants, and in their place are small, mom and pop, retail stores and ethnic restaurants, driven by a major population shift". The big shift is the Hispanic population which now averages 22.4% of the total population in Kenner, compared to 4.2% in Louisiana. The 2010 Census states the Kenner area had a 55% increase in the Hispanic population since the 2000 Census.
Hand says, "No other group has enjoyed a growth rate that high, and the impact on Kenner businesses is important. It means business owners need to pay attention to the changing needs of the population and adapt to offer goods and services to meet those needs". Two years ago, Hand's firm, Louisiana Commercial Realty, was brought in to find a buyer for a 10,000 square foot retail center at 4224 Williams Boulevard that was vacant. The property was previously a fine dining restaurant, a café and a wine store. All 3 stores had closed. Hand says, "The change in population surrounding the property meant we had to change our marketing strategy. In designing a marketing plan, we researched the demographics and decided the best new use of the retail center was a business that catered to the growing Hispanic population. We had to think out-of-the-box and look at retail use as well as office use. We reached out to grocery store chains, such as Rouses, and encouraged them to open a grocery store catering the unmet needs with ethnic foods. We reached out to doctors and attorneys that solved immigration problems and had a growing business that required more space."
site plan with measurements
The property had several interested parties and a few offers, but none were near the original list price of $1,400,000. Over the last 3 months, the average time on the market for retail property in Jefferson Parish is 719 days, according the LACDB database. Hand spent 2 years marketing the property and negotiated the sale of the property for $870,000 to an attorney with a nearby office and an expanding practice. "By researching the demographics and putting thought into the best use of the property, we were able to focus marketing efforts and deliver results. The buyer got a great deal and the seller got a large lump sum which he can redeploy into an income earning investment."
Pricing Multi-Family commercial real estate in Louisiana is often difficult because the sector includes a wide range of types, from 100 year old plantation housing called shotgun doubles to low-rise garden style to high rise complexes. Each property type contains its own revenue supply and demand line and expense percentage, producing a variety of net operating incomes which affect how a property is priced. This article examines what the average prices are for Multi-Family across Louisiana and details the New Orleans market, and also explains how to price property based on its net operating income.
Market Size of Multi-Family In Louisiana
There is 4.7 million square feet of Multi-Family commercial real estate for sale in Louisiana, on the market for an average 242 days with an average sale price of $43.88 per square foot. The average price can be deceiving since it is biased by high dollar transaction which skew the averages. Of the 125 properties that are on the market, approximately 6 to 7 are sold each month, with the average sale price 11% below the list price.
Doubles vs. Garden Style
Pricing Multi-Family is a function of the net operating income, which is the revenue less expenses, with one exception. If the Multi-Family property is under 4 units, it can be converted into a single family house, and the price should be compared to existing single family homes with the same square footage that could compete with the same buyers.
New Orleans Market Prices
If the property is larger than 4 units, the property should be priced using either net operating income or average unit price. The chart below shows prices for New Orleans Multi-Family per unit (currently $69,000) have been higher than prices per unit across the state (currently $54,000) for the last 8 years.
chart new Orleans
Multi-Family prices peaked in 2008 after a 50% increase, then plummeted with the recession, then rallied, fell and rallied again. Year-to-date in 2014, prices are currently up 19.7% in New Orleans and up 6.6% across Louisiana.
Using Net Operating Income To Value Commercial Property
Whether you are investing in stocks or bonds or real estate or certificates of deposit, you do so to realize a greater future value after inflation. All of these investments have a value determined by two inputs: cash flow and appreciation. With stocks, you might get a dividend and hopefully a capital gain, and with CD’s you get income and no gain, just your principal back, and with bonds you get interest, or cash flow, and principal back at maturity and maybe a gain or loss if the value of the bond trades higher or lower before maturity. With commercial real estate, you get rental income and maybe appreciation when you sell.
The smart way to value all of these investments is to calculate the present value of the future cash flows. That is, what you would pay today for the future income generated by the investment? If you expect to receive $100 one year from now, how much would you pay for that investment today? First, you have to know your opportunity cost, or how much interest you would earn on your next best opportunity. Let’s say you could earn 3% in a CD for one year, then comparing that to an alternative investment for one year that would pay $100, you would divide the $100 by one plus the interest rate (1 +3%), or 1.03, which is the same as $100/1.03 which equals $97.087. Therefore, you would pay $97.087 today for $100 in one year.
To value commercial real estate, you use the same formula:
Value = Net Operating Income Divided By Cap Rate
table gross operating income
You start with the calculation of the Net Operating Income, which is Gross Income less Operating Expenses. Gross Income is the income stream generated by the operation of the property, independent of external factors such as financing and income taxes. It includes both rental income and other income such as parking fees, laundry and vending receipts.
operating expenses
Operating Expenses are costs incurred during the operation and maintenance of a property. They include maintenance and repairs but not long term capital expenses, as well as insurance, accounting, permits, advertising, management fees, utilities, supplies, and property taxes. Smart investors will add in management fees on smaller properties that are managed by the owner for free.
The following are not operating expenses: principal and interest, capital expenditures, depreciation, income taxes, and amortization of loan points. The result is Net Operating Income which is divided by the Cap Rate to determine the price.
Average Revenues and Expenses For Multi-Family
What is the average for Multi-Family Net Operating Income? The National Apartment Association completes a survey each year to determine the average revenues and expenses, as shown in the table below. The first column shows the figures in dollars per unit and the second column shows the same in dollars per square feet.
table revenues and expenses 2013
Cap Rate Averages 3 Percent Over The 10 Year Treasury Rate
According to research from the largest financing institution, Freddie Mac, the Multi-Family sector has average national Cap Rates of 6.40%, and has been trending down since 1995 from its peak at 10%. Note the Cap Rate solid line tracks the 10 year Treasury Rate dotted line.
chart cap rate
In summary, using the tables above to illustrate how to price Multi-Family, the national average Net Operating Income is $5,087 per unit, divided by the national average Cap Rate of 6.40% results in an average per unit price for Multi-Family of $79,484.
For more information on Using Cap Rates, see our article "How To Value Property Using Cap Rates"
You can get Net Operating Income worksheets at the Louisiana chapter of CCIM website.
For a free valuation on Multi-Family property, contact Louisiana Commercial Realty, LLC, at 504-289-8172.
Nationwide, the jobs picture wouldn’t look as good if it weren’t for the energy industry.
Take out the 1.1 million jobs created in Texas, the state that has led in job creation, and the country would be 350,000 below the 2008 peak, according to research by the Federal Reserve Bank of Dallas.
The U.S. economy achieved a milestone in May with employment exceeding the all-time high in January 2008. Yet 29 states have not recovered all the jobs they lost in the recession, according to U.S. Department of Labor data. The weakest employment rebound has been in the states worst hit by the bursting of the 2002-06 housing bubble. Arizona, Florida, and Nevada each remain more than 50,000 jobs short of the employment highs they logged from December 2007 to June 2009.
map GDP by region
1250 poydras front
The largest contiguous Class A office tower space available in New Orleans' Central Business District is being converted to a Hyatt Hotel, according to Robert Hand, president of Louisiana Commercial Realty, LLC, who marketed the 56,000 square feet on three floors at the 1250 Poydras Office Tower, located on the corner of Loyola Avenue and Poydras Street, in downtown New Orleans. The 56,000 square feet on floors 11, 12 and 13 will be combined with existing empty office space on floors 14 through 17, and converted to 194 hotel rooms totaling 134,000 square feet on seven floors and expected to be open for business in 2015.
ENI Petroleum in April 2007 spent $4.7 billion to purchase Dominion Resources who in July 2007 leased five full floors because their space in Dominion Tower at 1450 Poydras Street was unavailable due to Hurricane Katrina. ENI Petroleum eventually moved their employees to Houston, Texas, and the space has been vacant since. Dominion Tower was purchased by Tom Benson, owner of the New Orleans Saints, in September 2009, who renamed it Benson Tower.
ENI initially hired a local real estate firm to find a tenant for the vacant space, but after a year they were still unsuccessful in subleasing the space so they brought in Louisiana Commercial Realty who is known for using sophisticated strategies to market complicated commercial real estate. "The space was strategically located in the center of all the new and exciting activity in downtown New Orleans. There's more activity in this area than anywhere else in downtown New Orleans due the $200 million dollar South Market development," said Robert Hand, president of Louisiana Commercial Realty. "We promoted the space both locally and nationwide, utilizing sophisticated marketing strategies and negotiated a lease buyout which saved our client over $2.5 million dollars. Our research showed the space had what appraisers call a 'higher and better use'. It just makes economic sense, but it is out-of-the box thinking".
Hand says, "Our research also showed that of the 9,000,000 square feet of Class A CBD office space, over 1,000,000 square feet of Class A CBD office space is for lease and half of that is full floor space. With the thriving New Orleans tourism-based economy, there is more demand for hotel use than for full floor Class A office space, so we focused on that target market. Since there was an October 2018 expiration to the original lease, we implemented our expedited marketing strategy which included creating a detailed 20 page marketing presentation, pushing it to 2,900 SIOR and 9,500 CCIM's who are the top commercial real estate agents in country, and connecting with 30,000 commercial real estate brokers and site selection managers and 40,000 office leasing brokers to promote the property. We partnered with Duff & Phelps to reach out to targeted companies who might come to New Orleans to take advantage of the tax incentives. Once we secured an interested party, we drafted and negotiated a lease buyout, saving our client millions in lease expenses. The savings can make an impact to their bottom line and their stock price."
The seven floors of office space will be converted to hotel space and operated by Select Hotels Group, LLC, an affiliate of Hyatt Hotels. The 1250 Poydras building has walkway access to the existing Hyatt Hotel at 601 Loyola Avenue and has access to covered parking, creating synergies between the previous office space and the existing hotel space. The cost of the conversion will be financed by a $120,000,000 loan from Starwood Property Mortgage, LLC, a subsidiary of Starwood Property Trust, the nation's largest commercial mortgage real estate investment trust with a $5 billion capitalization (symbol STWD). The loan is guaranteed by a 60 year lease from the building owner, Poydras Properties, to Waypoint NOLA, LLC.
About Louisiana Commercial Realty LLC
Louisiana Commercial Realty LLC is renowned for its creative problem solving in marketing high value, complicated commercial properties. President Robert Hand is the only commercial real estate broker in Louisiana with an MBA and the CCIM and SIOR designations.
Your commercial property is not worth the appraisal it was written on. That's because an appraisal looks at past prices and your property is worth what a qualified and motivated buyer will pay today, depending on his use of the property. It has little to do with past purchases and uses. That's why a vacant hotel on Canal Street appraised for $9 million and will sell for $4 million.
Buying, selling or leasing Commercial Real Estate is not like buying a stock where there is a published price, with many buyers and sellers creating a competitive market. Market prices can also be widely different from appraisal valuations. That is why knowing current price trends can help you make better decisions on Commercial Real Estate.
Pricing Tailor Made To Your Situation
The chart below shows prices of office property in various markets, ranging from state to Metropolitan Area, County (Parish) to City, and shows the change in prices from 2006. That way, you can derive an opinion of the trend in prices, in your location, in the property type that interests you.
chart office lease price trends Metairie
OFFICE RENT PRICE TRENDS:
Office space for lease is priced per square foot and calculated as an annual expense, so you need to know the square foot of space involved. The typical office is 10 feet by 12 feet. If you are leasing three offices, that is 120 square feet per office, totaling 360 square feet; however, also included can be hallway and restroom calculations. And that is just for the space you use. There is also an added charge for common space, called CAM. For example, if office rents in Metairie average $17.31 per square foot, and you rent 1,000 square feet, the total annual rent is $17,310, or $1,442 per month. CAM charges could easily be $2-$5 per square foot extra. The table below shows the change in lease rates for office property in Metairie, compared to the Parish, New Orleans Metropolitan Area and Louisiana, for the last 3 months and year to date. The Metairie area and the parish have seen prices increase for office property faster than the state average and much faster then the New Orleans area.
table office lease prices
For more information on office leasing including CAM charges, read our article Office Market Trends.
For an FREE analysis on your commercial property or help leasing office space, contact Louisiana Commercial Realty at 504-289-8172.
New Orleans is growing due to superior incentives offered to businesses to relocate here. For example, there is a 25% tax credit for digital media expenditures. That is a dollar-for-dollar tax credit. There is a 50% bonus depreciation and tax exempt financing at a 2% interest rate. There is a tax credit for live performances up to 25% of expenditures. There is a tax credit of 30% which can also be sold on movie expenditures. There is a 39% federal plus a 25% state New Market Tax Credit for development in low income areas. There is a 25% tax credit for Sound Recording expenditures. Here are 14 major incentives and a summary of benefits all in one list.
14 Major Business Incentives Louisiana Offers
1. The Digital Media Incentive provides a tax credit of 25% of qualified production expenditures for state-certified digital interactive productions in Louisiana and 35% tax credit for payroll expenditures for Louisiana residents.
25% tax credit for digital interactive media expenditures made in Louisiana.
35% tax credit on payroll expenditures for Louisiana residents.
No annual cap on tax credits.
The tax credit can be sold or applied against Louisiana income taxes.
2. Economic Development Award Program assists publicly owned infrastructure for industrial or business development projects that promote targeted industry economic development and that require state assistance for basic infrastructure development.
Provides a minimum of $50,000 for publicly owned infrastructure for industrial or business development projects.
3. The Enterprise Zone (EZ) program is a jobs incentive program that provides Louisiana income and franchise tax credits to a business hiring at least 35% of net new jobs from one of four targeted groups. EZs are areas with high unemployment, low income or a high percentage of residents receiving some form of public assistance. A business must create permanent net new jobs at the EZ site. A business is not required to be located in an EZ. A business does not have to invest money, only create additional jobs.
Provides a one-time $2,500 credit per new job.
Rebates 4% sales/use tax on materials, machinery, furniture or equipment.
OR
1.5% Refundable Investment Tax Credit can be earned.
4. The Gulf Opportunity Zone Act of 2005 (GO Zone) provides federal and state tax incentives for business development in parishes most affected by hurricanes Katrina and Rita.
50% Bonus Depreciation Qualified property in the Louisiana GO Zone is eligible for an additional one-time, up-front 50% bonus depreciation.
Tax Exempt Bonds In lieu of using bonus depreciation on investments, most developments in the Louisiana GO Zone qualify for tax exempt bond finance.(subject to availability of bond capacity). Interest rates on GO Zone bonds can be expected to save a borrower 1.5% to 2.5% a year.
5. The Industrial Tax Exemption (ITE) Program provides property tax abatement for up to 10 years on a manufacturer's new investment and annual capitalized additions. This exemption applies to all improvements to the land, buildings, machinery, equipment and any other property that is part of the manufacturing process.
6. The Live Performance Tax Credit program offers a fully transferable tax credit that can be sold or applied against Louisiana tax liability. Tax credits received for infrastructure cannot exceed $10 million per project and are also subject to a $60 million annual cap. There is no annual cap on the production credits. The tax credit value increases with higher levels of certified expenditures, as outlined below:
10% of the base investment for expenditures between $100,000 and $300,000.
20% of the base investment for expenditures between $300,000 and $1 million.
25% of the base investment for expenditures over $1 million.
In addition to the baseline tax credits for live performance production and infrastructure, the producer may also qualify for additional incentives, including:
10% additional tax credit for payroll of Louisiana residents.
Transportation tax credit offered for shipping of live performance-related property.
Opportunities for collaboration with Louisiana's top educational institutions.
7. Mentor-Protégé Tax Credit program enhances Louisiana's business environment for new construction companies. This program provides technical and economic benefits to Louisiana-based contractors who will create and/or retain jobs for Louisiana citizens, expand the state's economy and increase available quality jobs.
With the Mentor-Protégé Tax Credit program Act of 2007, mentor firms can receive Louisiana income or franchise tax credits of up to $50,000 per year by making technical assistance available to a protégé firm.
8. The Modernization Tax Credit program provides a 5% refundable state tax credit for manufacturers making capital investments to modernize or upgrade existing facilities in Louisiana.
Provides a one-time 5% refundable state tax credit on capital expenditures taken over a five-year period (1% per year for five years) for manufacturers making qualified capital investments of at least $5 million.
9. The Motion Picture Industry Development Tax Credit provides a 30% tax credit on qualified motion picture expenditures with no project or program caps. Payroll expenditures for Louisiana residents qualify for an additional 5% tax credit (35% effective total credit rate).
Production incentives fully transferable tax credit of 30% on in-state expenditures related to the production of a motion picture.
An additional 5% tax credit for Louisiana payroll expenditures.
No annual cap or per-project cap on tax credits.
A production company has several ways to use a tax credit:
Tax credits can be applied against any Louisiana income tax liabilities.
Production companies can also claim a direct refund for 85% of the face value of the tax credit from the Louisiana Department of Revenue.
Tax credits can be transferred or sold by a production company to a third party.
10. The New Markets Tax Credit program encourages investment in urban and rural low-income areas to help finance community development projects, stimulate economic growth and create jobs.
Private-sector investors receive credit against federal income taxes. The program allows individual and corporate taxpayers to receive a credit against federal income taxes for making qualified equity investments in Community Development Entities, or CDEs. Credits can be obtained every year the investment is held, for up to seven years of the credit period.
Equity investments in low- to moderate-income areas may qualify for a 39% federal tax credit available through a special federal allocation for the Louisiana Gulf Opportunity Zone.
Qualifying projects may leverage the federal program through an additional 25% state tax credit (64% total credit).
May be used as equity for debt financing.
11. The Quality Jobs (QJ) program provides a cash rebate to companies that create well-paid jobs and promote economic development.
Provides 5% or 6% cash rebate of annual gross payroll for new direct jobs for up to 10 years.
Allows for 4% sales/use tax rebate on capital expenditures.
OR
1.5% investment tax credit for qualified expenses.
12. The Research and Development Tax Credit encourages existing businesses with operating facilities in Louisiana to establish or continue research and development activities within the state.
Louisiana taxpayers who incur research and development expenses may be able to receive credits against state income and corporate franchise taxes.
Taxpayers who employee fewer than 50 Louisiana residents can receive a credit up to 40% of the apportioned amount of their expenditures.
Taxpayers who receive certain federal grants can receive a credit up to 40% of the receipts received.
Taxpayers who claim the federal income tax credit for research activities can receive a credit up to 20% of their apportioned increase in research activities or 25% of their apportioned federal credit, depending on the number of Louisiana resident employees.
13. The Restoration Tax Abatement (RTA) program provides five-year property tax abatement for the expansion, restoration, improvement and development of existing commercial structures and owner-occupied residences.
Grants a five-year deferred assessment of the ad valorem property taxes assessed on renovations and improvements.
Taxes based on assessed valuation of property prior to beginning of improvements.
Equipment that becomes an integral part of that structure can qualify for this exemption.
The program does not exempt the acquisition cost of the structure.
14. The Sound Recording Investor Tax Credit program rebates a 25% refundable tax credit for qualified production expenditures for state-certified sound recording projects.
The Sound Recording Investor Tax Credit program provides a 25% refundable tax credit for qualified production expenditures. The program is subject to a cap of $3 million in tax credits each calendar year. Projects qualifying for the tax credits after the annual cap has been reached will automatically be placed in the queue to receive tax credits in the next calendar year.
The Proof Is In The Pudding
Several top businesses have taken advantage of the incentives and have come to Louisiana, such as:
Gameloft
On August 15, 2011, Gameloft announced it would open a game development studio in New Orleans and deliver at least one new game title developed entirely at the studio in its first year. Employment will grow to nearly 150 jobs at the New Orleans studio in the next few years, with pay averaging more than $60,000, plus benefits.
Electronic Arts
In 2012, the Electronic Arts moved into the newly-constructed 94,000-square-foot Louisiana Digital Media Center on the LSU main campus. EA now employs nearly 500 workers during the school year. In addition to the LSU students who serve in part-time positions at the center, EA has had success recruiting others in the Baton Rouge area to test children's games and casual games more popular with adult women. Game testers at the center in Baton Rouge coordinate work on a daily basis with studios across the globe, including facilities in Stockholm, London and Bucharest.
IBM
"This public-private partnership with LED, IBM and LSU is a powerful example of the triangulation between industry, government and academia that elevates the state's role as a national leader in economic development," said LSU College of Engineering Dean Richard Koubek. "LSU's College of Engineering is committed to developing a mutually beneficial partnership with IBM and LED that stimulates economic growth and helps to meet the workforce development needs of the state."
In addition to long-term workforce solutions, LED offered the company a $17 million grant to reimburse relocation, recruitment and internal training costs; a $5.5 million incentive equivalent to the state's Quality Jobs program for a portion of the IBM center's employment over 10 years; a $5 million grant to offset facility operating costs over 10 years; and the recruitment, screening and training services of LED FastStart®.
LED offered a $30.5 million performance-based grant consisting of state, local and federal funding to build an eight-floor office building as part of a new, mixed-use urban development on Baton Rouge's riverfront. In addition to new Class A office space and 600 dedicated parking spaces, the development would include an 11-floor residential tower and a private recreational terrace joining the buildings above a multilevel parking garage. Leveraging resources of the Baton Rouge Area Foundation, Louisiana secured BRAF’s commitment to build and manage the $55 million total project through its affiliates, the Wilbur Marvin Foundation and Commercial Properties Realty Trust.
General Electric
In February of 2012, Brackett Denniston, GE senior vice president and general counsel, joined state and local leaders to announce the creation of the GE Capital IT Center of Excellence in New Orleans. “We took our time to select a location for this important center,” said Denniston. “We looked all over the country but, after much consideration, New Orleans rose to the top of our list.” The center will be home to 300 high-quality technology jobs and serve as a major resource for GE Capital employees across the nation. Executives announced GE Capital will occupy 60,000 square feet of office space in the New Orleans Central Business District.
For more information, go to www.louisianacommercialrealty.com.
Sources:
LED
Times Picayune NMTC Article
US Treasury NMTC
The largest new hospital development in the United States is the New Orleans 70 acre $2 billion combination of a new Veterans Administration hospital and, just on the other side of South Galvez Street, the new University Medical Center that will replace Charity Hospital which was rendered obsolete by Hurricane Katrina and time.
University Medical Center is 6 Teaching Schools
The University Medical Center will be anchored by LSU, Tulane, Dillard, Xavier, SUNO, Delgado, and other healthcare training schools throughout South Louisiana and will combine academics and science to provide comprehensive treatment and trauma services as well as graduate medical education programs for future generations. Featuring the most advanced technology available, diagnostic and treatment areas of the new, 424-bed UMC, operated by a non-profit governing board, will encompass a wide range of services focused on creating healing environments that support patients and their families.
Map of VA and UMC Hospitals
map street tulane avenue hospitals
Situated on 34 acres on a square bounded by Canal Street, South Galvez, Tulane Avenue and South Claiborne Avenue, the University Medical Center will be the cornerstone of a commercial real estate biomedical district that will attract the world’s top medical professionals while delivering high quality health care, advanced research and Level One trauma care.
University Medical Center Competitive Advantage
In addition to the inpatient services and trauma care, the University Medical Center will host a cancer program including radiation therapy and a chemotherapy clinic; outpatient surgery; outpatient imaging; and rehabilitation services. Treatment areas are being designed to maximize collaboration with the adjacent Veterans Affairs Medical Center by creating efficiencies through the location of adjacent diagnostic services and parallel outpatient services. The University Medical Center is sized to meet projected patient volumes and reasonable growth that accommodates the clinical needs as well as the medical education needs of the state. Filled with natural light, the facility will be easily accessible for patients walking, in wheelchairs, and in beds because of an intuitive layout that includes an easily understood signage system.
The new University Medical Center will be built with structural steel and designed to meet flood-resistant construction standards. First floors of hospital and medical office buildings that house critical functions will be built 22 feet above sea level, well beyond the five-foot Base Flood Elevation for the hospital site. Storm-proofing technology, including robust emergency electrical backup power, will allow the medical center to withstand up to Category Three hurricanes as well as tornadoes, nuclear or biological accidents, physical attacks, fires, chemical, biological and radiation hazards, all while remaining in operation for up to a week with virtually no outside support or backup supplies.
Communication systems for the University Medical Center will consist of active electronic patient record systems that are part of dynamic Local Area and Wireless Data networks that include a variety of telephone, teleconferencing, and nurse call systems. The electronic records system also will connect to Louisiana’s new statewide electronic patient records system, which is in its initial deployment stage.
The combined University Medical Center and VA medical centers are expected to generate an annual $1.26 billion economic impact and create more than 19,700 permanent jobs in the New Orleans area.
Beyond its economic impact, however, the University Medical Center will serve as an important referral center for patients from community hospitals throughout the region. The only hospital in South Louisiana with a Level 1 Trauma Center, the University Medical Center will take on the most severely injured patients. With treatment centers for complex and high-risk patients, the University Medical Center will treat complex disease states with sophisticated healthcare services. Highly trained specialists will provide healthcare unavailable anywhere else in South Louisiana.
UMC Run By Non-Medical Financial Contributors
The University Medical Center is run by an entity called the UMC Management Corporation with 11 members from mostly political sectors. Only 2 of the 11 board members are in the health industry, with the balance on the board due to large financial donations to the nominating entity. For example:
the governor has 4 nominations to the board, with 3 of the 4 from businesses who donate to the governor's political campaign.
LSU has 4 nominations to the board, with all 4 not affiliated with the medical industry but large contributors to LSU, and one in the meat business.
Tulane has only one nomination, a large contributor and real estate developer.
Xavier's one nomination is a contributor and bank president.
Delgado's one nomination is one of the two in the health field, as dean of their Health Division.
Here is the list of board members:
Governor’s Selection
T.A. “Tim” Barfield
Louisiana Secretary of Revenue
Baton Rouge, LA
Donald T. “Boysie” Bollinger
Chairman/CEO Bollinger Machine Shop Shipyard,Inc.
Lockport, LA
Dr. Christopher Rich
Mid--?State Orthopedic & Sports Medicine Center
Alexandria, LA
David R. Voelker
Frantzen--?Voelker--?Conway Investments
New Orleans, LA
LSU’s Selection
Elaine D. Abell
Fountain Memorial Funeral Home and Cemetery
Lafayette, LA
Dr. Byron R. Harrell
Baptist Community Ministries
New Orleans, LA
Stanley Jacobs
Attorney
Jacobs, Manuel & Kain
New Orleans, LA
Robert “Bobby” Yarborough
Manda Fine Meats
Baton Rouge, LA
Tulane’s Selection:
Darryl D. Berger
The Berger Company
New Orleans, LA
Xavier’s Selection:
Alden J. McDonald, Jr.
Liberty Bank & Trust
New Orleans, LA
Delgado's Selection:
Mr. Harold Gaspard
Dean, Allied Health Division
Delgado Community College
New Orleans, LA
Technology has taken a giant leap forward the last few years by expanding the traditional tool of demographic research into an analysis of lifestyles and consumer spending behavior. The old school strategy was to look at population count and income and age to determine a good location for a business, but new school tools such as Leakage Factor, Retail Gap Analysis and Tapestry Lifestyle Analysis take decision making to a higher level and reduce the risk of failure.
This report examines how these new technologies help to make better real estate decisions. Recently, I was asked to market 10 acres of land in New Orleans which was zoned RM-4, the highest density available for multi-family use, but feedback from neighborhood associations and the city council representative showed opposition to new apartment development so I utilized the technology of the Site To Do Business Database on the CCIM.com website to generate sophisticated information on the best use of this 10 acre tract. I was able to examine the lifestyle of the residents in the area and how they spent their money to determine what businesses are needed.
When we analyze the target area population, we look at demographics within a radius: usually 3 miles, 5 miles and 10 miles; however, a better approach is to examine drive times. Drive time analysis provides more useful information when there are natural boundaries to an area; for example, north of New Orleans is Lake Ponchartrain and east of New Orleans is a wetlands area and Wildlife Preserve. The map below is an example of 5 minute (blue), 10 minute (brown) and 15 minute (green) drive times from the target 10 acre site, located in the eastern part of New Orleans.
Demographics - Old School
Within these drive times, we can examine the population density, per capita and household income, home ownership and age brackets. This helps us determine if higher end businesses such as Brooks Brothers might thrive from a higher income population or if Dollar Generals are needed to serve a lower income population. For multi-family, we can examine how many people rent and are in their 20’s, the prime apartment renting age. For example, in the 5 minute drive time from the target 10 acre site, population from 2000 to 2009 declined from 67,717 to 32,391 but is expected to grow to 45,693 by 2014, with renter housing growing from 22% to 32%.
We can further break down the population into income brackets, since a high weighting in one bracket might skew the average annual household income of $40,743. The household growth rate from 2009 to 2014 is among the highest in the U.S. at 7.28%.
The forecasted annual population growth rate from 2009 to 2014 within a 5 minute drive time is 7 times the state and national average (see chart below, Trends 2009-2014).
The 2009 Household Income Pie Chart shows the percent of the population according to income brackets, and The 2009 Population By Race Shows five race categories as well as multiple categories.
We can compare the percent of population by age to the national average. In the target area, we have a lower than average percent of 35-54 year olds but a higher than average percent of under 24 year olds.
Drive times provide a snapshot but we also need to examine future growth of population and income. Within the 5 minute drive time, the population is estimated to grow from 35,217 in 2010 to 45,824 by 2015, and the median household income in 2010 was $43,486. Within a 10 minute drive time, the population is estimated to grow from 114,408 in 2010 to 146,207 by 2015.
Traffic Count
The 2008 traffic study by the Louisiana Department of Transportation (www.dotd.la.gov) showed Interstate 10 traffic in New Orleans East at 34,000 cars per day, and 2010 estimate from Datametrix (www.CCIM.com) is 30,000 cars per day.
Demographics – New School
The Market Potential Index (MPI) is a new tool that measures the relative likelihood of the adults in households in the specified trade area to exhibit certain consumer behavior or purchasing patterns compared to the United States as a whole. An MPI of 100 represents the U.S. average, and a number higher than this means a higher propensity to spend in that category, compared to the national average.
Two conclusions can be drawn from consumer spending data. First, the MPI exceeds 100 on seafood, chicken or turkey in both the 5 and 10 minute drive time, meaning a higher than average propensity to spend on these items. Second, the population is high enough to support at least four supermarkets, using the assumption that a 50,000 square foot supermarket needs a population of approximately 8,000 residents.
We can zero in on how much money residents spend annually in specific categories and a future grocery store needs to know how much money is spent in the Food at Home category. Within a 5 minute drive time, total amount of money spent on food at home exceeds $39,000,000, and within a 10 minute drive time exceeds $111,000,000, but we also drill down in the data to determine what types of items a supermarket could sell to have a competitive advantage. For example, within a 10 minute drive time, there is $38,000,000 spent on snacks for food at home.
Leakage By Industry Subsector- 5 Minute Drive Time
Using industries categorized by NAICS code, we can examine where demand exceeds supply which shows a need for a business to fill a void. We can determine supply by estimating sales to consumers by establishments, while excluding sales to businesses. We forecast demand, or retail potential, by estimating the expected amount spent by consumers at retail establishments. Supply and demand estimates are in current dollars. The gap between demand and supply is called the Leakage Factor, which presents a snapshot of retail opportunity. This is a measure of the relationship between supply and demand that ranges from +100 (total leakage) to -100 (total surplus). A positive value represents ‘leakage’ of retail opportunity outside the trade area. A negative value represents a surplus of retail sales, a market where customers are drawn in from outside the trade area.
Developed in cooperation with Canada and Mexico, NAICS represents one of the most profound changes for statistical programs focusing on emerging economic activities. The system was developed using a production-oriented conceptual framework, grouping establishments into industries based on the activity in which they are primarily engaged. NAICS moves down in detail from Sector to Subsector to Group then to Industry. This is an improvement over the previous method, the 1987 Standard Industrial Classification (SIC) system.
The chart below shows the Leakage Factor by NAICS Subsector for the target area. The highest Leakage Factor shows new businesses needed are:
Miscellaneous Store Retailers-florists, office supply, pet shops
Furniture Stores
Sporting Goods Stores
Clothing Stores
Food Stores
Retail Gap by Industry Group- 5 Minute Drive Time
The Leakage Factor shows what businesses are needed by the percent that demand exceeds supply, but also shows the dollar amount of the unfulfilled demand. This can be used to forecast sales for a business coming into the area. The Retail Gap represents the difference between Retail Potential and Retail Sales. Retail establishments are classified into 27 industry groups in the Retail Trade sector, as well as four industry groups within the Food Services & Drinking Establishments subsector. These data are based upon national propensities to use various products and services, applied to local demographic composition. Usage data were collected in a nationally representative survey of U.S. households, and forecasts for 2010 and 2015 are prepared by ESRI. Table Six shows industry groups with the highest sales (Retail Gap) in the target area are:
Grocery Stores
Food & Beverage Stores
Clothing Stores
Furniture Stores
Grocery Store Sales By Zip Code
Retail Marketplace Reports are available by theme, such as grocery store sales, and we can drill down to county, city, zip, census tract and block group (the smallest unit of measurement of census data). Themes can get very specific, even down to a map of the population that used aluminum foil the last six months. The map below shows grocery store sales by zip codes south and west of the target area are above $28 million and since there is only one Winn Dixie store in that area, we know the market will bear additional stores. We can use information on expected sales to right-size building square footage and land area.
Tapestry – 5 Minute Drive Time
Tapestry identifies neighborhood segments and describes the socioeconomic quality of the immediate neighborhood.The Index is a comparison of the percent of households or population in the area, by Tapestry segment, to the percent of households or population in the United States, by segment.An index of 100 is the U.S. average. The top two Tapestry Segments are:
Family Foundations
Family is the cornerstone of life in Family Foundations communities. A family mix of married couples, single parents, grandparents, and young and adult children populate these small, urban neighborhoods located in large metropolitan areas, primarily in the South and Midwest. This market represents stability. Hardly any household growth has occurred since 2000; these neighborhoods experience little turnover. The median age is 39.0 years; the median household income is $46,308. Most households are single-family structures built before 1970, occupied by owners. Many residents are members of church boards or religious clubs and participate in fund-raising. Basketball is a favorite sport; residents play it, attend professional games, watch games on TV and listen to games on the radio. They watch courtroom TV shows, sports, and news programs on TV and listen to gospel, urban, and jazz radio formats.
Metro City Edge
Metro City Edge residents live in older, suburban neighborhoods of large, metropolitan cities, primarily in the Midwest and South. This market is home to married-couple, single-parent, and multigenerational families. The median age is 29.4 years, and the median household income is $32,291. Nearly half of employed residents work in the service industry. Most households live in single-family dwellings; 14 percent live in buildings with two to four units, many of them duplexes. Homeownership is at 54 percent, and the median home value is $78,213. Prudent shoppers, residents buy household and children's items at superstores and wholesalers. They enjoy watching TV (especially sitcoms and courtroom TV shows), going to the movies, visiting theme parks, roller skating, and playing basketball. They read music, gardening, and baby magazines and listen to urban and gospel radio.
Tapestry – 5 Minute Drive Time
The Top Tapestry Segments Pie Chart shows that the Family Foundations segment is the highest rank in the target area at 21.80% of the population, and we can compare that to the national average at .80% in the table and chart below. The top two segments include lifestyle traits such as playing basketball and watching courtroom TV, so we can tailor our advertising around that media rather than newsprint.
Summary
Our use of technology has delivered important information that will assist us in determining the best businesses for the target 10 acre site while reducing risk of business failure. We have progressed from simply knowing the population count, age and income to knowing detailed information about who lives in the target area, how they spend their money and what businesses are missing that could satisfy that demand. We have been able to conclude the target area has the highest unfulfilled demand for furniture, sporting goods, clothing and food stores, and we have been able to forecast the total sales of a future grocery store and can plan our capital expenses such as store size accordingly. We know what makes the nearby residents unique and where they spend more of their money compared to the average consumer, so we can also lower our inventory costs by stocking the goods with the highest demand. We can also reduce our advertising costs and reduce waste by targeting the media that our customers will use. These new school tools are available to anyone facing a real estate decision, not just the Walmarts of the world, and all you have to do is simply collect the data from a reliable online source and put some thought into the needs of the customers you will serve.
Sources:
ccim.com
dotd.la.gov
www.louisianacommercialrealty.com
“A sum given by the buyer to the seller in connection with a contract to sell is regarded to be a deposit on account of the price, unless the parties have expressly provided otherwise. If the parties stipulate that a sum given by the buyer to the seller is earnest money, either party may recede from the contract, but the buyer who chooses to recede must forfeit the earnest money, and the seller who so chooses must return the earnest money plus an equal amount. When earnest money has been given and a party fails to perform for reasons other than a fortuitous event, that party will be regarded as receding from the contract.”
Need To Know #1: After the due diligence period, the earnest money should become non-refundable, but if the purchaser subsequently wants to cancel and the if the deposit is called earnest money in the purchase agreement, the purchaser can get out of the contract by forfeiting the earnest money. If the purchase agreement does not specify earnest money but uses the term deposit, the purchaser not only loses the deposit but can be sued for specific performance. The earnest money is deemed stipulated damages.
“If the terms of the sale provide for a deposit by the purchaser, this deposit shall not be considered earnest money and does not give the purchaser the right to withdraw from the sale by forfeiting the deposit. However, if the property is resold at the risk of the first purchaser, and a loss is occasioned by such resale, the party provoking the sale may proceed by rule against the first purchaser and the officer conducting the sale to have the deposit turned over to the plaintiff in rule, to the extent of such loss. ”
Need To Know #2: If the seller defaults, the penalty is twice the earnest money; if the buyer defaults, they simply lose their earnest money. The Purchase Agreement spells out what a default is.
If the purchaser wants to terminate the contract within the due diligence period and get the earnest money back, the broker or title company holding the earnest money will require a form to be signed by both the seller and the purchaser. The Louisiana Real Estate Commission states that a broker cannot give a deposit back to a purchaser without a signed cancellation of all parties to the contract. If all parties do not sign the cancellation then a dispute situation arises and the Louisiana Real Estate Commission procedure must be followed; however, the Real Estate Commission does not want to be the institution resolving disputes and the deposit is placed with a court and you will have to file a lawsuit to resolve the issue.
Need to Know #3: Make sure your purchase agreement spells out how the purchaser can get his earnest money back and in how many days and who has to authorize it, as well as conditions of a default.
After the title company accepts your earnest money, they provide the following services:
Determines taxes due.
Determines loan payoffs.
Secures a title commitment, which is a promise to issue an insurance policy on the property.
Explores all public records to discover all recorded documents relating to chain of title, including a property abstract. The chain of title is the history of ownership of the property and follows the property from one person to the next through each will or deed. In Louisiana, we sometimes research back over 100 years of data to make sure there are no ex-spouses still owning the property. The abstract includes deeds, mortgages, wills, lawsuits, liens, tax sales, and all the names of the owners, how long they owned it, and any recorded price they paid for it. The abstract also shows conveyances and encumbrances which can limit developing or changing the property.
Reviews the lender’s requirements and prepares all the paperwork, including the HUD (Housing and Urban Development) closing statement which details the costs for the seller and purchaser.
Need To Know #4: Ask the seller for his title policy. It might provide your closing attorney with information that will save time and will also disclose what the seller paid for the property.
Need to Know #5: In Louisiana, the title insurance is paid by the purchaser, which might be different than other states like Texas where the seller pays the title insurance.
Need To Know #6: In Orleans Parish, property taxes are paid ahead, but in Jefferson Parish, property taxes are paid for the previous year. The taxes are always pro-rated.
Need To Know #7: During the inspection period, secure flood, hazard and general liability insurance that will be required by your lender before closing.
Need To Know #8:New Orleans charges a $325 transfer fee which is normally paid by the purchaser but can be detailed in the purchase agreement as to who will pay. Sometimes purchase agreements are vague as to closing costs so before you sign, revise it to itemize each closing cost and who pays what. Typical closing costs are:
Commission-usually 6% of the sale price, paid by seller but may differ per the purchase agreement.
Lender origination fee-usually 1% of the loan, paid by the purchaser as a cost of borrowing the funds.
Appraisal fee-usually $2,000 to $4,000 for commercial property since it is more complex, paid by the purchaser as a cost from the bank to make the loan.
Flood certification-usually $20, paid by the purchaser.
Environmental Report-a Phase One costs $2,000 to $4,000, and includes research for a written report such as nearby environmental sites but no actual sampling of soil, air or groundwater. A Phase Two can cost $10,000 to $20,000 because it includes collecting samples and measuring for contaminants. A Phase Three includes remediation and can easily exceed $100,000 and take 1-3 years.
Lender’s title insurance-usually $3.50 to $4 per $1,000 of insured value.
Closing fee- usually $500 for the time of the closing attorney to prepare the paperwork.
Need To Know #9: There are two types of title insurance, lender’s and owner’s policies. Lender’s policies are required by every public mortgage lender to protect only the lender against problems, but do not protect a property owner. Buyers must separately purchase an owner’s policy which covers:
Sudden appearance of unknown heirs claiming an interest in the property.
Forged deeds or impersonations.
Incorrect legal descriptions.
Improper recording of deeds.
In summary, knowing these 9 things will help you avoid surprises, give you the upper hand in any re-negotiation you may have to undertake, and help you work toward a smooth closing which moves your project forward.
[1] LA Civ Code 2624 Art. 2624. Deposit, earnest money.
[2] LA Rev Stat § 13:4361 , §4361. Deposit not earnest money; rule to turn over deposit.
[4] Chapter 29 #2901 of the Louisiana Real Estate Commission rules and regulations.
If you are looking for industrial zoned property in Orleans Parish, there are only five areas from which to choose. That's because every one of the industrial zoned areas is near a railroad, a byproduct of 300 years of development in New Orleans.
New Orleans was founded in 1718 and development was fueled by sugar and coffee trading and transportation as the gateway to the Mississippi River. From 1830 to 1840 it became the wealthiest and third most populous city in the nation. The Ponchartrain Railroad was built in 1830 and was one of the earliest in the United States. In 1851 the New Orleans & Jackson Railway north was completed. In 1854 the Southern Pacific west was completed. This convergence of railroads helped spur the growth and caused the development of nearby warehouses to house goods for transport, resulting in five industrial zoning areas.
Five Miles of Wharves Create an Industrial Zone on Tchoupitoulas Street
The Tchoupitoulas area is a five mile strip from Audubon Zoo to the Jackson Street Wharf along Tchoupitoulas Street. Goods are trucked from cargo ships docked at the Nashville Avenue, Henry Clay and Louisiana Street wharves. Shown in the zoning map as sections A-15, B-15 and C-15.
Earhart from Superdome to South Carrollton
Stretching from the downtown area along the current AMTRAK path, this industrial sector continues along Earhart Boulevard to the Carrollton area. Spots in this area have been rezoned for a wide variety of uses, such as multi-family to accommodate the change in demand for affordable housing after Hurricane Katrina in 2005, retail for the 100,000sf Restaurant Depot serving the booming New Orleans hospitality industry, and new warehouses for Mardi Gras floats. Shown in the zoning map as sections B-13, C-13 and C-14.
MId-City
The strip from the Mid-City area stretches from South Claiborne Avenue to Carrollton along Conti and St. Louis and Lafitte Streets, and includes an area behind the current Home Depot facing South Carrollton which previously was a roundhouse, allowing a locomotive to change tracks. Shown in zoning map as sections C-12 and C-13.
Louisa Street Wharf
Starting from the Louisa Street wharf at the Mississippi River, this industrial sector runs north along Press Drive and intersects Franklin Avenue at Almonaster then runs west along Florida Avenue to Gentilly Boulevard near Dilliard University. Shown on zoning map as sections D-12, E-12, D-13.
Largest Industrial Zoning Area Is In New Orleans East
Starting at the Poland Street Wharf, the largest industrial zoned area stretches for 15 miles, first north along the Industrial Canal to Interstate 10, then east along Chef Menteur and Almonaster Boulevard, encompassing the largest section of railroad track in New Orleans. This area includes the NASA Michoud Assembly Center and landfill areas with large tracks of land along Old Gentilly Road. Shown on zoning map as sections E-14, E-13, E-12, F-12, F-13, G-12, G13, H-12 to H14, I-12 to I-14, J-12-J-13, K-12, L-11, L-12 and stops at the swamps in the Bayou Savage National Wildlife Refuge.
Sources:
www.lousianacommercialrealty.com
New Orleans City Planning Commission
New Orleans Among Few Cities Approved For Warehousing Metals
New Orleans is one of only 37 cities in the world approved by the London Metals Exchange to store inventory, which makes owning one of the 600 approved warehouses a good way to take advantage of a market with limited supply and constant demand.
About the London Metals Exchange
Vast quantities of metals are traded at the London Metals Exchange, where buyers and sellers of metals either speculate or just protect their business from rapid price changes. In 2011, the exchange traded 146.6 million lots, equivalent to $15.4 trillion annually and $61 billion on an average business day. The Exchange provides a forum for all trading activity and as a result helps to 'discover' what the price of material will be months and years ahead. This helps any business using these metals to plan forward in a world subject to severe and rapid price movements.
The London Metals Exchange offers a range of futures and options contracts for non-ferrous, minor metals and steel, including:
Contract
Lot Size
Aluminum
25 tons
Aluminum Alloy
20 tons
Copper
25 tons
Lead
25 tons
Nickel
6 tons
Tin
5 tons
Steel Billet
65 tons
Molybdenum
6 tons
Cobalt
1 ton
Source. www.lme.com
From Contracts To Physical Warehousing
Delivery against London Metals Exchange contracts is in the form of warrants, which are bearer documents of title enabling the holder to take possession of a specified parcel of metal at a specified London Metals Exchange approved warehouse. Each London Metals Exchange warrant is for one lot of metal, the tonnage of which is dependent on the contract specification. The front of the London Metals Exchange warrant displays information about the parcel of metal, including its brand, the exact tonnage, the shape and the location. Warrant holders are responsible for payment for storage of material.
Warrants are issued by the warehouse companies at the request of the owner of the metal once it is properly stored in a London Metals Exchange approved warehouse and the warehouse company has ensured conformity with the Special Contract Rules for that metal. These rules include, but are not limited to, the technical specification of the metal, its shape, weight and bundling.
Ultimately, only a relatively small percentage of London Metals Exchange contracts actually result in delivery, as the vast majority of contracts prove to be hedging contracts bought or sold back before falling due for settlement. As a result, the deliveries that do take place, either in or out of warehouse, will reflect the physical market demand and supply, and the information included in the London Metals Exchange’s daily stock reports can play a major part in the market’s assessment of the world’s metals prices.
London Metals Exchange Approved Warehouses
The London Metals Exchange does not own or operate warehouses and nor does it own the material they contain, but authorizes warehouse companies and the warehouses they operate to store approved brands on behalf of warrant holders. Warehouse companies may issue warrants, through their London agent, for material delivered into their approved warehouses. The exchange approves and licenses a network of warehouses and storage facilities around the world which must meet strict criteria before they are approved for the handling of metals. The network is meant to even out swings in volatile metals markets, because during recessions, surplus metal can be stored until economies recover, and when demand picks up the metal can be released.
More than 450 brands of material from over 60 countries are approved as ‘good delivery’ against contracts, and material stored in warehouses must be of an approved producer, such as Freeport McMoran Copper & Gold, conforming to the specifications covering quality, shape and weight as defined by the special contract rules of the London Metals Exchange. London Metals Exchange will only accept applications for the listing of approved warehouses from approved warehouse companies, and inspection of premises offered for warehousing occurs prior to any listing.
60 of the 600 warehouses approved by the London Metals Exchange, which amounts to 10% of the world supply, are based in New Orleans and are listed below:
There are 14 requirements for approved warehouses:
1. Road connection to major highways is mandatory.
2. Rail loading facilities adjacent to the warehouses will be required if, in the opinion of the London Metals Exchange, this service is routinely required by the metals trade. Warehouses without direct rail connections in such locations may be considered for listing if it can be demonstrated that adequate shuttle services to the rail head are provided by the warehouse company at its own cost and risk.
3. Water loading facilities adjacent to the warehouse or otherwise will be treated in the same way as rail.
4. For each 2500m2 of space there must be access by means of an operational door for vehicle loading/unloading, with a minimum of 2 doors per warehouse.
5. The minimum daily delivery tonnage must be in accordance with the table below. Where the delivery requests exceed the minimum daily delivery tonnage for the capacity on the table below, the London Metals Exchange will regard the standard as applying over the number of days necessary to complete the deliveries, as per the table (e.g. if the requests for the delivery of 2000 tons apply to a warehouse’s location capacity of 2500 sq. meters, the standard would be to deliver in 3 days with no reference to the performance on any one of those days). The London Metals Exchange would, however, expect the warehouse company to act reasonably when allocating the tonnage delivered out in each of those days. The daily delivery tonnage is for deliveries out only and does not include deliveries in.
Warehouse Company’s Authorized Space Per Location, In M2
6. The London Metals Exchange recognizes that it may not be possible to achieve exactly the same delivery rates if delivery into containers, vans or railcars is required. In assessing a warehouse company’s performance, the circumstances will be taken into account.
7. Once all formalities permitting delivery have been completed the warehouse shall prioritize all requests for deliveries out on the basis of 48 hours’ notice and strictly in the order in which they are received, unless the Warrant holders seeking cancellation agree otherwise.
8. In addition to their rent and FOT (free on truck) charges, warehouse companies are also required to supply the London Metals Exchange with a comprehensive set of charges for delivery out of warranted metal and will undertake to immediately advise the London Metals Exchange of any changes. Warehouse companies are also required to submit to the London Metals Exchange compulsory port tariffs for the import and export of metal.
9. There should be no charges above the FOT for returning the metal to the warehouse companies approved and nominated loading berths within the location where the London Metals Exchange discerns a need for such transportation; the unloading of such metal from the truck being for the receiver’s account.
10. Similarly there should be no charges above the FOT for returning metal to the nearest railhead where the London Metals Exchange discerns a need for such transportation. With the exception of the FOT charge and port tariffs for the export of metal the warehouse company may not impose any compulsory additional charges when delivering metal out.
11. In the event that an existing approved warehouse/warehouse company does not appear to meet the London Metals Exchange criteria, there will be an initial consultation with the warehouse company concerned.
12. If the warehouse company can demonstrate that it will upgrade facilities or work practices to meet the London Metals Exchange’s new standards, the London Metals Exchange will consider the appropriate amount of time to allow for such a process. Warehouses could, for example, be given 6-12 months to upgrade their facilities or relocate to a more suitable building within the location, but this would be determined on a case by case basis, according to the circumstances.
13. If after consultation the warehouse company is unwilling or unable to upgrade its facilities or work practices to meet London Metals Exchange standards, the exchange retains the right to restrict the capacity of that warehouse company in that location or even delist it.
14. Prior to implementation, the London Metals Exchange would give the necessary notice of any action to be taken to the warehouse company and allow for formal representations to be made.
Rates the owner of LME warranted metal will pay
to the listed warehouse company to store their metal-
Per Ton Per Day In US Cents
Warehouse Company
Copper
Lead
NASAAC
Nickel
Primary Aluminum
Tin
Zinc
Steel
CWT Commodities (USA) LLC
41
41
46
49
45
46
42
/
Henry Bath LLC
39
37
43
48
43
43
39
35
Metro International Trade Services LLC
41
41
46
49
45
46
42
39
NEMS (USA) Inc
41
41
46
49
45
46
42
40
Pacorini Metals USA LLC
41
41
46
49
45
46
42
40
Worldwide Warehouse Solutions LLC
41
41
46
49
45
46
42
/
Warehouse Takeovers
London Metals Exchange rules stipulate that warehouses must deliver a certain amount of metal each day. However the rules apply not to each warehouse but to each city that a company has warehouses in. At the moment, a warehouse operator needs to deliver just 1,500 tons a day per city, whether it owns one warehouse or dozens. In Detroit, that means each warehouse needs to release only 79 tons of aluminum a day. At that rate, it would take two years to clear the stocks held by Goldman's Detroit warehouses.
The backlog sparked outrage last year, prompting the London Metals Exchange to task London-based consultancy Europe Economics to look into its rules. Starting in April, 2012, the minimum delivery rate will double to 3,000 tons a day.
The cash flow of the business has led to a wave of takeovers. Three of the four largest warehouse operators were bought by Goldman, JPMorgan and Baar, Switzerland-based Glencore International Plc in 2010. Metro International added at least 17 warehouses since it was bought by Goldman in February 2010,and JPMorgan took control of Henry Bath & Son Ltd. in July 2010 as part its $1.7 billion acquisition of units of RBS Sempra Commodities.
Glencore, the largest listed commodity trader, said it agreed to buy Pacorini Metals in August 2010 and Hong Kong-based Noble Group Ltd. (NOBL) acquired Delivery Network International LLC the following month. Trafigura Beheer BV, based in Amsterdam, said it bought North European Marine Services Ltd. in March 2010.
Sources:
www.bloomberg.com
www.reuters.com
www.LondonMetalsExchange.com
Forbes
Even though there is much anticipation of spin-off commercial real estate development surrounding the new Veterans Administration and LSU hospitals on Tulane Avenue in New Orleans, there will be no doctor's clinics constructed, no medical offices and no lab testing facilities built to replace the vacant lots and blighted structures. This article details the hospital developments on Tulane Avenue and why the changing business model that hospitals have today eliminates the demand for commercial real estate development.
The Two Hospitals
The Veterans’ Administration has agreed to rebuild its hospital facility adjacent to a new University Medical Center, which replaces Charity Hospital, and is operated by LSU. The VA’s new hospital, offering 200 beds is to be built between Tulane Avenue and Canal Street in the area bounded by South Galvez and South Rocheblave Streets, while the new LSU Hospital is expected to contain 424 beds. The LSU site fronts Tulane Avenue and Canal Street between South Galvez Street and South Claiborne Avenue, and is projected to open in 2015 with the VA facility to follow shortly thereafter. Both developments total $2.4 billion, making them the largest hospital developments in the United States.
The Veterans Administration Hospital
The 30-acre campus for the Veterans Hospital will contain 1.7 million square feet -- about 70 percent larger than Charity Hospital -- with outpatient exam rooms, 200 hospital rooms, 20 intervention and surgery rooms, an emergency department, a research facility, rehabilitation services and a mental health division. The hospital is slated to employ 2,200 people with an average salary of $95,000 annually.
The University Medical Center
The new University Medical Center will replace the 68-year-old Medical Center of Louisiana at New Orleans, which closed following Hurricane Katrina. This new $1.2-billion facility will include a 560,000-square-foot, 424-bed inpatient tower, an adjoining 746,982-square-foot diagnostic and treatment pavilion, an adjacent 254,765-square-foot ambulatory care pavilion and support structures including a 546,413-square-foot, 1,346-car parking structure.
One of LSU's objectives is to build a brand and capture market share by treating heart and cancer patients who now are treated in Houston and other highly regarded specialty facilities out-of-state.
map street tulane avenue hospitals
Misperceptions
With two large hospitals being developed, there is much anticipation by current property owners and speculators for additional developments to sprout up on Tulane Avenue, ranging from clinics so doctors can see their patients to laboratory and testing facilities. None of the developments will occur however, because the business model for hospitals has changed.
Hospitals now want control over their doctors. Dr. Steve Nelson, dean of LSU School of Medicine, noted in a recent speech that hospitals now conduct their business differently in their relationship to doctors who have rights to send patients to the hospital. One example is the clear absence of clinics and doctor's office surrounding Oschner Hospital on Jefferson Highway. There is no need for additional buildings to house a doctor clinic because that service will be provided on the hospital site. The new LSU Hospital will be a teaching hospital and academic medical center with doctor's clinics an on campus building; therefore, there will be no demand for any additional facilities on Tulane Avenue.
What Will Be Developed On Tulane Avenue
There will be a need for retail stores to satisfy demand for shopping, and for restaurants and hotels. However, there may not be demand for commercial real estate that results in a new Veterans Avenue. Both hospitals will house their own retail space including restaurants and stores for shopping.
Just because there is a new development doesn't mean there will be a flurry of shopping centers. Just look at the surrounding demand for shopping and restaurants around Ochsner's biggest campus on Jefferson Highway. There are only three nearby restaurants off campus: a Subway, a Dot's Diner, and a Piccadilly. In addition, a large proposed condo development never got off the ground, and a nearby shopping center failed to have enough demand to stay open.
There is hope for a new hotel in the Tulane Avenue area, but it will be on the hospital site. LSU is currently negotiating to develop a hotel on the campus to handle housing for families of patients. Speculation is whether there will be a need for condos and housing for all the new high income hospital employees. Where will they live? Same place they now live: in Uptown and old Metairie.
The supply of office properties for lease in Orleans Parish has grown over 8.85% annually the last three years, with 1.9 million square feet in 286 properties averaging a lease of four properties per month at $15.62 per square foot. But that doesn't tell the whole story about the trend of the office market in Orleans Parish. By using pivot tables, we can drill down into the data and determine the real trend.
The chart below shows the monthly number of properties available for lease since 2011 in Orleans Parish, with an increase in 2011 of an average of 261 properties to an average of 331 in 2013.
Chart Showing Available Properties For Lease, Monthly Since 2011
The chart below shows the trend in the number of properties leased. Even though the number of properties leased averages around 4 per month, the count skyrocketed in 2013 to 7 per month from around 3 per month in the previous years.
Chart of Properties Leased and Prices Since 2011
Chart Office Properties Leased Orleans Parish Since 2011
Prices of leased properties in Orleans Parish have risen steadily since 2011. Even though prices average $15.63 per square foot, since 2011 prices per square foot have increased 16.5%, or 5.51% annually, from $13.70/sf in 2011 to $15.97/sf in 2013.
Chart of Price of Lease Properties In Orleans Parish Since 2011
Prices of Properties Leased -Orleans Parish Since 2011
Types of Office Properties
The population of office properties for lease encompasses a variety of classes within Orleans Parish. The Building Owners & Managers Association uses the following definitions:
Class A-Most prestigious buildings competing for premier office users with rents above average for the area. Buildings have high quality standard finishes, state of the art systems, exceptional accessibility and a definite market presence.
Class B-Buildings competing for a wide range of users with rents in the average range for the area. Building finishes are fair to good for the area. Building finishes are fair to good for the area and systems are adequate, but the building does not compete with Class A at the same price.
Class C-Buildings competing for tenants requiring functional space at rents below the average for the area.
Class A Office Space Rates
The highest quality office space, and the most expensive, is Class A office tower space in downtown New Orleans, which currently ranges from an asking price of $16.50/sf to $18.50/sf, with up to $30/sf in tenant improvement allowances for long term leases. The table below shows Class A office space for lease exceeding 17,000 square feet, which is usually one complete floor.
New Orleans CBD Exceeding 17,000SF
class a office space for lease
Comparing Markets-Lease Asking Prices
Comparing the lease market in New Orleans, which includes Orleans and Jefferson Parishes, to other markets such as the entire state, the metropolitan area, and Orleans Parish, the chart below shows a decline in prices the last 3 months in all areas, with the state of Louisiana averaging a list price on office space of $15.29/sf and the other areas ranging from $16.23/sf to $16.45/sf.
Chart of Asking Lease Prices In Various Areas In Louisiana
Abutting the Lincoln Manor subdivision, near a shopping mall that Kenner officials hope will thrive, sits a 25-acre tract of commercial property that once was coveted by real estate developers but today looks more like a wildlife refuge. The Home Depot owns the undeveloped land, which is so badly overgrown that weed stalks, some taller than basketball goals, have completely swallowed a stop sign at 31st Street and California Avenue. The Home Depot's land once contained residential subdivisions, but the New Orleans Aviation Board bought out most of the homeowners in the 1990s, to help settle a lawsuit over noise and safety surrounding Louis Armstrong International Airport. The idea, as with all airport buyout property, was to put the land back into commerce.
25 acre site map near Williams and I-10
A spokeswoman for The Home Depot, Meghan Basinger, said the property is worth $25 million. The Home Depot is "aggressively marketing" it for sale and interest has been "steady," she added, but she would not say whether negotiations are currently underway. Yet the property is not listed on either the Louisiana Commercial Database or Loopnet, which are the "two databases where commercial agents list their land if they really want to sell," said Robert Hand, a Louisiana Commercial Realty broker who said he's not had any business with The Home Depot. "They are not reaching 99 percent of buyers," Hand said. "It is imperative that serious sellers have their properties in one of these two databases." The property is the largest of its kind on the market in Jefferson and Orleans parishes, according to Hand's compilation of non-industrial, commercial listings from the two databases. It's also by far the most expensive. The Home Depot's valuation of $1 million per acre, or $22.96 per square foot, is more than 50 percent greater than the highest asking price for the most-expensive non-industrial listing larger than 10 acres. That's a 15-acre site at Mounes Street and Dickory Avenue in Elmwood, going for $15 per square foot. Hand estimated The Home Depot's property could sell for $3 to $5 per square foot, and might take as long as five years to unload. Why would someone pay $25 million when they can get it for $4 million?" -- real estate broker Robert Hand. "There is just no demand for large developments in that area," Hand said. "Why would someone pay $25 million when they can get it for $4 million? The demographics don't warrant that much of a premium. Maybe in the French Quarter."
Until this report, there has not been an analysis of the real estate agents and the appraisers in Louisiana. This report provides a snapshot of both industries and examines who is number one and where they do business.
How Many Real Estate Agents Are There?
There are 13,438 licensed real estate agents in Louisiana, but where they are located will surprise you. The location of real estate agents does not match up identically with the location of the home buying public. For example, New Orleans has the most licensed agents but does not have the highest population count unless you add in Metairie. Shreveport is the 3rd largest agent count in the state but has the 5th highest agent count. The table below compares the ranking of agent count to population.
Table of Agents and Population
Agent Ranking
Population Ranking
1
New Orleans
BATON ROUGE
2
Baton Rouge
NEW ORLEANS
3
Shreveport
METAIRIE
4
Metairie
LAFAYETTE
5
Lafayette
SHREVEPORT
6
Lake Charles
MANDEVILLE
7
Kenner
SLIDELL
8
Bossier City
LAKE CHARLES
9
Monroe
COVINGTON
10
Alexandria
BOSSIER CITY
11
Houma
DENHAM SPRINGS
12
Marrero
KENNER
13
New Iberia
MONROE
14
Laplace
WEST MONROE
15
Slidell
ALEXANDRIA
Ranking Louisiana cities by the ratio of real estate agent count to population shows that Baton Rouge and Lafayette have the lowest agent count ratios while Denham Springs, Kenner and Monroe have the highest ratios.
Chart by City of Agent Ratio To Population
Chart Real Estate Count To Population
Broker Count
Agents must have their license held by a broker, as required by the Louisiana Real Estate Commission. The broker is held to a higher standard and requires 150 hours of classroom education in order to become licensed. There are 10,589 licensed brokers in Louisiana, located near the agent population, with New Orleans and Baton Rouge at 19% of the market. The top broker in the state is Latter and Blum with 1,163 agents, but they only have 8.6% of the market.
Table of Broker Count by City
NEW ORLEANS
1288
BATON ROUGE
1284
METAIRIE
700
LAFAYETTE
563
SHREVEPORT
497
MANDEVILLE
389
SLIDELL
321
LAKE CHARLES
261
COVINGTON
259
DENHAM SPRINGS
233
BOSSIER CITY
224
KENNER
204
Who Is The Number One Broker In Louisiana?
LATTER & BLUM HOLDING, LLC
1163
GBS PROPERTIES, L.L.C. (Gardner)
750
RED STICK PARTNERS, L.L.C.
206
K.W.E.J., L.L.C. (Keller Williams)
205
J. WESLEY DOWLING & ASSOCIATES, L.L.C
204
TEC REALTORS, INC.
191
ACADIANA INVESTMENT GROUP, L.L.C.
171
REALTY EXECUTIVES SB LLC
159
H.O.D.C., L.L.C.
138
PELICAN REAL ESTATE & CONST., INC.
129
GROUP INTEGRITY, LLC
122
GROUP ONE REALTY, L.L.C.
118
The broker market is not only fragmented but localized, with differences in agent count within areas just a few miles apart, as shown in the table below which compares the agent count by broker for New Orleans and Metairie.
Who Are The Top 10 Brokers In The Biggest Market In Louisiana?
NEW ORLEANS TOTAL COUNT
1288
METAIRIE TOTAL COUNT
700
LATTER & BLUM HOLDING, LLC
231
GBS PROPERTIES, L.L.C. (Gardner)
114
GBS PROPERTIES, L.L.C. (Gardner)
204
K.W.E.J., L.L.C. (Keller Williams)
85
H.O.D.C., L.L.C. (Keller Williams)
95
SPECIALIZED REAL ESTATE SERVICES, INC.
50
TEC REALTORS, INC.
42
LATTER & BLUM HOLDING, LLC
46
K.W.E.J., L.L.C. (Keller Williams)
40
H.O.D.C., L.L.C. (Keller Williams)
23
P & M EQUITIES, INCORPORATED
30
REAL ESTATE PARTNERS, INC.
22
WILKINSON & JEANSONNE, L.L.C.
22
TEC REALTORS, INC.
17
DORIAN M. BENNETT, INC.
21
MARK O. RODI & ASSOCIATES, INC.
14
DOWN THE ROAD PARTNERS, LLC
21
REFERRAL ASSOCIATES OF LOUISIANA, INC.
12
LIMITED FUNCTION REFERRAL OFFICE, LLC
21
SRSA COMMERCIAL REAL ESTATE, INC.
12
In the Metairie and New Orleans area combined, the top broker is actually GBS Properties, known as Gardner Realtors with 318 agents, compared to Latter and Blum with 277 agents.
The Appraisal Industry In Louisiana
There are 1,437 appraisers in Louisiana, broken into three licenses:
*Appraiser Trainees receive a license upon passing a test and completing 75 hours of training.
*Residential Appraisers receive a license upon passing a test and completing 3500 hours of training in no less than 2 years.
*General Appraisers receive a license upon passing a test and completing 5000 hours of training in no less than 3 years.
Count of Appraisers In Louisiana by License Type
General
494
Residential
752
Trainees
191
Total
1437
Louisiana General Appraiser Licensees Are Mostly Not In Louisiana
Of the 494 Louisiana General Appraiser Licensees, 265 (53%) are in Louisiana, 18 are in Mississippi, and 43% are in 22 other states. Texas has 126, or 25% of the Louisiana General Appraiser Licensees, with 55 (43%) in Houston and 27 (21%) in Dallas.
APR.CGA - Certified General Appraiser License
494
AL
10
AR
10
AZ
3
CA
5
CO
2
FL
11
GA
14
IL
4
KS
3
LA
265
ME
1
MI
1
MO
6
MS
18
MT
1
NC
1
NJ
2
NY
1
OH
2
SC
2
TN
3
TX
126
VA
1
WA
1
WI
1
The Residential License count tells a different story. Of the 752 Residential Licensees, 93% are in Louisiana, and 97% are in Louisiana and Mississippi, with the remainder in 9 states.
APR.CRA - Certified Residential Appraiser License
752
AL
7
CA
4
CT
1
FL
2
GA
5
LA
701
MS
11
SC
1
TN
1
TX
16
UT
3
Where Are The Appraisers In Louisiana?
Metairie and New Orleans are home to 99 Residential Licensed Appraisers (14% of the state total), with Baton Rouge the 2nd largest market at 68 (9.7%) and Shreveport in 3rrd place at 43 (6.1%). General Licensed appraisers are mostly in the New Orleans/Metairie area with 53 (20% of the state total), followed closely by Baton Rouge at 47 (17.7%), with Lafayette in 3rd with 17 then Shreveport with 15.
Table of Appraisers by City and License
Certified General Appraiser License
494
Certified Residential Appraiser License
752
LA
265
LA
701
BATON ROUGE
47
BATON ROUGE
68
NEW ORLEANS
28
METAIRIE
62
METAIRIE
25
SHREVEPORT
43
LAFAYETTE
17
LAFAYETTE
40
SHREVEPORT
15
NEW ORLEANS
37
MONROE
12
MANDEVILLE
33
ALEXANDRIA
12
SLIDELL
21
Where Are The Appraiser Trainees?
For the 235 Louisiana Licensed Appraiser Trainee Licenses issued, the top 10 cities are:
NEW ORLEANS
24
METAIRIE
18
BATON ROUGE
14
SHREVEPORT
11
LAFAYETTE
9
COVINGTON
6
DENHAM SPRINGS
6
There are several trainees with more than one supervisor, so the number of actual trainees is 191. There are 17 (8.9%) trainees with no supervisor, which means they cannot complete their training and earn their license. Over half of the trainees have not earned their license in the three year minimum time frame, with 40% licensed as trainees longer than 5 years, 22% longer than 7 years and 15% longer than 8 years.
Chart Trainee Transition To Licensing
The Coming Appraiser Shortage In Louisiana
The inability of Licensed Trainees to graduate to a Residential or General License stems from a low percentage of appraisers in Louisiana who utilize trainees to grow their practice. A recent study by the Appraisal Institute shows that on average, 49% of General Licensed Appraisers who perform commercial appraisals and 29% of Residential Licensed Appraisers utilize a full-time Licensed Appraiser Trainee in their practice. The percent of Louisiana Residential or General Appraisers who use a Licensed Appraiser Trainee is only 15%.
Chart Trainee Utilization
Who Is Doing The Training?
The study by the Appraisal Institute in June 2013, showed that 21% of commercial appraisers and 7% of residential appraisers utilized 4 or more trainees in their practice. Of the residential appraisers who utilized trainees, 93% employed 1 to 3 appraisers. In Louisiana, only two of the 966 appraisers in the state utilized 4 or more trainees, resulting in a comparison percentage of 0.21%.
Trainee Utilization In Louisiana Compared To The Average
Chart of Utilization Of 4 Or More Trainees
Sources:
Appraisal Institute, June 28, 2013, study by Appraisal Institute Research Department.
Census Bureau, 2010 survey.
Louisiana Real Estate Commission.
This presentation discusses using the latest technology to help you select a great location for a business. You won’t believe the things businesses know about you, when they are looking to put in a new location in your neighborhood.
New Orleans is almost 300 years old, so classifying and describing commercial real estate can be tricky. That's because New Orleans has 100 year old buildings that look better on the inside than brand spanking new construction. To help with the confusion, many commercial real estate specialists use the building classes defined by the Building Owners and Managers Association which few people understand. Let's review the classes of buildings and clear up the confusion.
Building Class Definitions
For the purposes of comparison, office space is grouped into three classes in accordance with one of two alternative bases: metropolitan and international. These classes represent a subjective quality rating of buildings which indicates the competitive ability of each building to attract similar types of tenants. A combination of factors including rent, building finishes, system standards and efficiency, building amenities, location/accessibility and market perception are used as relative measures. The metropolitan base is for use within an office space market and the international base is for use primarily by investors among many metropolitan markets.
Building amenities include services that are helpful to either office workers or office tenants and whose presence is a convenience within a building or building complex. Examples include food facilities, copying services, express mail collection, physical fitness centers or child care centers. As a rule, amenities are those services provided within a building. The term also includes such issues as the quality of materials used, hardware and finishes, architectural design and detailing and elevator system performance. Services that are available readily to all buildings in a market, such as access to a subway system or proximity to a park or shopping center are usually reflected in the quality of the office market and therefore all buildings are affected. The class of a specific building may be affected by proximity only to the degree that proximity distinguishes the building (favorably or unfavorably) from other buildings in the market. The purpose of the rating system is to encourage standardization of discussion concerning office markets, including individual buildings and to encourage the reporting of office market conditions that differentiate among the classes.
Metropolitan Base Definitions
Class A
Most prestigious buildings competing for premier office users with rents above average for the area. Buildings have high quality standard finishes, state of the art systems, exceptional accessibility and a definite market presence. Covered parking inside the building structure is provided.
Class B
Buildings competing for a wide range of users with rents in the average range for the area. Building finishes are fair to good for the area and systems are adequate, but the building does not compete with Class A at the same price.
Class C
Buildings competing for tenants requiring functional space at rents below the average for the area. Older structures suffering from deferred maintenance.
copyright 2013, www.louisianacommercialrealty.com
Source: BOMA
While the average occupancy of Class A office space in Metairie is 94% and in New Orleans CBD is 88%, why are tenants leaving Metairie to lease space in downtown New Orleans and why are some Class A CBD buildings experiencing occupancy as low as 60%? This analysis answers those questions with graphs of the latest information on the office market in the New Orleans area.
Size of the New Orleans Office Market
There is 13,800,000 square feet of office space in the New Orleans area, composed of the class A market in New Orleans totaling 8,800,000 square feet and Metairie totaling 2,000,000 square feet, and the class B market in New Orleans of 1,600,000 square feet and Metairie totaling 1,400,000 square feet.
pie office market all
The office market can be categorized into class A and class B for New Orleans and Metairie. Marshall and Swift and the Dictionary of Real Estate Appraisal, used by commercial property appraisers, describes class A as "high quality, well-designed, using above average materials and sought by investors and tenants since it is well maintained and managed, with above average rents, making them the most desirable buildings in the market". Class B buildings are defined as "offering useful space without special attractions, and while not unique, have functionality and good layout, with average rents and average to good management and maintenance, and are typically 10 to 50 years old and do not compete with class A buildings at the same price".
Metairie Office Space
The Metairie class A office market is larger than the class B, with rents averaging $23.56 compared to $18.72.
pie metairie office class A vs. B
New Orleans Office Market
The New Orleans office market tells a different story, with class A five times the size of the class B market, with rents averaging $18.59 compared to $16.51. The lower class A rent rate is causing tenants to move from Metairie to downtown New Orleans.
pie CBD market class A vs. B
Lots of Office Space Is For Lease
The New Orleans class A office space totals 8,800,000 square feet, with 1,019,000 for lease. Metairie class A totals 2,000,00 square feet with 97,000 square feet for lease. With lots of class A space available, tenants are moving out of class B office space causing market rates to drop since more space is for lease.
chart percent leased
Half of CBD Class A Office Space For Lease Is Full Floors
Of the 1,019,000 square feet of CBD class A office space, 451,000 is composed of full floor space which takes longer to lease because it requires a company with at least 50 employees looking to move. In 2013, only three companies leased large full floor office space in CBD class A buildings, and only one of the three leased new space, with the other two large spaces leased due to a move from a previous CBD class A space or due to a renewal.
table full floor SF
Comparing Class A Office Space-New Orleans vs. Metairie
The New Orleans market is five times larger than the Metairie class A market.
pie class A
Not All CBD Class A Office Towers Are The Same
Even though the average occupancy rate for class A New Orleans CBD office space is 88 percent, there is a wide dispersion about the mean. The highest occupancy goes to 1450 Poydras Street, owned by Tom Benson, which is 97 percent leased with tenants like the State of Louisiana as part of his negotiations as owner of the New Orleans' Saints. 701 Poydras enjoys 96 percent occupancy due to 600,000 square feet leased to Shell Oil Company. The lowest occupancy rate of 60 percent falls to 1250 Poydras Street, who suffered a departure of FEMA and a major oil company's move to Houston.
cbd occupancy
Purchasing a Mortgage Note Is a Smart Strategy With Overpriced Real Estate
Adjudicated properties are coming to market over the next few weeks, so now is a good time to review how to purchase real estate at rock bottom prices when a property owner has defaulted on the mortgage.
Often commercial real estate properties that are in trouble have defaults by the property owner on mortgages, contractor work, and taxes, in addition to deficiencies by city code and fire code violations. The property owner may not wish to sell because the property's decline in value no longer brings enough cash to cover all the debts. The result is a stalemate where the property is never put to the highest and best use; therefore, debtors no longer receive a return on their investment and the property declines in condition and becomes less valuable.
One solution is to acquire the property by purchasing the mortgage note. The benefit is that once you own the first mortgage note, which gives you the senior lien position, you can foreclose on the property which eliminates all liens on the property, except for tax liens and SBA loans. If you own the mortgage note and the property goes to auction at a Sheriff's sale, the proceeds are paid to you up to the face amount of your note plus interest and fees. If you buy the property at auction, you will pay the Sheriff a 3% fee in Orleans Parish, but you only have to pay the Sheriff the difference between your bid and your note. You may have to bid against other bidders, but if you bid the face value of the note and are outbid, the high bidder makes payment and you receive your note's face amount. If you are the high bidder then you receive the deed from the Sheriff within 30 days.
Here is a diagram of the process:
With 30 year Treasury Bonds yielding 3.79 percent, many investors as well as institutions are considering investing in commercial real estate. How do you know whether the market is right to invest or not? This article presents a strategy for analyzing whether or not it is feasible to develop commercial office property.
Feasibility Rent
The first question you'll need to answer is whether rents are high enough to justify new construction. This concept helps the analyst determine timing, as well as the difference between required rent and market rent based on known costs and expected returns to the investor. The capitalized difference between feasibility rent and market rent represents total depreciation if market rent is less than feasibility rent.
Given the information below, is this project currently feasible?
Market rents in the area are $14/sq. ft. on a triple net-expense basis.
Total cost to construct a new building is $550,000.
Overall capitalization rates for similar properties are 9%.
The quick answer is that the project is feasible. Here is how we get to the answer:
Net Operating Income (IO) = Total price x Overall rate
Feasibility rent =NOI (IO) / NRA
If feasibility rent ? Market rent, the project is feasible
$550,000 X 0.09 = $49,500
$49,500 / 3,700 sq. ft. = $13.38/sq. ft.
$13.38/sq. ft. ? $14.00/sq. ft.
The conclusion is that as long as market rents are above $13.38/square foot, that the project is feasible.
Most Louisiana appraisers licensed in 2013 actually live in Texas.
The appraisal industry in Louisiana is undergoing a significant decline in the number of general licenses issued to Louisiana appraisers while at the same time appraisers in Texas are being hired to perform appraisals in Louisiana. The result is a dying Louisiana industry.
Types of Appraisers
There are 191 Appraiser Trainees who earned a license upon passing a test and completing 75 hours of classroom training. The license permits trainees to write appraisals under direct supervision of a licensed residential or general appraiser who agrees to be responsible for the trainee's conduct and supervise under active, personal and diligent direction. The supervisor agrees to sign all appraisal reports and make sure reports are subject to the Uniform Standards of Professional Appraisal Practice.
There are 752 Residential Appraisers who earned a license upon completion of the Uniform State Certified Residential Real Property Appraiser Examination and 200 classroom hours and 3500 hours of real property appraisal experience in no less than 2 years.
There are 494 General Appraisers who earned a license upon completion of the Uniform State Certified General Real Property Appraiser Examination, 300 classroom hours and 5000 hours of real property appraisal experience in no less than 3 years.
Licenses Issued in 2013
There are 59 licenses issued so far in 2013, as shown in the table below.
Louisiana Licensed Appraiser Count By Year Since 1990
Row Labels
Count of First Issuance Date
1990
119
1991
107
1992
71
1993
58
1994
44
1995
24
1996
32
1997
27
1998
16
1999
21
2000
34
2001
30
2002
33
2003
51
2004
42
2005
49
2006
44
2007
77
2008
78
2009
54
2010
58
2011
62
2012
56
2013
59
Grand Total
1246
Spike in Louisiana Appraiser Licenses After Katrina
New appraisers coming into the industry bottomed at 16 in 1998, and experienced growth after Hurricane Katrina in 2007-2008 to 77 and 78 respectively, then leveled off.
chart LA Licenses
Louisiana Appraiser Licenses Issued To Those Living Here Tell A Different Story
The number of Louisiana licensed appraisers actually living in Louisiana has dropped dramatically since 2007, as shown in the chart below, with a count in 2012 of 20 licenses issued to Louisiana appraisers, the third lowest level since 1990.
chart la licenses residing in Louisiana
Where Do The Louisiana Licensed Appraisers Live?
In 2013, most of the Louisiana Appraisal licenses were issued to people in Texas. Only 27% lived in Louisiana, resulting in appraisal licenses issued to non-Louisiana appraisers totaling 73%.
chart pie 2013 license state
The Conclusion
The free market has spoken. The trend toward bank mergers has shifted the demand curve toward appraisers who can serve many markets. Banks now order appraisals from Texas because they can get several property locations appraised from one appraiser. The price is usually the same from a Texas appraiser as from a Louisiana appraiser at approximately $2,500 for a commercial summary appraisal by a general licensed appraiser.
The loser in this trend is the Appraiser Trainee. Since the license requirement for an Appraisal Trainee is that they obtain experience hours ranging from 2 years for a residential license to 3 years for a general license, and must internship with another licensed appraiser who acts as supervisor, reviewing and agreeing to be responsible for the Trainee's work. Only those appraisers living in Louisiana would agree to supervise a Trainee, and most of the time Trainee must be living in the same town as the supervisor. This result is a reduction of supervisors. This explains why, of the 191 Licensed Appraiser Trainees in Louisiana, approximately 9% are unable to get licensed because they cannot find a supervisor. Over half of the Trainees have not earned either their residential license in the two year minimum time frame or general license in the three year minimum time frame, with 40% licensed as trainees longer than 5 years, 22% longer than 7 years and 15% longer than 8 years.
The purpose of commercial real estate tax credits is to encourage the preservation of historic buildings through incentives to support rehabilitation of historic and older buildings. Since the inception of the Federal Rehabilitation Tax Credit, Louisiana has been a leader in certified tax credit projects, generating over $2 billion in private reinvestment in Louisiana communities. The State Commercial Tax Credit has leveraged more than $350 million in private reinvestment in Louisiana Downtown Development Districts and Cultural Districts. A tax credit is a direct, dollar for dollar, reduction in the amount of money a taxpayer must pay in taxes for a given year. For example, if a taxpayer owes $5,000 in taxes to the Internal Revenue Service, but has a $3,000 credit, he only pays $2,000. Thus he pockets the $3,000 he would otherwise have to pay in taxes. A credit is much better than a deduction which merely reduces a taxpayer’s income and puts him in a lower tax bracket.
Federal Historic Rehabilitation Tax Credit
The Federal Rehabilitation Tax Credit is for 20% of the costs of rehabilitation expenses for an income producing building. The credit is available for income-producing properties that are contributing elements to a National Register Historic District, or individually listed on the National Historic Register. All properties must be certified by the National Park Service. To qualify, the rehabilitation work must exceed the adjusted basis for the building (either the purchase price minus the value of the land, or the current depreciated value).
State Commercial Tax Credit
The building must be a contributing element to a Downtown Development District (DDD) or a Cultural District. The building must be used for an income-producing purpose. Eligible expenses must exceed $10,000. This credit may be used in addition to the Federal Historic Rehabilitation tax credits, provided that the most stringent program requirements are met. It may also be combined with the State Residential Tax Credit Program if the building is mixed-use.
State Residential Tax Credit
Homeowners may qualify for a 25% tax credit (50% for vacant and blighted properties) against their individual state income taxes when they rehabilitate their historic home. The property must be the owner's primary residence. There is a $25,000 credit cap per building, with one credit allowed per building. Rehabilitation costs must exceed $10,000.
Can I Get A Tax Credit After Renovation?
The credit is not automatically available to any owner of an historic building. An application must be filed with DHP. Although not recommended, applications can be accepted after commencement of rehabilitation work. However, the Part 1 or Part A application must be submitted prior to the building’s placement in service.
It is best for an owner not to start construction until after the Part 2 application has been approved. If work is begun without an approved application, the owner proceeds at his own risk. Approval of a rehabilitation project by any other group, organization, or governmental entity does not insure approval by DHP or NPS. All applicants are advised to consult with their tax attorneys and/or certified public accountants in developing projects to determine if the credit will work for you.
Table Summarizing Tax Incentives For Commercial Real Estate
Every day the United States government collects data and nobody likes personal information collected, but there is other information collected that we need which is very helpful, such as data used in determining the health of the economy. One of the most important numbers collected by the Department of Labor is how many people are out of work broken down by major city, and the latest data are in.
Unemployment Rate For April 2014 Was 5.9 Percent
April's preliminary national unemployment rate in April was 5.9 percent, not seasonally adjusted, down from 7.1 percent a year earlier, and down from March's unemployment rate of 6.3 percent. For seasonally adjusted numbers, the unemployment rate fell from 6.7 percent to 6.3 percent, and the number of unemployed persons, at 9.8 million, decreased by 733,000.
Unemployment rates were lower in April than a year earlier in 95 percent, or 357 of the 372 metropolitan areas, higher in 12 areas, and unchanged in 3 areas, according to the U.S. Bureau of Labor Statistics. Not all areas enjoyed a reduction in the number of people out of work since 14 areas had jobless rates of at least 10.0 percent while 118 areas, or 31 percent, had rates of less than 5.0 percent.
chart unemployment rate
Numbers May Lie
The unemployment rate is based on the number of unemployed divided by the number in the workforce, so if the number unemployed declines but the number in the workforce declines by a greater percent, then the ratio, or unemployment rate, can actually decline even though there are more people unemployed. One way to derive a realistic conclusion is to examine the actual number employed, and nonfarm payroll employment increased over the year in 302 metropolitan areas, decreased in 17 percent or 63 areas, and was unchanged in 7 areas.
Better or Worse
Highest unemployment rate: Yuma, Arizona at 23.8 percent.
Lowest unemployment rate: Midland, Texas at 2.8 percent.
About 58 percent of the 372 metropolitan areas had unemployment rates better than the US average, and 40 percent had rates worse than average, as shown in the chart below.
chart unemployment rate better or worse than average
Unemployment Rate In Louisiana's Major Cities
Looking closer to home, the major cities in Louisiana show the oil patch is still the best place to find a job. The lowest unemployment rate is found in Houma, Lake Charles and Lafayette.
chart louisiana cities unemployment may 2014
A 10 Year Look At The Number of People Employed In Louisiana's Major Cities
While the number of people employed varies since each major city in Louisiana varies greatly in population, the employment growth rate in each city tells a more realistic story because it can highlight where supply and demand imbalances might exist in resources which can expose opportunities. The charts below shows the trend in each city's employment.
HOUMA
houma
LAFAYETTE
lafayette
LAKE CHARLES
lake charles
BATON ROUGE
baton rouge
NEW ORLEANS
New Orleans
ALEXANDRIA
alexandria
MONROE
monroe
SHREVEPORT
shreveport
5 Year Snapshot
The last 5 years of employment can impact decision making more than any other period, and the difference in employment growth can be categorized by who is getting better or worse:
Growth In Employment: Houma, Lafayette, lake Charles, Baton Rouge
Stagnant In Employment: New Orleans
Declines In Employment: Alexandria, Shreveport
Next Release
The Regional and State Employment and Unemployment news release for May is scheduled to be released on Friday, June 20, 2014, at 10:00 a.m. (EDT). The Metropolitan Area Employment and Unemployment news release for May is scheduled to be released on Tuesday, July 1, 2014, at 10:00 a.m. (EDT).
While the number of people out of work in Louisiana is one of the lowest in the U.S., the biggest city in Louisiana suffers from a decline in jobs, not just since Katrina, but going back at least twenty years.
The actual number of people employed in the New Orleans area is lower than it was twenty years ago, according to The Bureau of Labor Statistics, which tracks employment in each state and further breaks down the employment into Metropolitan Areas such as New Orleans.
The data in the table below shows during the 20 year period from March 1994 to the most recent figures of April 2014 that the New Orleans | Kenner | Metairie area experienced a decline in employment of 12,000 people, from 563,000 to 551,000 non-farm employment, not seasonally adjusted. The not seasonally adjusted numbers are the most current.
Table of Employment For New Orleans | Metairie| Kenner, 1994 to 2014
new orleans employment 1994 to 2014
Employment in New Orleans did have a couple of growth periods: first, the two year period from 1996 to 1998, and, second, the recent four year period from 2010. The rest of the twenty year time span saw employment stagnant for almost a decade from 1997 to 2005, then the 25% decline in 2005-2006 due to Katrina, a bounce back of 15% in 2007-2008, then flat to down employment until 2010, as in the chart below.
chart employment 1994 to 2014, New Orleans area
Employment Compared To The State of Louisiana
During the last 20 years, the state of Louisiana has grown employment by 268,000, from 1,699,000 to 1,967,000, a change of 15.77 percent.
Louisiana employment over 20 years
Alexandria Employment
During the last 20 years, Alexandria has grown employment by 10,000, from 52,000 to 62,000, a change of 19.23 percent.
Alexandria employment over 20 years
Baton Rouge Employment
During the last 20 years, Baton Rouge has grown employment by 93,000, from 301,000 to 394,000, a change of 30 percent.
baton rouge employment over 20 years
Houma Employment
During the last 20 years, has grown employment by 38,000, from 62,000 to 100,000, a change of 61 percent.
houma employment over last 20 years
Lafayette Employment
During the last 20 years, Lafayette has grown employment by 55,000, from 107,000 to 162,000, a change of 51 percent.
lafayette employment over last 20 years
Lake Charles Employment
During the last 20 years, Lake Charles has grown employment by 15,000, from 79,000 to 94,000, a change of 19 percent.
lake charles employment over the last 20 years
Monroe Employment
During the last 20 years, Monroe has grown employment by 12,000, from 66,000 to 78,000, a change of 18 percent.
monroe employment over the last 20 years
Shreveport Employment
During the last 20 years, Shreveport has grown employment by 23,000, from 148,000 to 171,000, a change of 15 percent.
shreveport employment the last 20 years
Growth of Employment The Last 12 Months
Even through the state of Louisiana currently reports one of the lowest unemployment rates in the nation at 4.5 percent, not all areas of Louisiana have grown their employment the last 12 months. For example, Shreveport suffers from a reversal of the Haynesville Shale boom, and Alexandria experienced the largest decline at 0.6 percent. The biggest improvement in employment the last 12 months has been in Lake Charles, followed by Houma, Baton Rouge and Lafayette, as shown in the chart below.
chart employment growth last 12 months
All data is current and from the Bureau of Labor Statistics.
Commercial real estate valuation differs from stock and bond valuations because ral estate often has fewer buyers, only one seller, little comparable properties and location biases, compared to pricing a share of stock which is quoted visibly and enjoys hundreds of trades every minute. If commercial real estate information was more widespread and there were more buyers and sellers, properties would be easier to value. However real estate is not a purely competitive market where there is transparent information available to all and many buyers and sellers. Often there are no comparable properties for sale and no comparable properties sold in the past few years. The result is difficulty in pricing commercial real estate. One solution is to use math to calculate a regression formula to value property, based on variables such as building size and land.
Three Common Methods of Pricing Properties
The Cost Approach of valuation was ineffective in this situation because nobody could estimate the cost of rebuilding due to the difficulty in finding laborers. The Income Capitalization method was useless because properties produced no income since most tenants had defaulted on their leases. One method that worked was the Sales Comparison Approach, but the downside of this method is that it is based on the Principle of Substitution which makes the assumption that adjustments need to be made for some unusual differences in comparable properties. After the Katrina disaster, the adjustments were not your normal factors: it might be whether the property was flooded or not, was it flooded 3 feet or ten feet, does it have electricity, or is there a roof. In order to have an accurate selling price, you’ll need to have accurately adjusted for differences. After a disaster, however, the unique differences in comparable properties may have changed dramatically, resulting in a need to utilize an alternative pricing method. One method is a statistical strategy called regression analysis, which can be used to forecast price with a high degree of confidence.
Let’s examine how to value a flooded 92,000 SF warehouse on 271,000 SF land, just weeks after Hurricane Katrina. Market conditions at the time for industrial property were mixed, with an increase in demand for leasing warehouse space, but a decrease in demand for purchasing warehouse space because few buyers could commit capital to unpredictable demographics. Market supply had dramatically fallen which offset some drop in demand. The target property was impacted by high winds and was flooded with three feet of water; like most property in New Orleans, the water stayed on the property for two weeks. Part of the target property was intact because it was concrete block structure, and part of the warehouse needed to be re-skinned since it was a metal frame. The property had roof damage and all the copper wiring was stripped by vandals. Normally, these conditions would make the property undesirable, but due to Katrina, industrial property was uniformly in this condition. When comparable properties are homogenous, the regression method of forecasting produces a reliable result.
Predicting Price Based on Average Price Per Square Foot
In determining our price of the target property, we are using real data in the accompanying table (Table One). The prices are from a sample of warehouses which were available in New Orleans following Hurricane Katrina. For each property, the selling price, the size of the warehouse, and the size of the parcel of land are shown.
Table One
Comparable Warehouse Properties
Size
(square feet)
Price ($)
per square foot
Selling
price ($)
Building
Lot
Building
Lot
1
1,700,000
40,000
261,000
42.50
6.51
2
1,000,000
20,000
100,000
50.00
10.00
3
4,500,000
60,000
212,000
75.00
21.23
4
2,100,000
70,000
70,000
30.00
30.00
5
800,000
22,000
25,000
36.36
32.00
6
2,000,000
50,000
60,000
40.00
33.33
7
5,800,000
54,000
352,000
107.41
16.48
8
1,750,000
82,000
123,000
21.34
14.23
9
769,000
18,000
27,000
42.72
28.48
10
2,650,000
41,624
60,984
63.67
43.45
11
1,600,000
33,534
47,195
47.71
33.90
12
360,000
14,924
33,000
24.12
10.91
13
325,000
6,121
12,278
53.10
26.47
14
215,000
7,980
14,375
26.94
14.96
15
2,860,000
101,500
141,960
28.18
20.15
Average
45.94
22.81
Margin of Error
9.61
4.54
Many property owners would use this market information to conclude that since the average price of land is $22.81/SF, the predicted price for 271,000 square feet of land is $6,181,510, but that estimate rarely works accurately in real life. A cautious buyer has to wonder if the average price in the table might be somehow unusual and not truly representative of the market. What can make the predicted price more reliable?
The reliability of an average can be assessed by measuring its precision. Consider two sets of numbers: one set is 30, 50, and 70 and the other set is 49, 50, and 51. In both cases, 50 is an accurate measure of the average; however in the second case, the average is more precise – here’s why. When the results of a poll are reported, a "margin of error" often is given. For example, a poll may show that 48% of people prefer candidate A over candidate B with a margin of error of +/- 3%. The margin of error measures the precision of the estimate, 48%. If the estimate is precise, then the margin of error is small. The margin of error of +/- 3% indicates that the true percentage of people who prefer candidate A is very likely to fall between 45% and 51%.
Note the margins of error for the estimates of the average price per square foot of floor space (9.61) and the average price per square foot of land (4.54) in the table. Because the margin is greater for building size, the average lot size is probably a more reliable number to use when estimating value.
Predicting Price Based on Regression
The use of regression analysis and a forecasting method called linear regression is illustrated in the accompanying graph. Each property in the table is represented by a dot, and selling price is plotted against the size of the lot. By themselves, graphs can be very informative; for example, the graph confirms that price increases with lot size, and the slope explains by how much. The graph also provides a general impression of the extent of the “scatter” of the data points: you can see that data points tend to be clustered together when lot size is small, and you can easily see outliers, or unusual data points.
Regression analysis uses math to provide a line that best fits the data. The green line on the graph shows the relationship between price and lot size, assuming an average price of $22.81 per square foot of land. The solid brown line represents the line of best fit. If y represents price and x represents the size of the lot, then the solid line is described by the equation y = Ax + B. When you calculate a regression formula for these data, A is $12.77 per square foot of land and B is about $584,000. A is an estimate of the rate of increase in price as the lot size increases. B estimates the baseline price ($584,000), which is the price of a warehouse property as the lot size decreases to zero.
For a warehouse situated on 271,000 square feet of land, the predicted price is y = (12.77)(271,000) + 584,000 = $4,044,670. This is $2 million below the price predicted using the average price per square foot of land ($6,181,510). Regression analysis can provide a more sophisticated method of forecasting price of any property, and it is more useful because you plug in your square footage for the variable x, and the result is the price. This formula also explains with every one square foot increase in land size, the price increases $12.77.
Regression analysis can also show how lot size affects price. The value of R2 is often used to measure the precision of a regression line in the same way that the margin of error is often used to measure the precision of an average. The value of R2 can vary between 0 and 1. In this example, R2 measures the proportion of the variation in price that is explained by lot size. If R2 = 0, then the regression line has no precision and lot size explains none of the variation in price. If R2 = 1, then the regression line is extremely precise and variation in price is explained entirely by lot size. In our example, R2 = 0.67, which indicates that lot size explains 67% of the variation in price. The price of warehouse property in New Orleans in this situation was related much more strongly to the size of the lot than the size of the building. This makes sense because few buildings were of value after Hurricane Katrina, since most were flooded.
In summary, using statistics can help you determine a market price with greater reliability than using the average price per square foot method, and can be a useful tool when supply and demand factors change dramatically.
Read the original article in the CCIM publication, CIRE magazine.
To create your own formula in Microsoft Excel, simple linear regression is performed using an Excel add-in called the Analysis Toolpak. First install this add-in. Then in an Excel worksheet, enter the data in two columns, one column for price and one column for lot size. On the menu bar select "Tools", then "Data Analysis", and then "Regression". For "input Y range" select the price column. For "input X range" select the lot size column. Select a location for the output data and click on "OK".
The new economic drivers of the New Orleans economy are not what you think. New Orleans transitioned from an oil based economy to a tourism based economy starting in the 1980's, with the development of the convention center and continued through the next century with an explosion bigger than Norco in growth of new restaurants after Hurricane Katrina in 2005. The transition away from oil leaves one last economic driver related to the oil industry: the petrochemical industry which is currently undergoing continuous repair and expansion. The corridor between Baton Rouge and New Orleans is one of only a handful of areas in the United States with refineries, and this article examines their impact on the New Orleans Metropolitan Statistical Area (MSA).
The Greater New Orleans (GNO) area, made up of ten parishes, provides a strategic location for petrochemical industries and is complemented by strengths in trade, logistics, and distribution capabilities. Recently over $6.4 billion dollars has been invested for the expansion and renovation of petrochemical plants, generating hundreds of jobs and significant income for the region. The petrochemical industry has gained considerable strength due to low prices in natural gas and high prices of oil per barrel, which is seven times the price of natural gas per million British thermal units (MMBTUs). Today, natural gas is roughly $3 per MMBTUs while oil is about $90 per MMBTUs, a ratio of 30 to 1. These abundant and less volatile prices of natural gas supplies are leading to a renaissance of manufacturing and industrial activity, particularly in Louisiana.
Several expansion projects have been approved for refineries in the area. In April of 2013, Dyno Nobel Americas and Cornerstone Chemical announced a combined investment of $1.025 billion for a new ammonia production facility and related upgrades in Waggaman. Incitec Pivot Ltd., the Australia-based parent company of Dyno Nobel, will invest $850 million to build the ammonia plant, providing a commercial foundation for Cornerstone to continue its planned investment of $175 million in maintenance, upgrades and infrastructure expansion at its site over a six year period. In February of 2013, South Louisiana Methanol and Todd Corporation Group announced an investment of $1.3 billion in a new methanol production facility in St. James Parish.
These investments will enable the plant to process additional heavy feed-stocks, increase throughput capacity, upgrade its product yields and improve on-stream reliability. Valero has invested over $1.5 billion into the Norco refinery in St. Charles Parish and Marathon Petroleum Company has just complete a massive expansion in 2013 making it the fourth largest refinery in the United States.
Table of Recent Investments In The Petrochemical Industry
table of petrochemical investments
Industrial construction in the petrochemical and oil and gas industries will drive strong employment gains in Southeastern Louisiana over the next few years. Finally, the GNO area offers a lower cost of doing business compared to the rest of the nation as well as incentives designed to attract businesses and companies. These include tax credits, material rebates, deferred property tax assessments and contract lending. These incentives coupled with a well-equipped, educated workforce make the GNO region highly attractive and poised to move forward in the future.
Chart of Employment In Petrochemical Industry
chart-petrochemical employment
chart-petrochemical export employment
Sources:
[1] Oritz, E., & A. Plyer. (2013). Economic Synergies Across Southeast Louisiana. New Orleans: Greater New Orleans Community Data Center.
[1] http://gnoinc.org/industry-sectors/energypetrochemicalsplastics/
[1] Scott, Loren C. (2011). The Economic Impact of the Haynesville Shale on the Louisiana Economy: 2009 Analysis and Projections for 2010-2014.
[1] http://www.riverregionchamber.org/MemberHighlights/Valero.html
[1] http://www.heraldguide.com/details.php?id=8585
[1] http://gnoinc.org
CityBusiness Named Robert Hand one of the Top 50 Financial Executives in New Orleans for 2012.
"It's possible to spur redevelopment along a dilapidated corridor and bring affordable housing to a community while still making a profitable investment. Just ask Robert Hand, who has played a key role in securing more than $200 million for new developments in the past five years to bring affordable housing to New Orleans.
Inherited real estate accounted for a sizeable portion of the city's housing stock before levee failures during Hurricane Katrina wiped much of it out in 2005, so properties don't often change hands. When Hand's clients came to him after Hurricane Katrina looking for profitable investments, he helped them develop affordable housing in areas where property was not rebuilt. "We took vacant industrial sites and parking lots and helped clients see the opportunity in them and commit to the development," he said. Hand negotiated the development of an abandoned warehouse on a 6 acre site on Poydras Street into The Marquis apartments. He also helped revive abandoned buildings into new businesses, such as The Saint Hotel on Canal Street.
His work has fueled the transformation of Mid-City, where the former Baumer Foods Hot Sauce factory site is now The Preserve apartment complex. He also transformed a former empty parking lot for a former auto dealer on Tulane Avenue into the Crescent Club apartments. Across the street, he helped turn a block of delapidated houses into a shopping center with Subway, Capitol One Bank, an upscale wine bar and a high-end yogurt store.
"That was at a time when nobody wanted to be on Tulane, so we were going right when everyone else was going left" he said. "Each of those developments was at least a $20 million investment, so it was a large undertaking."
Hand continues to use commercial real estate in addition to stocks, bonds, mutual funds and other strategies to help solve his clients' investment problems. To his knowledge, he is the only Registered Investment Adviser in Louisiana with an MBA and the Certified Commercial Investment Member designation. He is also past president of the International Association for Financial Planning.
Hand got his start in the industry on one of the unlikeliest of days in 1980, when he came to New Orleans from Jackson, Missississippi, to interview with Merrill Lynch on the day that came to be known as Silver Thursday when Bunker Hunt tried to corner the silver market. Silver prices crashed, and panic ensued on the commodity and futures markets. There was gloom and doom. In spite of that, Merrill Lynch asked him to start the following Monday. It marked the beginning of Hand's 32-year career in the investments field. He joined FSC Securities in 2003.
Fastest Job Growth In Louisiana
Even through the state of Louisiana reports one of the lowest unemployment rates in the nation dropping to 4.5 percent, not all areas of Louisiana have witnessed reduced unemployment in the last 12 months. For example, Shreveport suffers from a reversal of the Haynesville Shale boom with a employment decline of 0.2 percent, and Alexandria experienced the largest employment decline at 0.6 percent. On the flip side, the biggest improvement in employment the last 12 months has been in Lake Charles, up 3.1 percent, followed by Houma, up 2.7 percent, Baton Rouge, 2.1 percent, and Lafayette at 2.0 percent.
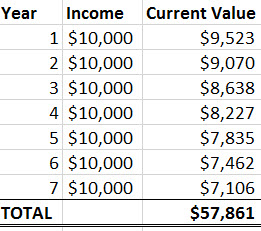

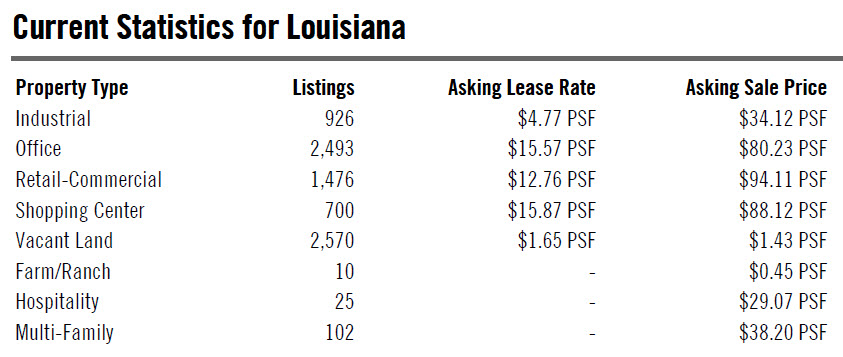


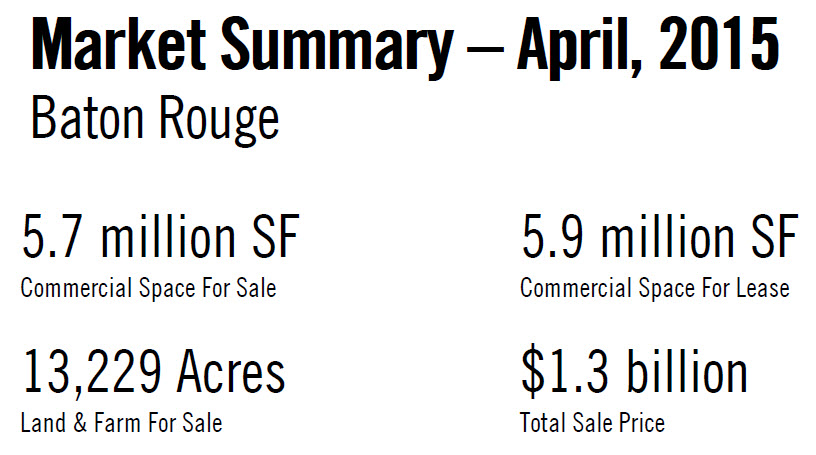
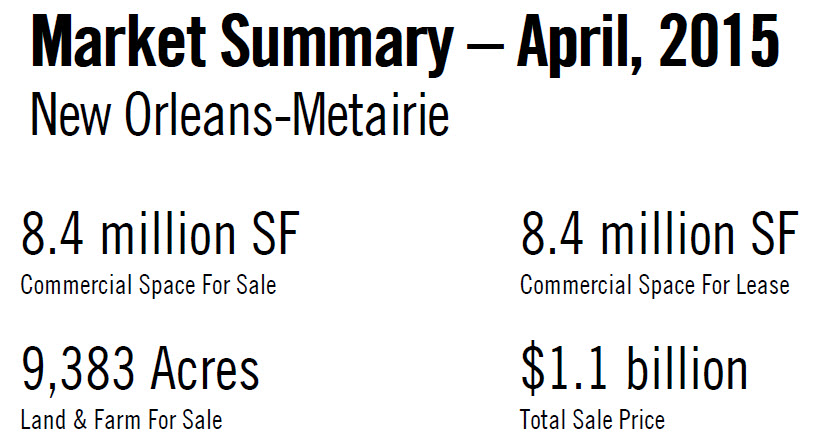
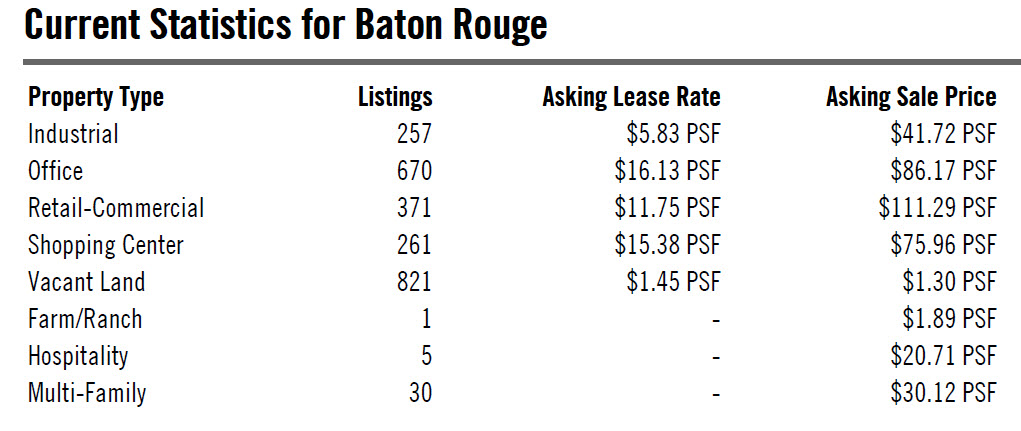
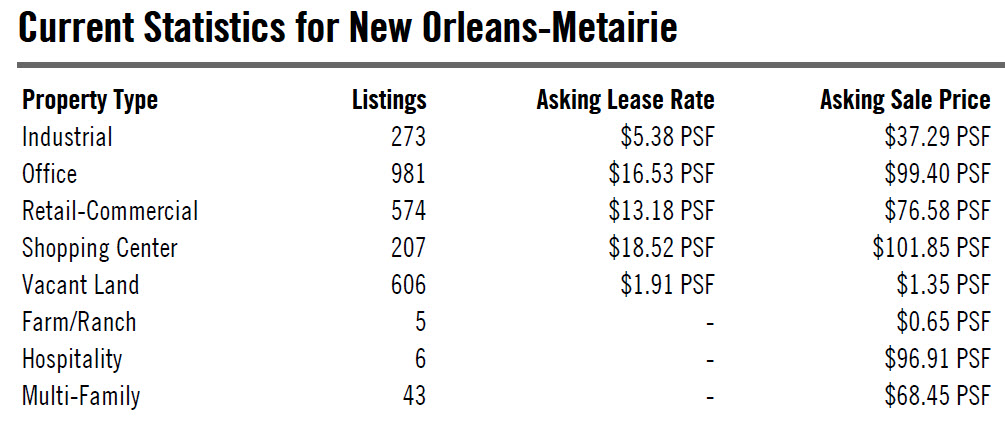
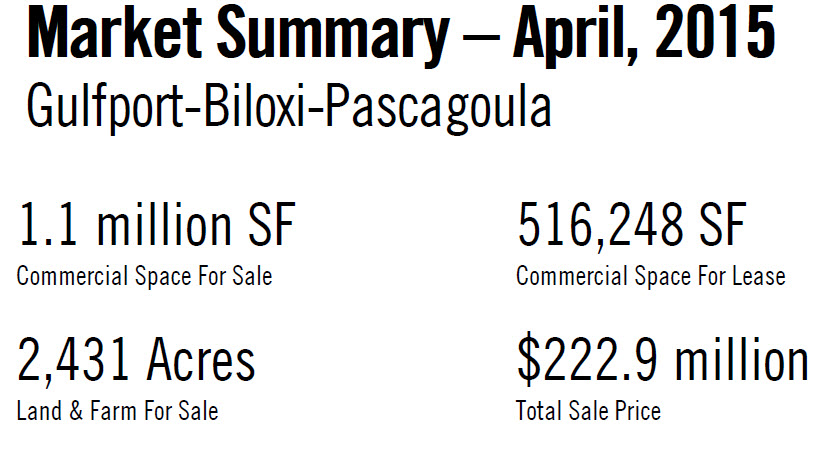
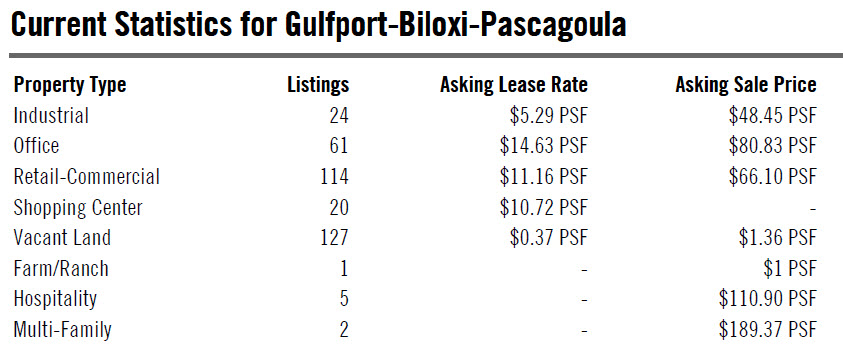
 Industrial Market In Detail
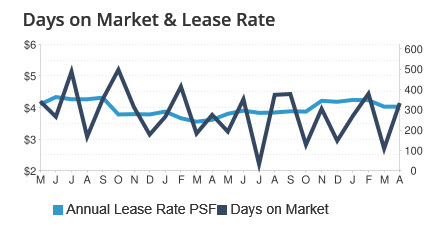
 A vacant hotel property that is among the largest pieces of available real estate along Tulane Avenue recently changed hands after more than three years on the market.
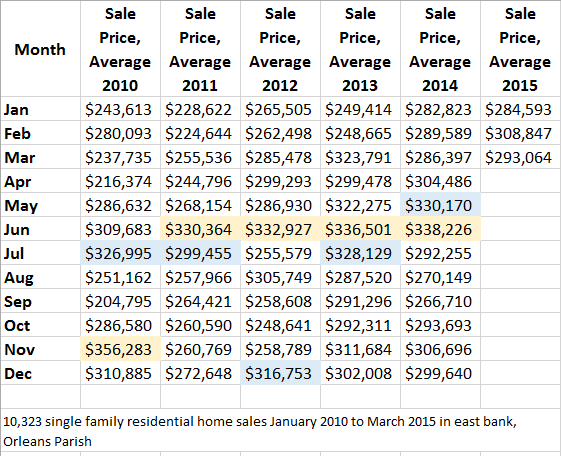
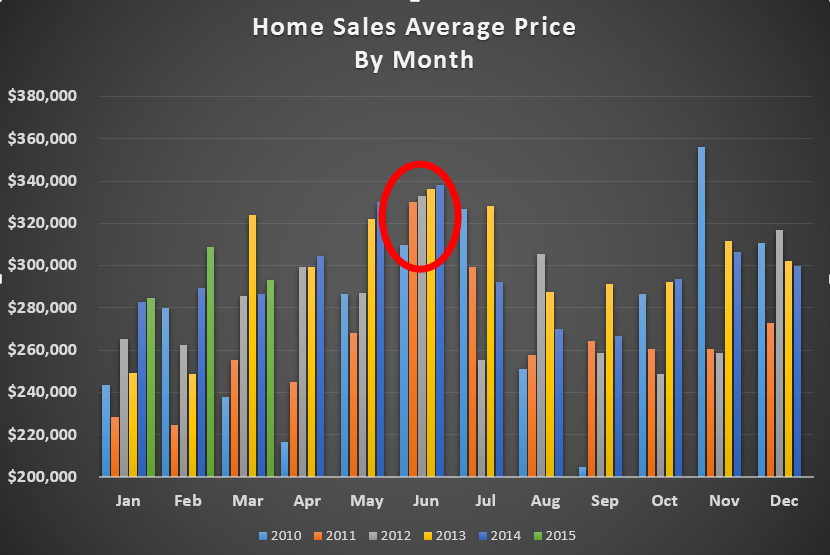
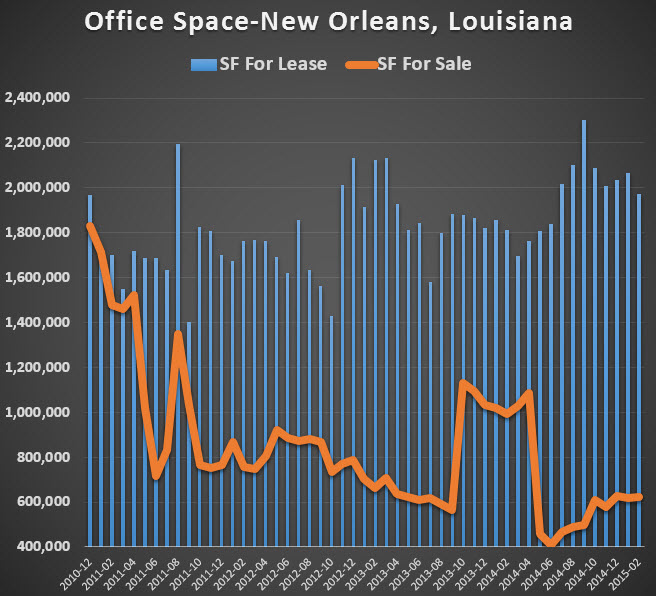
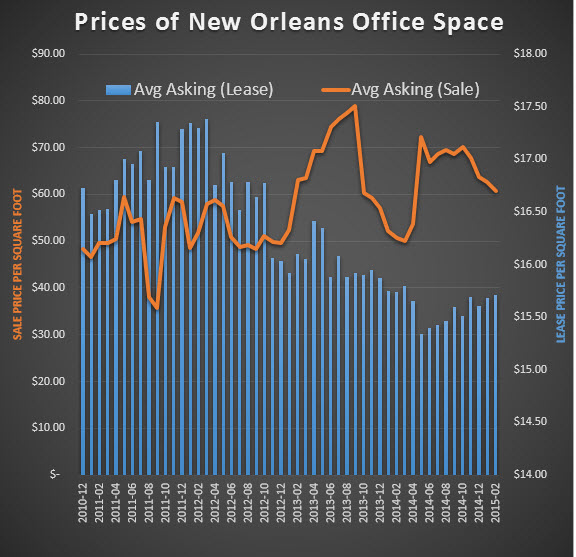
 Fire Damaged America's Best Hotel Going Back Into Commerce As Office/Retail Center
  Last Wednesday, President Obama was the lead story on many television stations, proposing a new plan to eliminate "conflicts of interest" that investment advisors have with their clients.


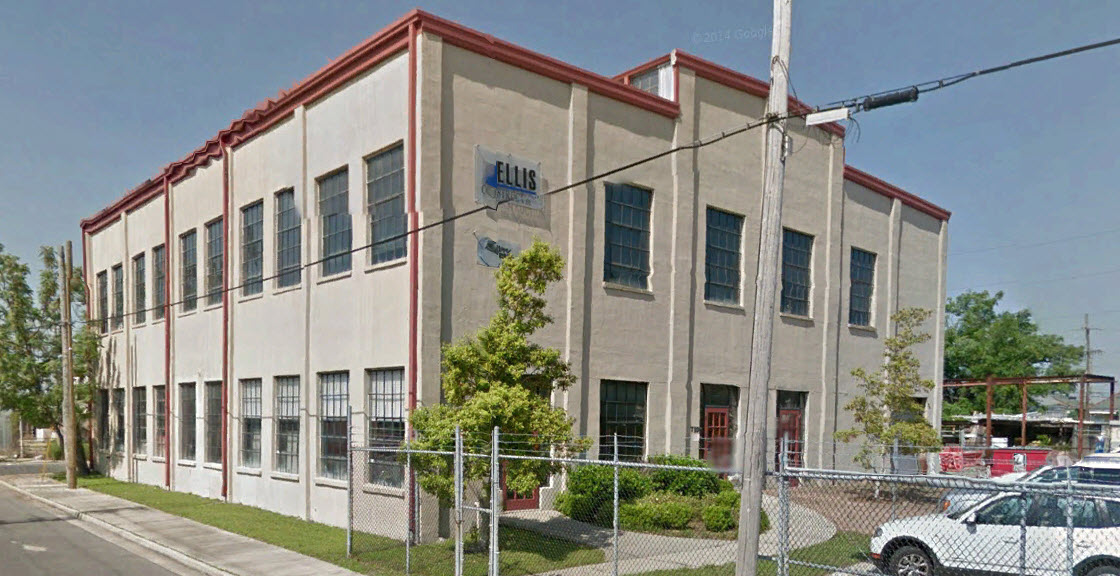


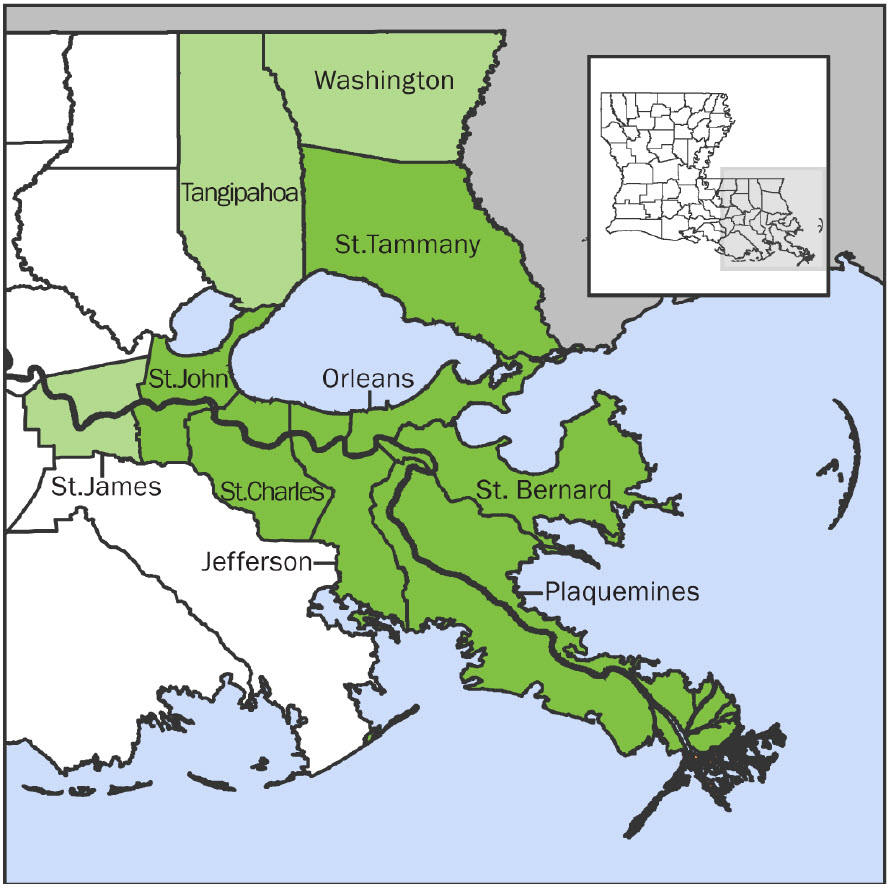

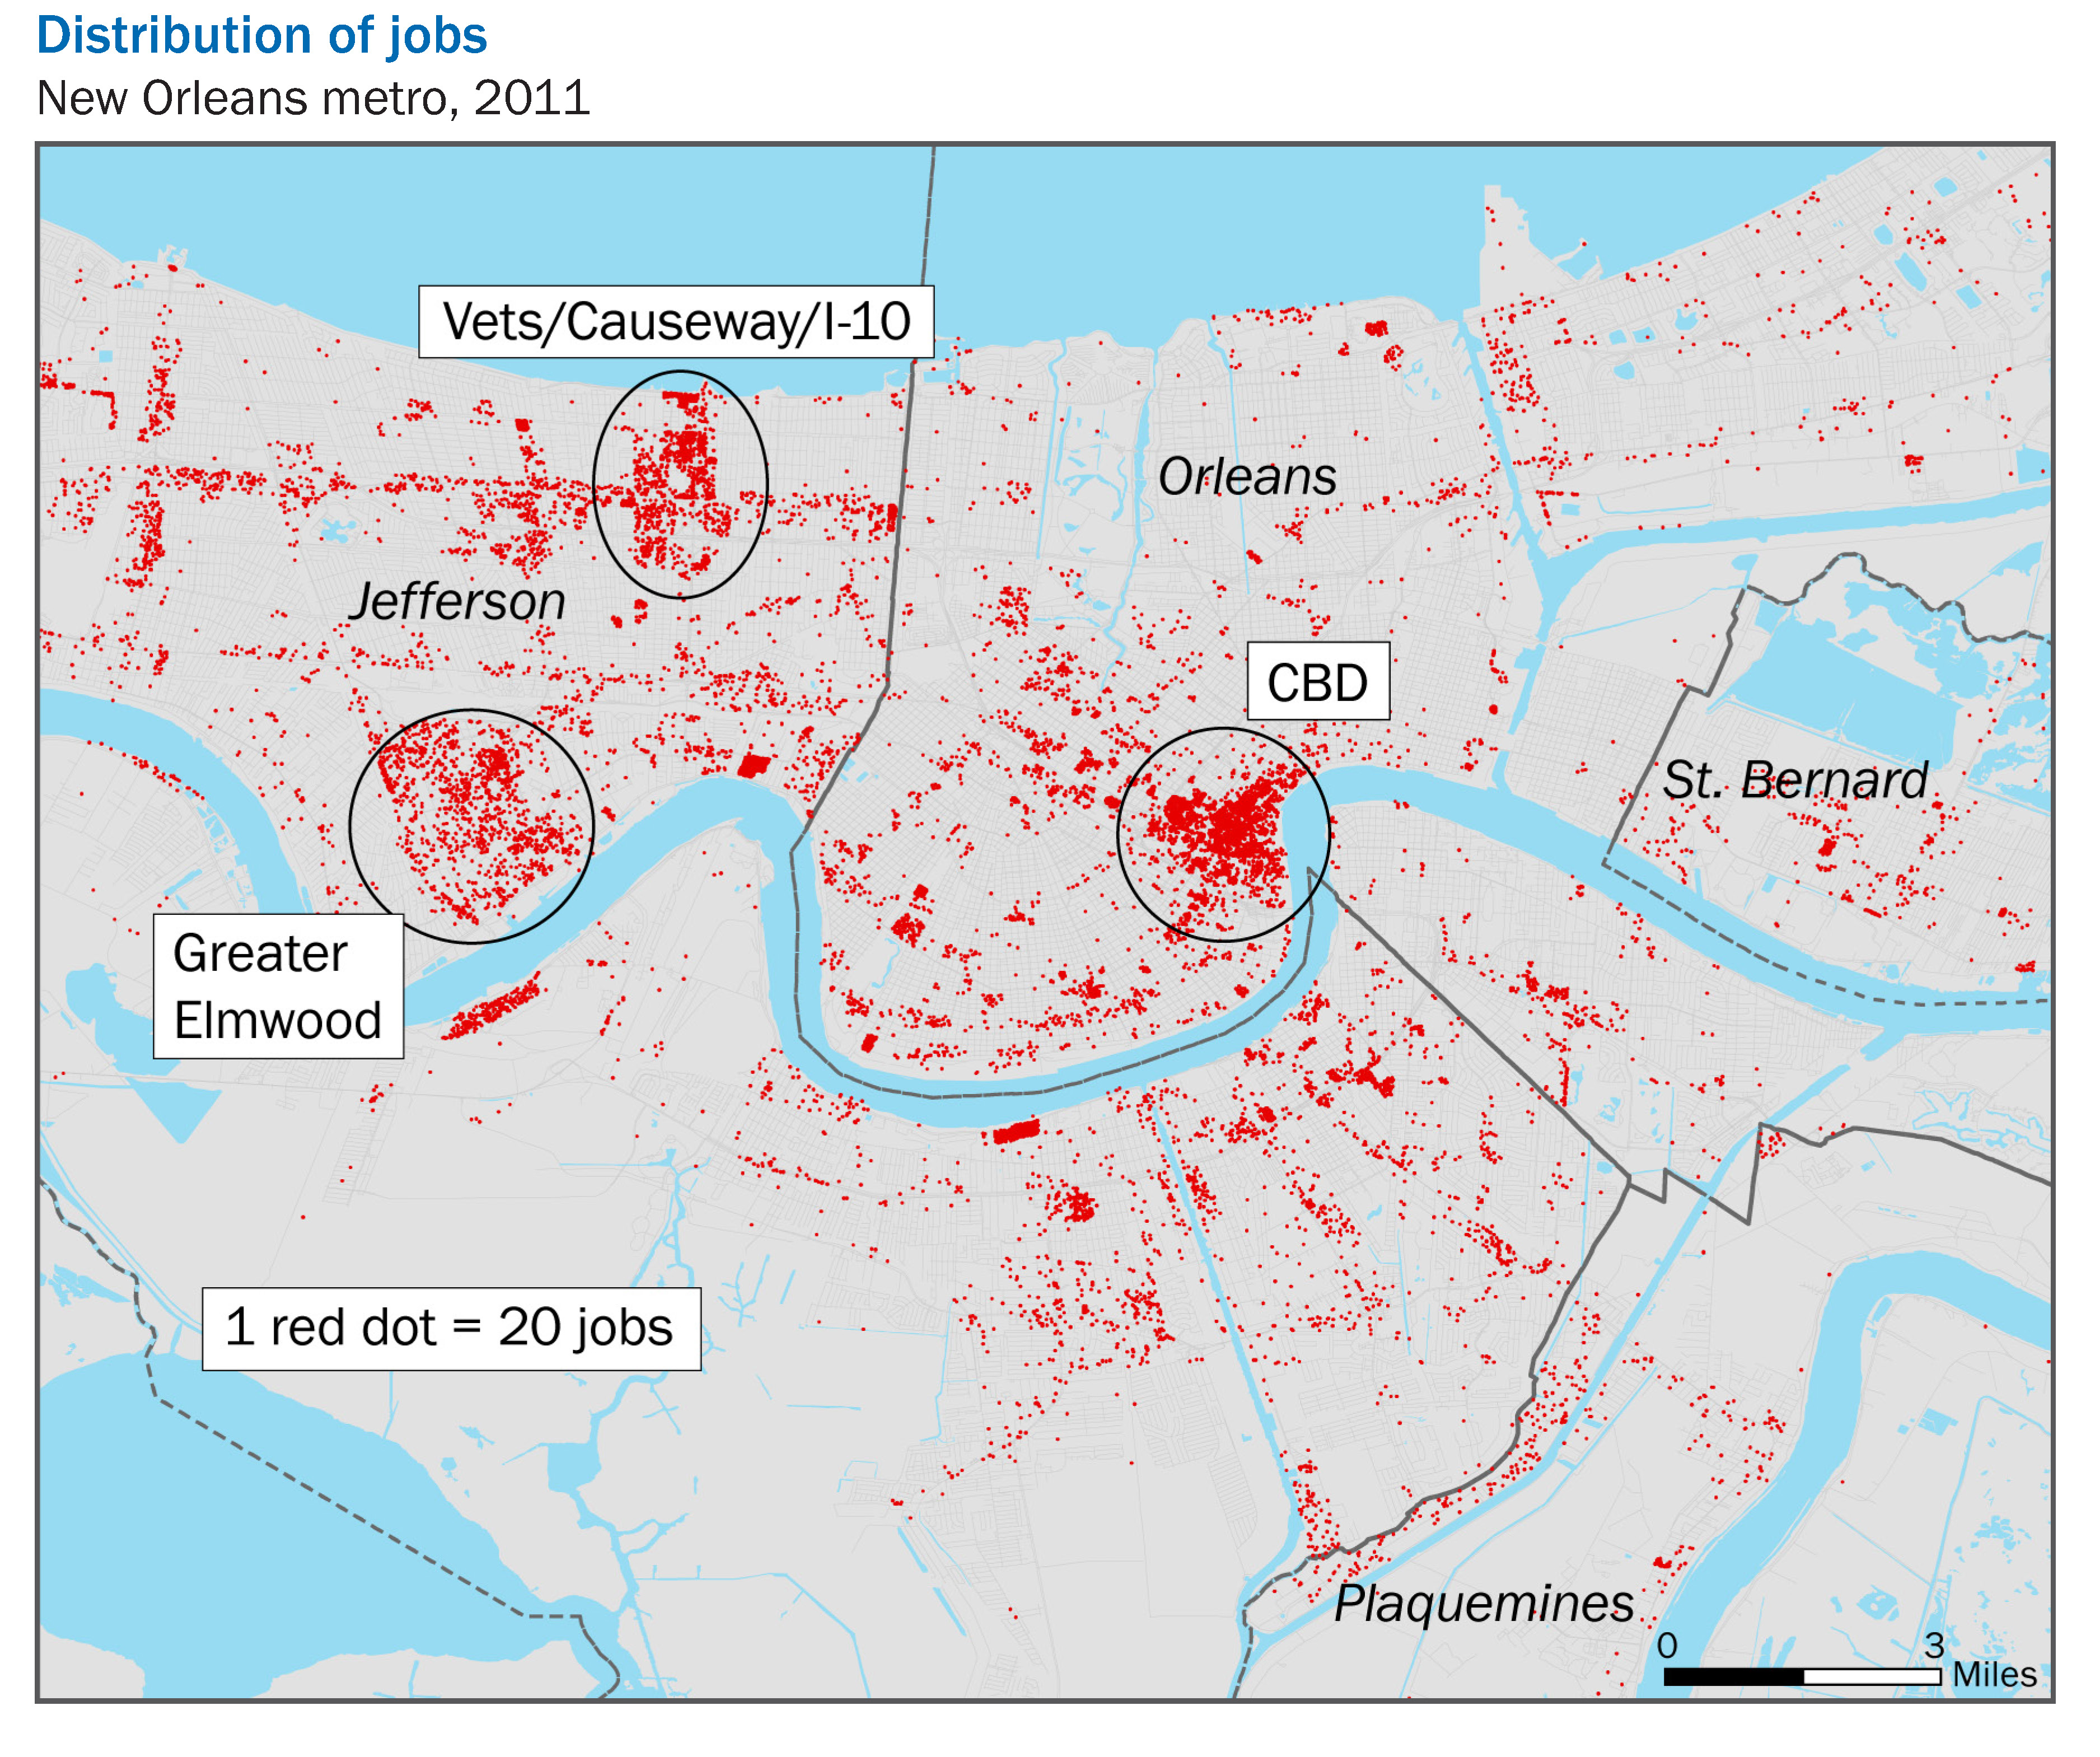
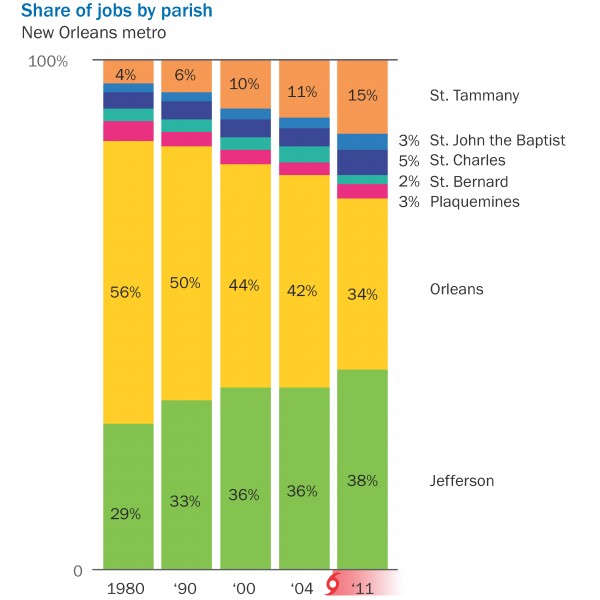
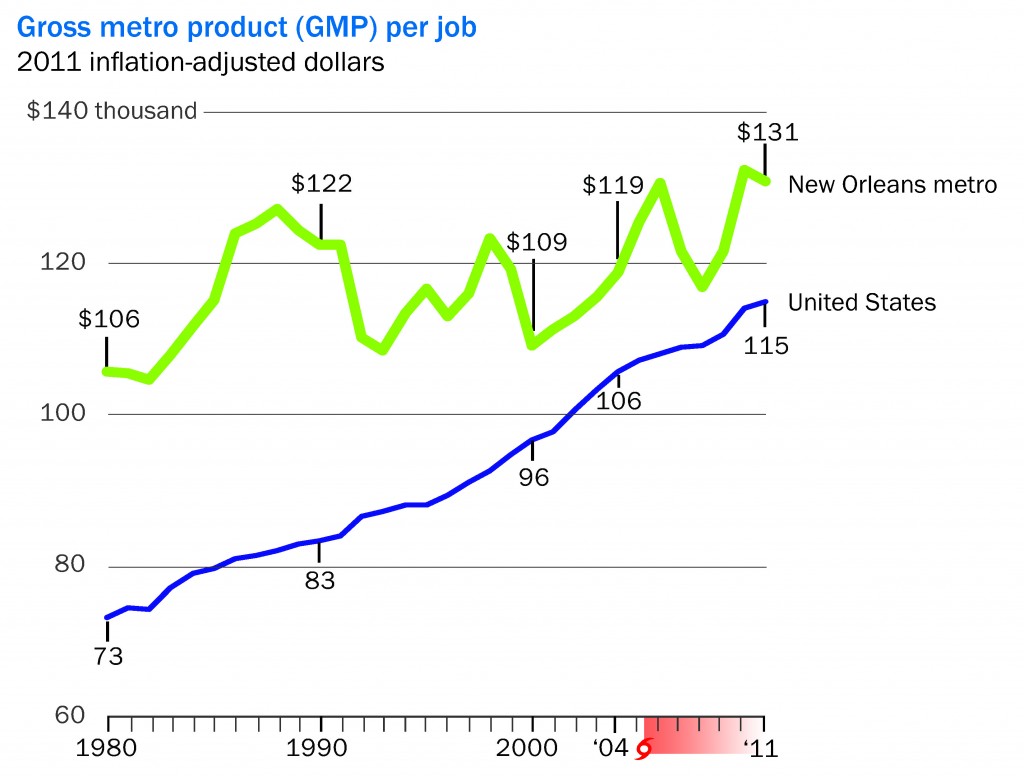


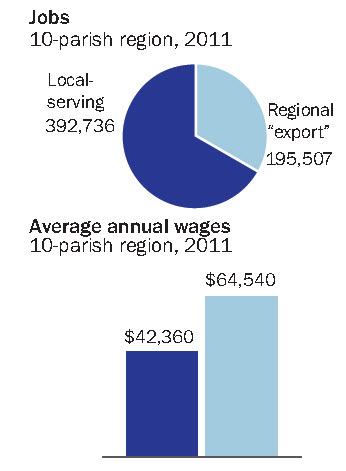 If you want to see Louisiana grow, which jobs would you prefer to bring in: oil or tourism? One of these two top industries delivers twice as many jobs but has one-third of the wages. This article examines jobs and wages, defining what is called Export Jobs which in the long run determine our economic future.


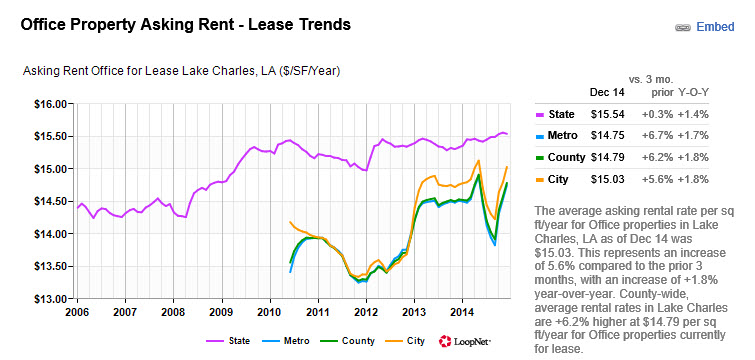

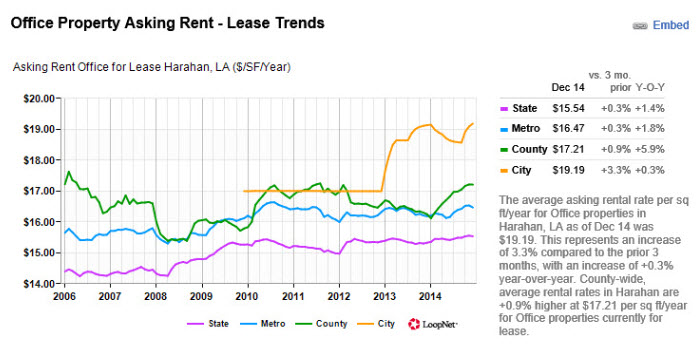


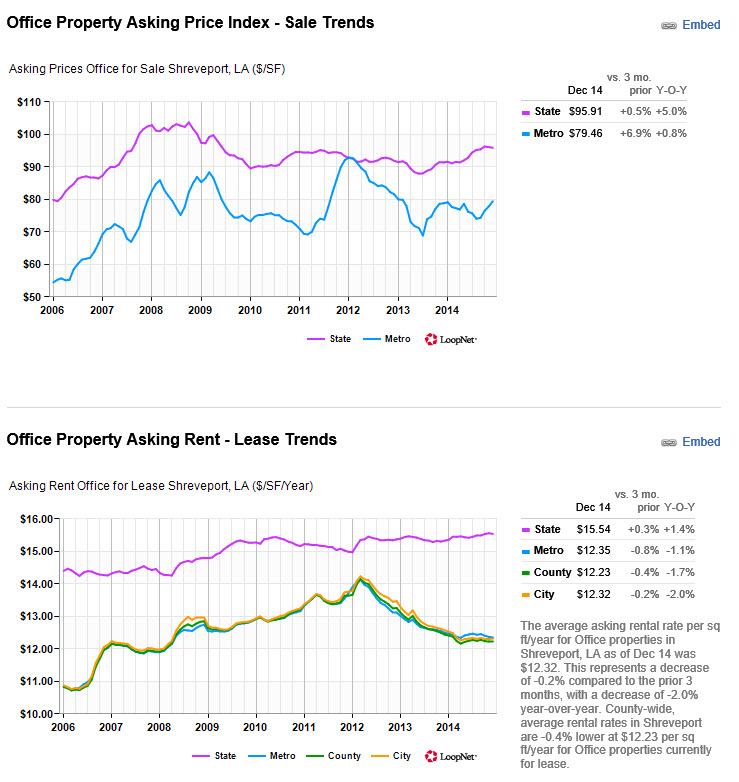
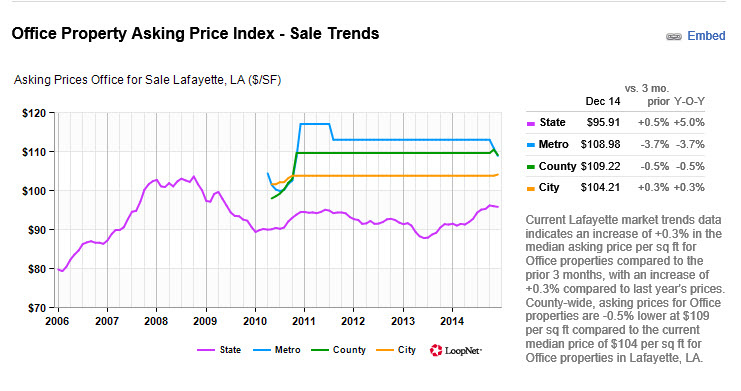


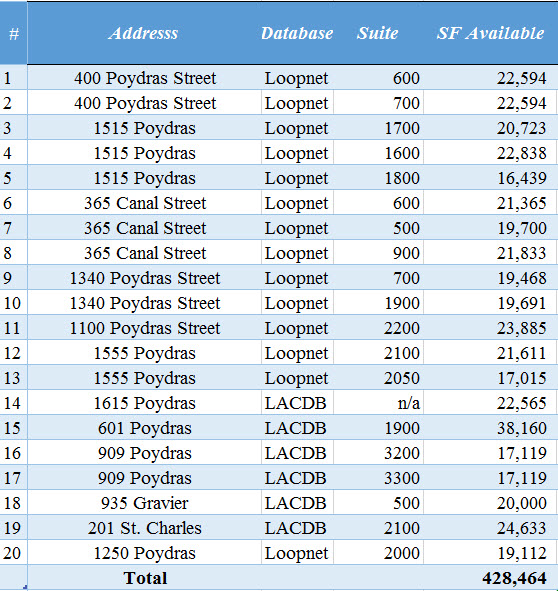

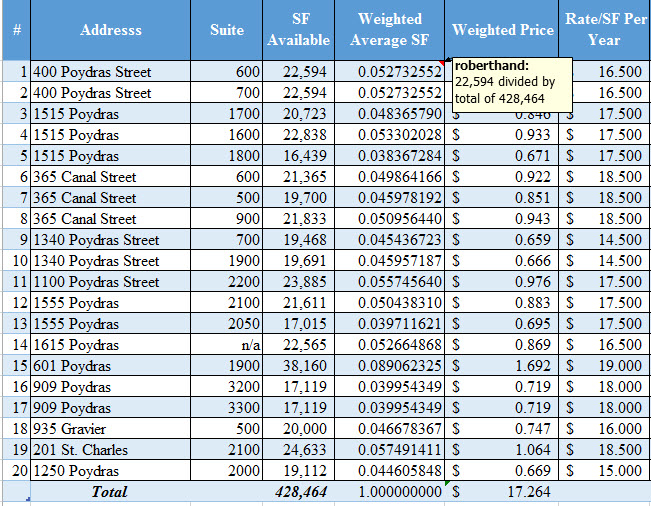

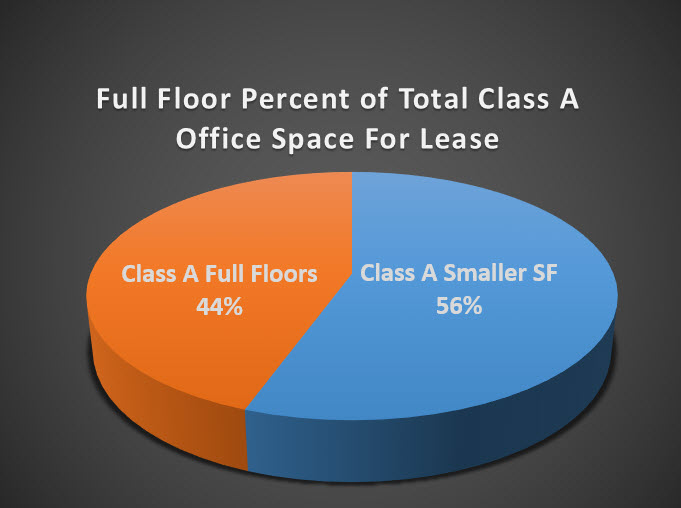
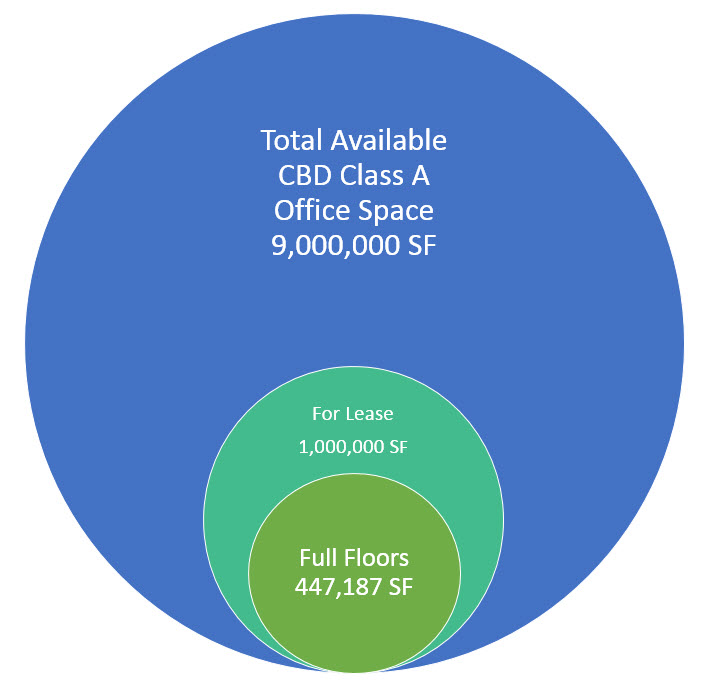


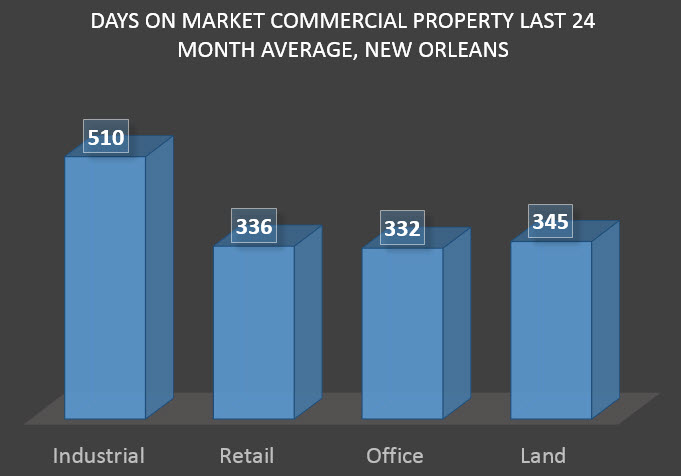


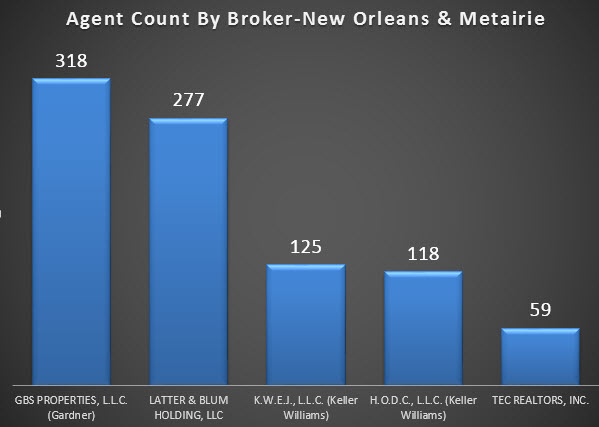
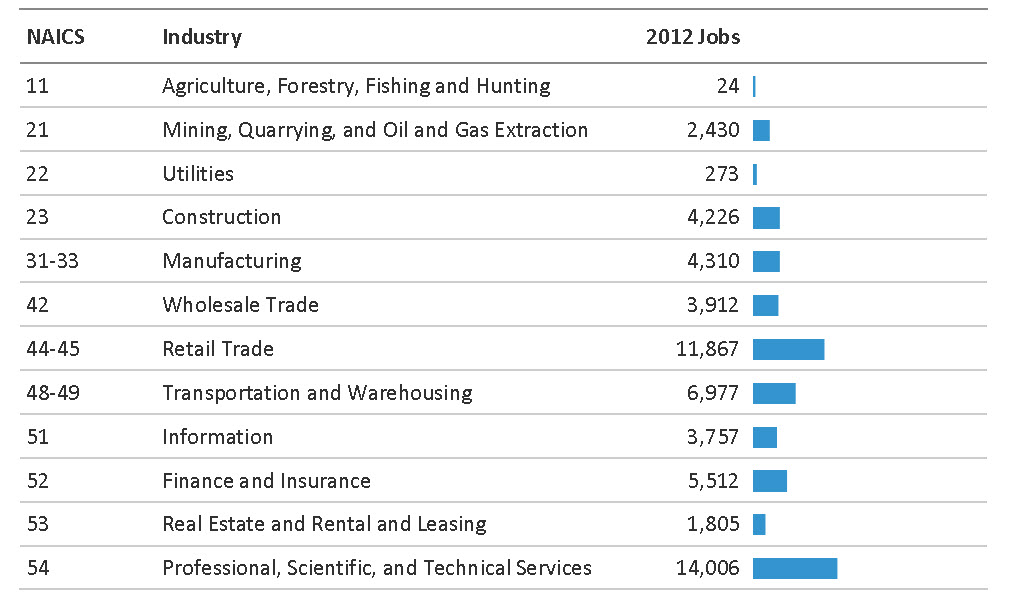
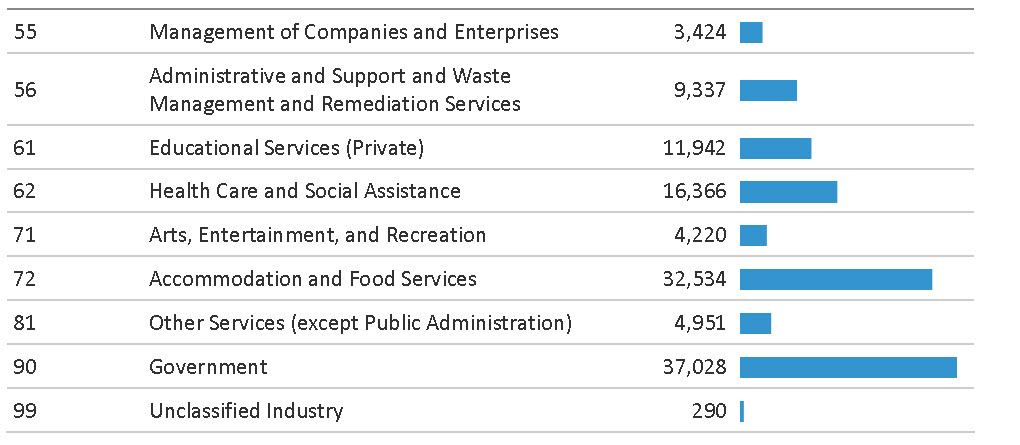

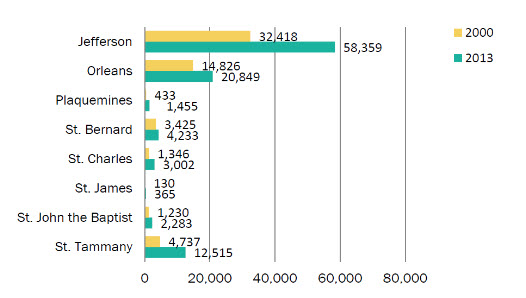


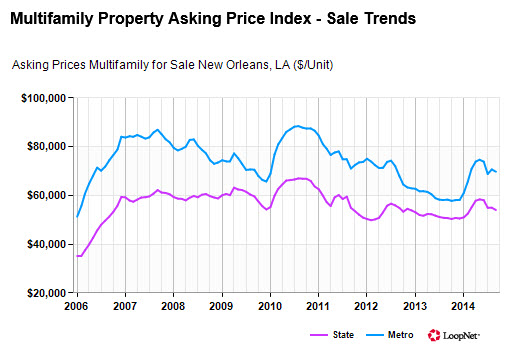
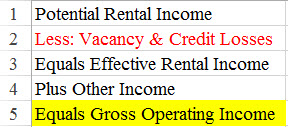

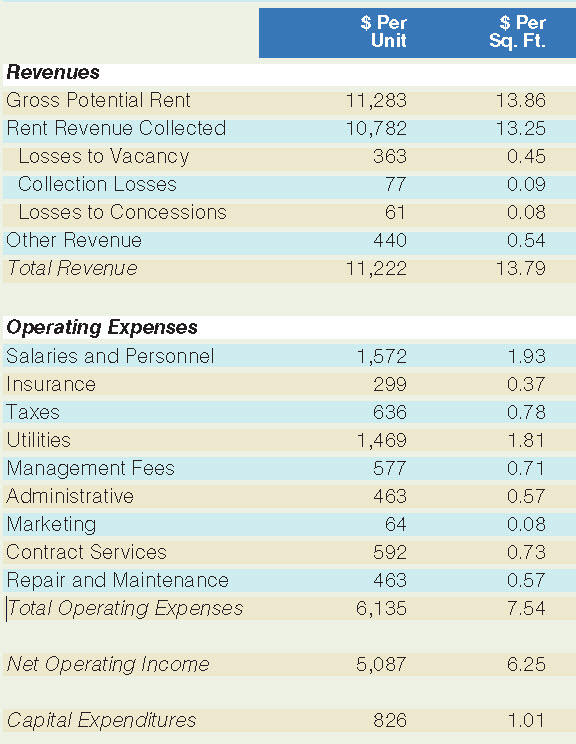


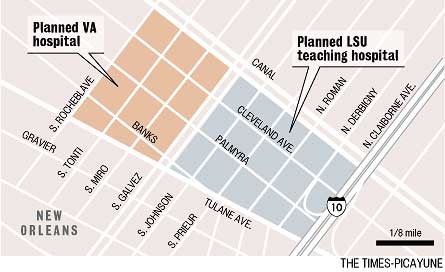
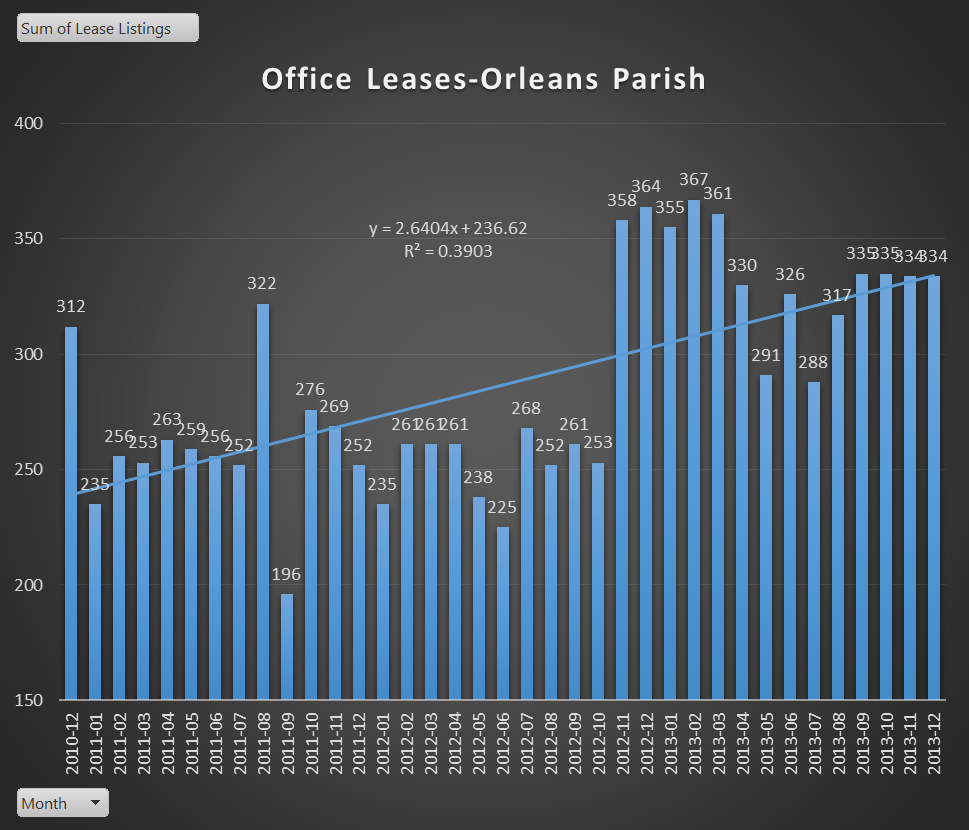


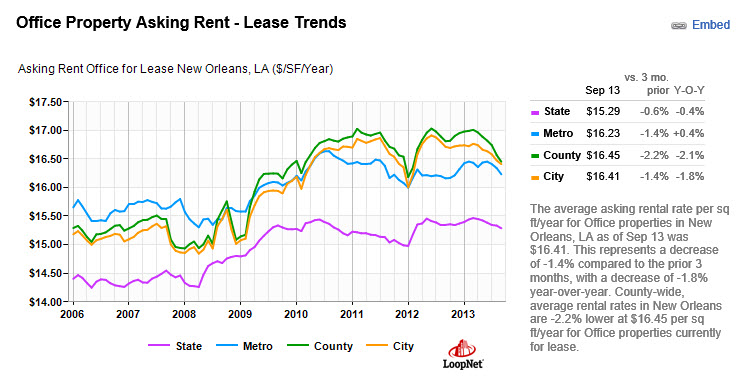


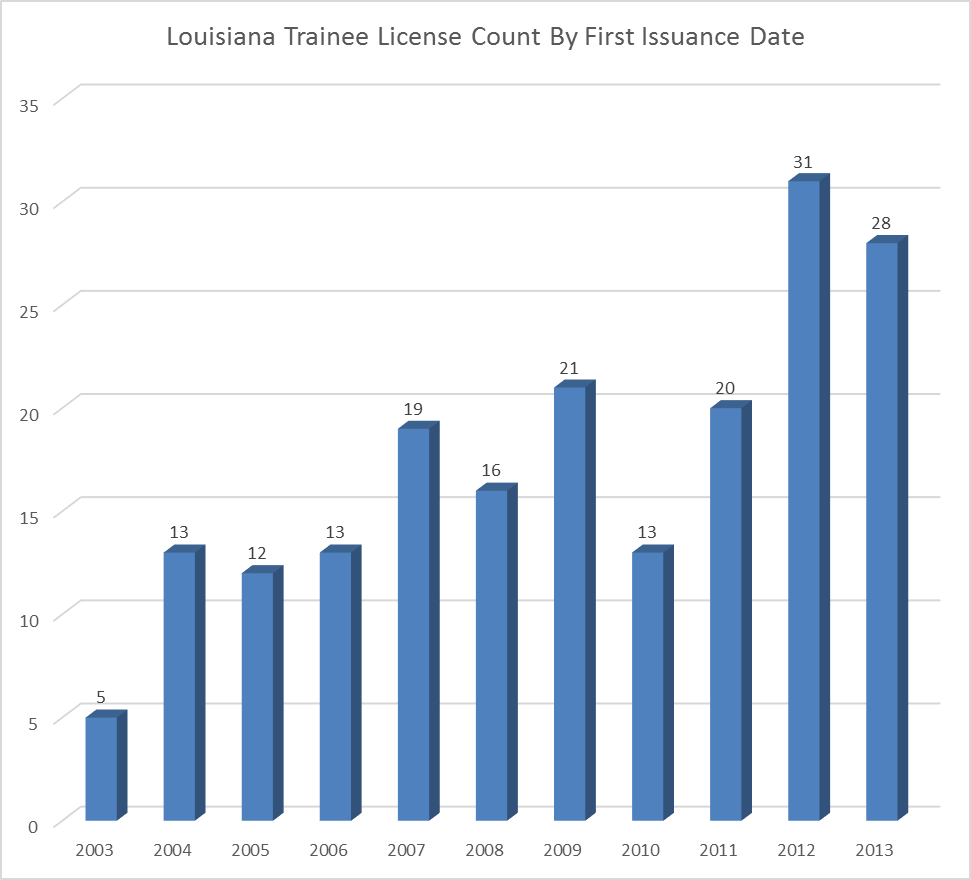


 New Orleans is almost 300 years old, so classifying and describing commercial real estate can be tricky. That's because New Orleans has 100 year old buildings that look better on the inside than brand spanking new construction. To help with the confusion, many commercial real estate specialists use the building classes defined by the Building Owners and Managers Association which few people understand. Let's review the classes of buildings and clear up the confusion.