 Pricing commercial real estate is vastly different from other assets, such as stocks and bonds where thousands of buyers and sellers state openly their best price and recent transactions are known by all. In fact, commercial real estate pricing is far from a highly competitive industry which must have transparency and all participants have easy access to information.
In commercial real estate, money is made when one party has superior information, meaning the other party has inferior information. Ironically, both parties feel their idea of price and value is accurate or a transaction would never take place. This article unveils recent prices of all 8 categories of commercial real estate in the New Orleans MSA and provides a math lesson showing how price is not affected by supply. Knowing current prices provides you with information that most commercial real estate participants don't have, and knowledge can help you make better real estate decisions.

The commercial real estate market in New Orleans includes 8.2 million SF for sale and 8.5 million SF for lease, but the largest category is 366 million SF of land for sale.
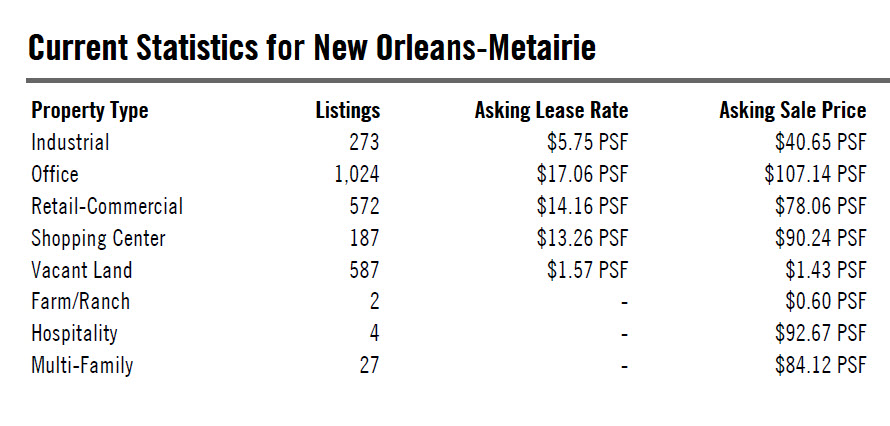
The Industrial and Office sectors have about 5 million SF available, the Retail sector around 3 million, not including 1 million SF of Shopping Centers, Apartments around 200,000 SF and the smallest sector is Hotels with around 100,000 SF available.
Zeroing in on the 1,024 property Office sector, there are 142 properties for sale averaging $101 per square foot and 882 for lease averaging $17.35 PSF and on the market for 138 days, down 38 percent from the 12 month average of 223 days. During July 2016, 29 office properties were leased and 3 sold.

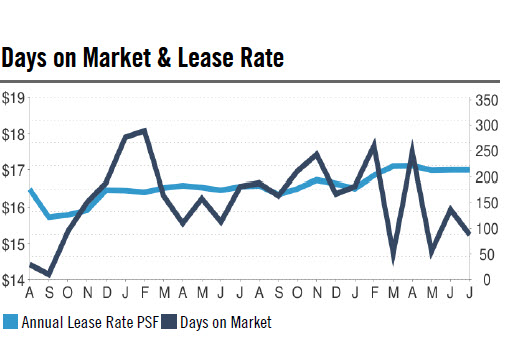
The chart comparing days on the market to lease price doesn't depict any correlation, but both are indicators of a strong office market resulting in the highest lease prices in 24 months and properties being leased the fastest since 2014, back when Ebola was a problem and the Iphone 6 was announced.
The 5.6 million SF Industrial sector has only 273 properties, with 192 for lease averaging $4.60 per square foot and 81 for sale averaging $69 PSF and on the market for 259 days, down 28 percent from the 12 month average of 364 days. During July 2016, 7 properties were leased and 2 sold.
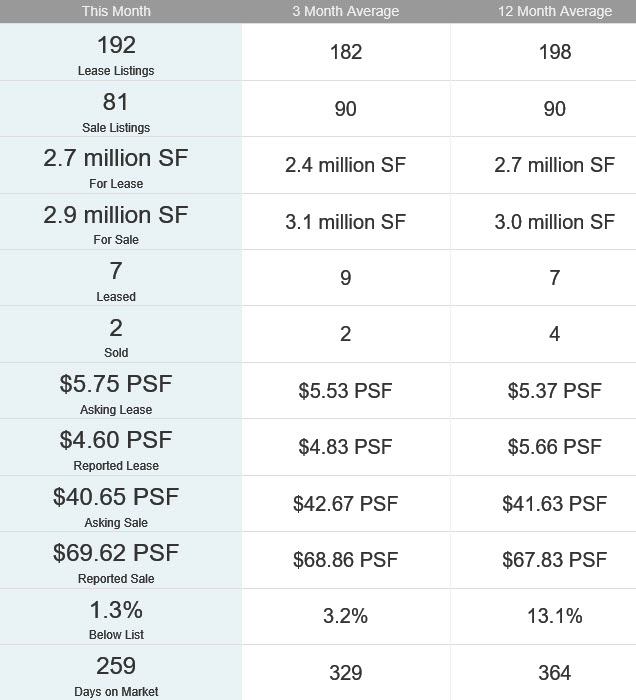
While the Industrial square footage over the last 12 months has ranged between 2.5-3.0 million SF, going back to early 2014 shows how the Industrial sector has tripled the square footage coming onto the market for both sale and lease.
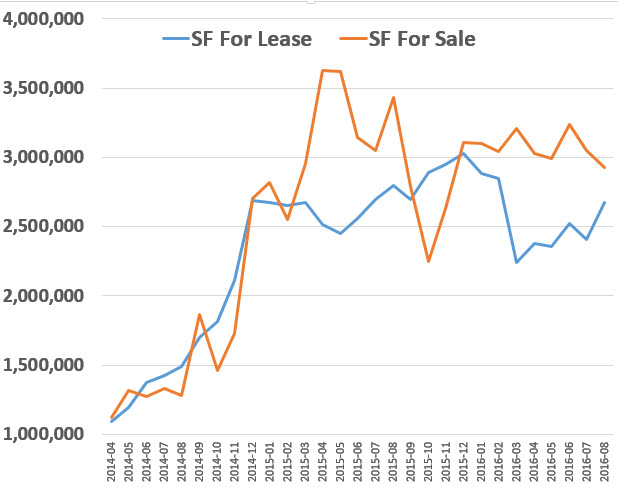
There does not seem to be a correlation in the Industrial sector between lease price and supply. Since 2014, the supply of SF for lease has increased from around 1 to 2.7 million, but the price has stayed around $5 PSF.
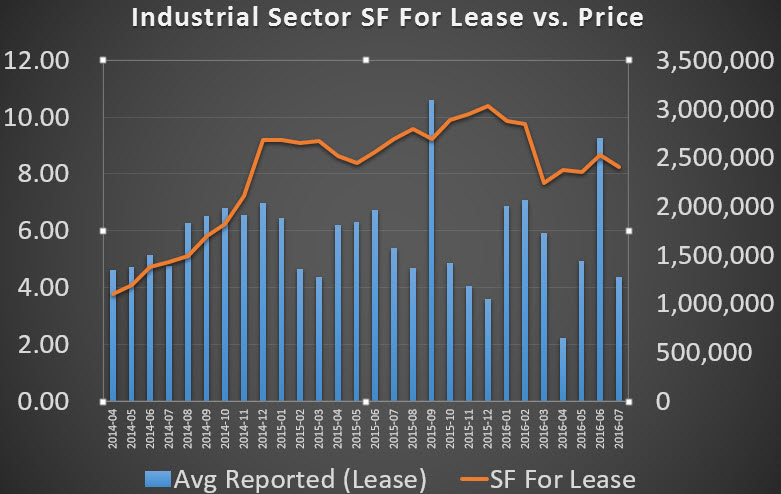
You can test this mathematically, using a statistical term called Correlation, or how strongly two sets of data are related. Excel makes it easy. Just copy the data below into Excel.
| Month | Price | SF |
| 2014-04 | 4.60 | 1,097,714 |
| 2014-05 | 4.74 | 1,191,966 |
| 2014-06 | 5.13 | 1,373,344 |
| 2014-07 | 4.76 | 1,424,003 |
| 2014-08 | 6.28 | 1,489,141 |
| 2014-09 | 6.52 | 1,701,071 |
| 2014-10 | 6.79 | 1,814,324 |
| 2014-11 | 6.54 | 2,108,881 |
| 2014-12 | 6.97 | 2,686,484 |
| 2015-01 | 6.44 | 2,678,266 |
| 2015-02 | 4.65 | 2,653,680 |
| 2015-03 | 4.38 | 2,676,633 |
| 2015-04 | 6.20 | 2,515,386 |
| 2015-05 | 6.32 | 2,450,285 |
| 2015-06 | 6.72 | 2,558,397 |
| 2015-07 | 5.38 | 2,693,481 |
| 2015-08 | 4.68 | 2,799,854 |
| 2015-09 | 10.60 | 2,697,487 |
| 2015-10 | 4.86 | 2,887,840 |
| 2015-11 | 4.06 | 2,951,164 |
| 2015-12 | 3.58 | 3,027,771 |
| 2016-01 | 6.88 | 2,882,150 |
| 2016-02 | 7.10 | 2,844,831 |
| 2016-03 | 5.93 | 2,244,517 |
| 2016-04 | 2.23 | 2,377,821 |
| 2016-05 | 4.93 | 2,358,527 |
| 2016-06 | 9.28 | 2,525,389 |
| 2016-07 | 4.38 | 2,406,397 |
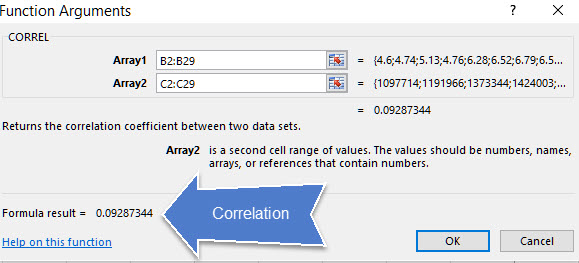
Click tabs formulas, more functions, statistical, then scroll to CORREL. Copy and paste Price cells into array1 and SF cells into array2. The result is .0928 which is 9.28%. That means square footage only explains 9.28% of the change in price. This works for any comparison of data, even temperature versus snowball sales.
Both the Office and Industrial sector in the New Orleans MSA are experiencing strong markets, where prices hold despite an increase in supply. Prices for the most active sectors are:
For more information on how to value commercial real estate, read our article, How To Value Commercial Property Using Cap Rate.
For a free market valuation of any commercial property, just call or email our office.
Robert Hand, MBA, CCIM, SIOR
Louisiana Commercial Realty, LLC
One Lakeway Center
3900 North Causeway Boulevard-Suite 1200
Metairie, Louisiana 70002
Phone: 504-289-8172