 You can run the numbers to calculate gains or losses from various scenarios, but there is nothing like a visual depiction of risk/reward tradeoffs, especially when it comes to risk in commercial real estate. The hard part is transitioning numbers to something you can see that displays probability and the risk involved with adopting various strategies that may or may not result in a gain.

Making decisions in commercial real estate often involves more than just calculating a capitalization rate or net present value, because there is always a component of unknown risk. In the office leasing sector, risk is created by local market factors, such as supply and demand for space, asking and effective rents, and absorption rate. Other factors contributing to risk in commercial real estate are the specifics of the situation. Learning how to quantify and illustrate such risks to clients is a challenge, especially in small or mid-size markets where office demand can still be somewhat stagnant.
This article discusses how to quantify the risk of a real-life decision: Should an office tenant write a check for $1.5 million to accept a lease buyout offer, or continue to market a sublease for 56,542 square feet of class A downtown office tower space in New Orleans?
As a byproduct of a merger between two large oil companies, a decision was made to relocate 250 employees from New Orleans to Houston, leaving 75,000 sf -- four full floors of fully furnished class A office space -- vacant with an obligation to pay rent at $18.25 psf for 54 more months.
The situation is compounded by two issues: The space represents the largest contiguous class A office space in New Orleans, and with only 54 months left on the lease, it is not feasible for the lessee to offer any build-out allowance. This means the sublease space cannot compete with market-rate space.
The lessor has presented an offer to take back 56,000 sf -- three full floors -- for a lump sum payment of $1,500,000 rather than the current obligation of $1,022,000 per year. The decision for the tenant is whether to pay the $1.5 million and gain the difference or try to sublease the space to produce a greater income. The dilemma is how to analyze this risk in commercial real estate.
The New Orleans class A office tower market is approximately 9,000,000 sf, with 1,000,000 sf currently available for lease. Building occupancy rates range from 73 percent to 97 percent and 2013 absorption was 133,000 sf, or 13 percent of available lease space. Asking rents range from $16.50 to $21.00 psf, including build-out payments ranging from $10 to $30 psf. In competing buildings, 15,000 sf of sublease space is available at $15.00 psf and 90,000 sf was just renewed at $12.50 psf.
At first glance, the answer appears to be a no-brainer: Accept the offer to pay a lump sum of $1,500,000 rather than pay $1,022,000 annually for 54 months, equal to $4,599,000. However, calculating the numbers on subleasing the space at the average asking rate of $18.50 psf produces a profit of $63,609 for the remaining period. (See Table 1.)

Such numbers are compelling to clients wishing to make the most of a difficult decision. However, just because the market rate is $18.50 psf, we can’t assume that we can immediately lease the entire space at that price. Instead, the analysis should focus on the risk of not paying the $1,500,000 and trying to sublease the space. What price do we need to sublease the space for and how long can we take before we are worse off than just paying the $1,500,000? How do we show a client that risk visually?
Thus, the critical data are how long will it take to sublease the space and at what price. If the current market lease rate is higher than the current obligation net of build-out allowance, the space would command a payment to the lessee rather than a $1,500,000 payment from the lessee. But, like many markets, the New Orleans market has a wide variance, with some class A office tower downtown space subleased at a low of $12.50 psf and listed space quoted up to $21.00 psf.

The best way to analyze the decision is to first examine the worst, average, and best outcomes, as shown in Table 2, which compares the income from a range of lease prices psf compared to various periods remaining on the lease. The three price levels are the actual low, middle, and high rates for class A office tower space in downtown New Orleans.
Each combination of time remaining and assumed sublease price should be compared to the net savings from the buyout offer of $1,500,000. The current obligation is for a lease payment for 54 remaining months at $18.25 psf on 56,542 sf, for a total of $4,643,511. The buyout offer requires a one-time payment of $1,500,000, which is a savings of $3,143,511. ($4,643,511 minus $1,500,000 paid).
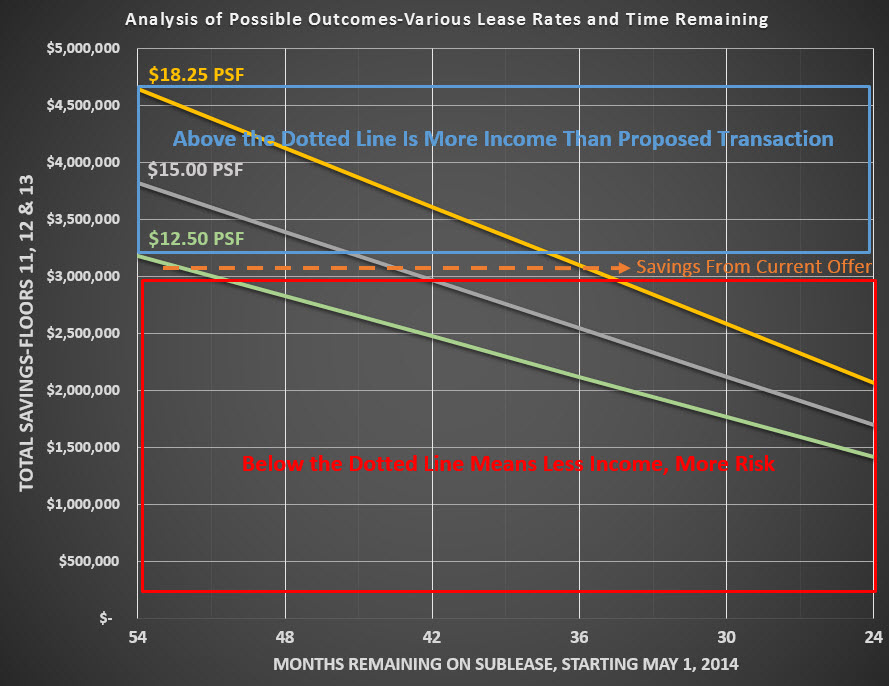
If the lessee could sublease the space for $12.50 psf, the space would have to be subleased almost immediately in order to reap more income than the proposed offer. At $15.00 psf, the space would have to be subleased within 12 months, or have 42 months remaining in which to earn enough income. At $18.25 per square foot, the space would have to be subleased within 18 months, in order to have 36 months remaining to produce the same savings.
The information in the table can best aid the decision-making process by illustrating it in chart form, with the dotted line depicting the savings from the proposed offer to buy out the lease.
Chart 1 shows that any situation above the dotted line represents a better alternative than the proposed offer, and any situation below the dotted line represents a worse scenario.

Going one step further to incorporate risk into the analysis produces a more-reliable decision. We might have a higher confidence level that the space will sublease around the $15.00 psf level, but we still don't know how long it will take to get it subleased. Of the 133,000 sf leased last year in New Orleans, the subject space represents 42 percent of that supply. Of the 133,000 sf, only three leases were 17,000-sf full floors. So the decision compares a finite cost of $1,500,000 against several likely outcomes.

Chart 2 further incorporates risk in commercial real estate by comparing the area in a blue box of all possible outcomes above the known savings (which is a better outcome) to a red box of all possible outcomes below the known savings (which is a worse outcome). Since the blue box is smaller than the red box, it is less risky to pay $1,500,000 to terminate the 56,542-sf lease than it is to try to lease the space for more income. By visualizing not only the numbers but the risk of all likely scenarios, you can make complicated decisions easier.
This article was written by broker Robert Hand and is a reprint from the August 2014 national publication Commercial Investment Real Estate, published by CCIM, an organization of the top commercial real estate brokers in the world with a membership of 13,000 in 30 countries.
Read the original publication at CCIM Archive CIRE magazine.