Prices for sales of office property have increased almost 20 percent per year the last few years while the office lease rate trend has stagnated, according to the latest research from the commercial property database Catylist. That's good news for new companies looking to get started with an address and lease office space and for existing companies who are outgrowing their current space. It is great news for office property owners who purchased just a few years ago and bad news for office property buyers today.
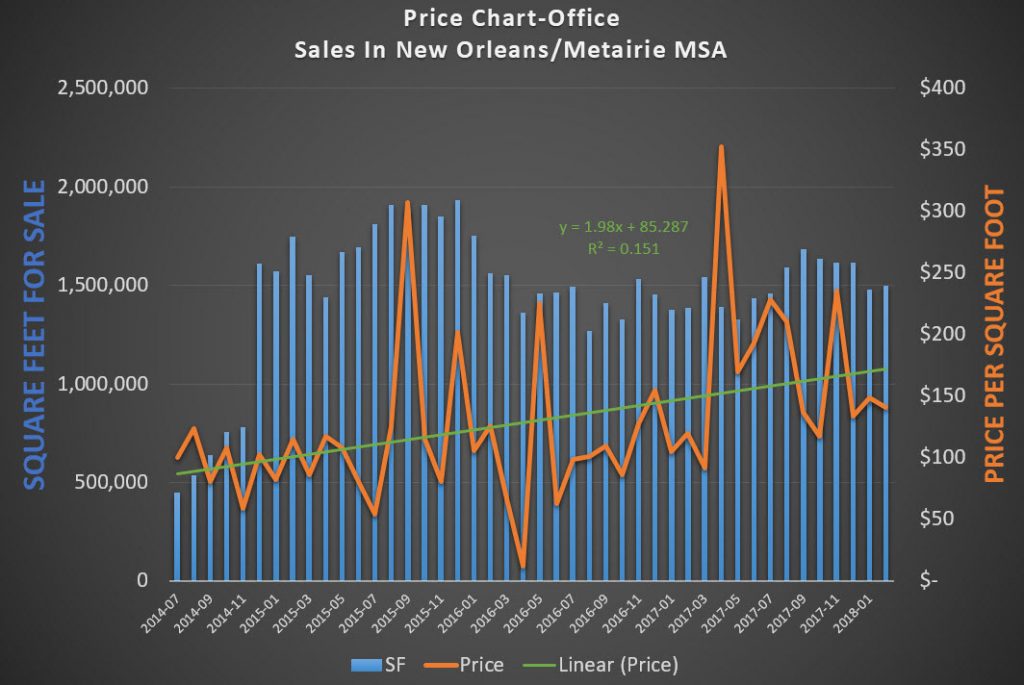
 The data show that sale prices have risen from $100 per square foot to $180 per square foot from 2014 to 2018, as measured by the orange line. Despite wide fluctuations from $50 per square foot to $350 per square foot, the average sale price has increased despite the supply also increasing from 500,000 square feet to 1,500,000 square feet. The data can also be used to calculate a trendline, shown in green, which determines the effect that the supply (measured in square feet) has on price.
The price data points in the above chart can be used to calculate a trendline which determines the slope or the rate of change in office sale prices. We use the formula:
where Y=Price Per Square Foot
M=Slope, or rate of change of X
X= Time
The trendline equation, Y=1.98X + 85.287, in the above graph shows that slope is 1.98, meaning each month that sale prices, on average, have increased $1.98 per square foot, so over the course of a year office sale prices increased approximately 24 percent and increased approximately 85 percent since July 2014. The bad news is that the other equation, called R Squared, shows how well the data fit the trendline, and only equal 15 percent. Normally you like to see 85 percent to have confidence that one set of data explains the second set of data. What this does help with is comparing prices of office sales to prices of office leases, which is explained below.

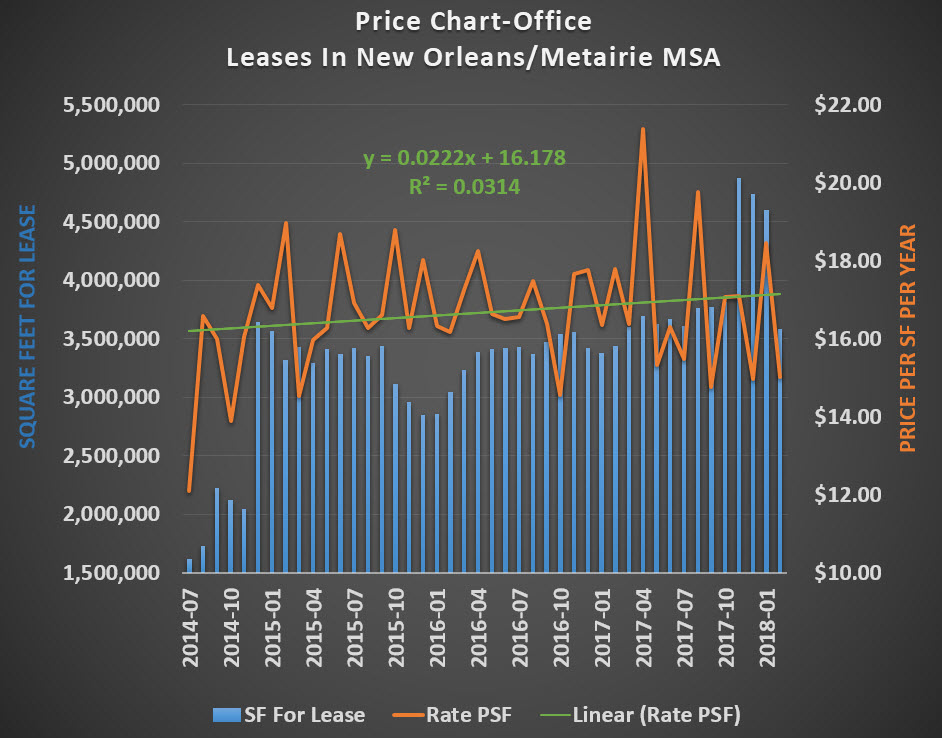
Prices for leasing office space in New Orleans and Metairie currently average $16 per square foot and have been at that level since 2014, except for a few months during that summer when both supply and price plummeted. There has been approximately 3,500,000 square feet of office space for lease (1,000,000 of this is downtown New Orleans Class A office space and 75% of that is full floor office space which is much more difficult to lease). Notice the green lease price trendline is almost flat and the R Squared value is only 3%.
The data gives us price points to help determine the current market for lease rates which is approximately $16 per square foot and the current market prices for office sales is $180 per square foot. These are snapshots at one moment in time. The trendlines tell us more valuable information, showing sale prices increasing 24 percent annually and lease prices flat. What we can conclude is that now is a great time to lease office space in New Orleans and Metairie since prices have not increased much, and the past few years have been a better time to own office property but purchasing office property now is more expensive, despite the fact that lease rates are flat. The reason sale prices are increasing is because cap rates have dropped. This is due to rising demand for income investments which is due to low treasury bond rates. Stay tuned for the next article on how to use convergent/divergent moving averages to know when the market peaks.