Of those that own commercial real estate, there are more assets in rental property than in IRA's, 401(k)'s and the median net worth of Americans. In the 2010 census, Americans were asked where they invested their money. Of the 118.554 households , the largest category of asset was the Interest Earning Account at a Financial Institution, with 69.8% of the households investing in that category. The second highest category was asset was a home at 65.9% of the households, as seen in the table below:
TOTAL |
|
Number of Households (thousands) |
118,554 |
| Interest Earning Assets at Financial Institutions | 69.8 |
| Other Interest- Earning Assets | 3.0 |
| Regular Checking Accounts | 28.4 |
| Stocks and Mutual Fund Shares | 20.4 |
| Own Business or Profession | 13.9 |
| Motor Vehicles | 83.9 |
| Own Home | 65.9 |
| Rental Property | 5.2 |
| Other Real Estate | 5.0 |
| Mortgages | 0.7 |
| U.S. Saving Bonds | 10.3 |
| IRA or KEOGH Accounts | 29.4 |
| 401K & Thrift Savings Plan | 42.0 |
| Other Assets | 3.7 |
The bar chart below shows what percent of households own various assets, using the data from the table:
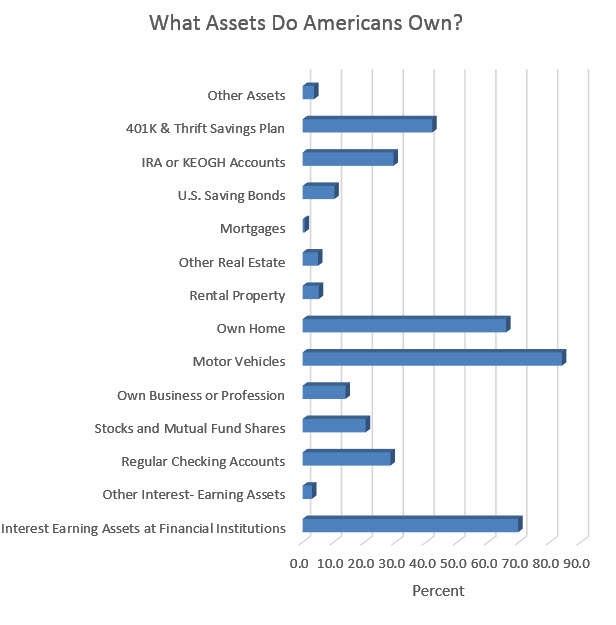
chart of assets
The value of the assets tell a different story, with the median value of assets in 2010 for the average American resulting in a net worth of $66,740, but only $15,000 if you exclude the equity in the home, as shown in the table below. The interesting number is the median value of commercial real estate, that is, rental property is $170,000 and other than home real estate equity is $75,000. So how can the rental property equity be higher than the net worth? Both numbers are after debt is subtracted. The answer is that not everyone owns rental property, but when all the values are calculated the values of rental property are higher than other categories. There is more than 5 times the equity in commercial real estate than in the average household's IRA or 401(k).
TOTAL |
|
| Net Worth | 66,740 |
| Net Worth (Excluding Equity in Own Home) | 15,000 |
| Interest Earning Assets at Financial Institutions | 2,463 |
| Other Interest- Earning Assets | 16,528 |
| Regular Checking Accounts | 600 |
| Stocks and Mutual Fund Shares | 18,300 |
| Equity in Business or Profession | 5,000 |
| Equity in Motor Vehicles | 6,237 |
| Equity in Own Home | 80,000 |
| Rental Property Equity | 170,000 |
| Other Real Estate Equity | 75,000 |
| U.S. Saving Bonds | 800 |
| IRA or KEOGH Accounts | 30,000 |
| 401K & Thrift Savings Plan | 27,000 |
| Other Assets | 24,000 |
Americans may have been created equal, but a vast difference exists between the races, as shown in the table below. Hispanics have less than 10% of the average net worth and blacks have 5% of the average net worth, compared to Americans as a whole. The economically disadvantages the two fastest growing populations, who have realized they control their destiny by voting the Democratic Party into office since the Republican Party has ignored their needs.
Net Worth |
|
| TOTAL | 66,740 |
RACE OF HOUSEHOLDER |
|
| White Alone | 87,906 |
| White Alone (Not of Hispanic Origin) | 110,729 |
| Black Alone | 4,955 |
| Asian Alone | 69,590 |
| Other (residual) | 15,795 |
| Hispanic Origin | 7,424 |
| Not of Hispanic Origin | 82,730 |
Another conclusion from the 2010 census was the median net worth of households according to education, with the median high school drop out having a net worth of 5% of the household with a bachelor's degree. This is why we will continue to experience crime in New Orleans until we find a way to get more students through high school and into trade schools. The assets New Orleans commits to higher graduation rates will easily pay for itself.
EDUCATION OF HOUSEHOLDER |
|
| No High School Diploma | 7,270 |
| High School Graduate Only | 42,223 |
| Some College, No Degree | 43,580 |
| Associate's Degree | 58,861 |
| Bachelor's Degree | 142,518 |
| Graduate or Professional Degree | 245,763 |
NOTE: In dollars. Excludes group quarters. (B) - Base is less than 200,000 households. Individual outliers that highly influenced the mean value for asset categories were excluded. "Other Assets" includes mortgages held for sale of real estate, amount due from sale of business or property, and other financial assets. Federal surveys now give respondents the option of reporting more than one race. There are two basic ways of defining a race group. A group such as Black may be defined as those who reported Black and no other race (the race-alone or single-race concept) or as those who reported Black regardless of whether they also reported another race (the race alone-or-in-combination concept). This table shows data using the first approach (race-alone). The use of the single race population does not imply that it is the preferred method of presenting or analyzing data. The U.S. Census Bureau uses a variety of approaches. Because Hispanics may be any race, data in this table for Hispanics overlap slightly with data for the Black population. Data for American Indians and Alaska Natives are not shown because of their small sample size. The race or Hispanic origin of the householder designates the race or Hispanic origin of the household. The estimates in this table are based on responses from a sample of the population and may differ from the actual values because of sampling variability and other factors. As a result, apparent differences between the estimates for two or more groups may not be statistically significant. For information on sampling and nonsampling error see: http://www.census.gov/sipp/source.html
Source: U.S. Census Bureau, Survey of Income and Program Participation, 2008 Panel, Wave 7; www.louisianacommercialrealty.com
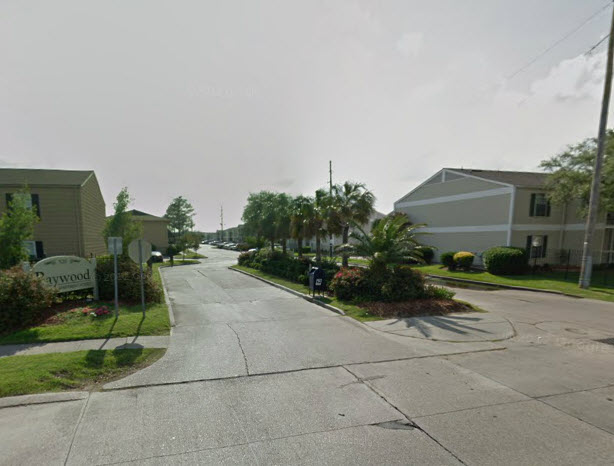
![]() The West Bank was not affected by Hurricane Katrina, except that the population increased dramatically there and apartment occupancy skyrocketed. One beneficiary was 94 percent occupied Baywood Apartments, previously Carlyle Apartments, which was sold last month for $18,000,000. The buyer was not local, a real estate investment company in California called Delta Alliance, founded by Robert Warren with a typical started at the bottom pedigree:
The West Bank was not affected by Hurricane Katrina, except that the population increased dramatically there and apartment occupancy skyrocketed. One beneficiary was 94 percent occupied Baywood Apartments, previously Carlyle Apartments, which was sold last month for $18,000,000. The buyer was not local, a real estate investment company in California called Delta Alliance, founded by Robert Warren with a typical started at the bottom pedigree:
President of Investor Property Services (IPS), a 30 year old property management firm based in Orange County California. Through IPS, Warren has personally supervised a multi-million dollar property portfolio including such diversified assets as multifamily, office complex, shopping center, condominium association, medical office, assisted living and hotel/motel businesses with an emphasis on non-performing assets owned or controlled by financial institutions, state court receiverships, and bankruptcy court authorities. Warren has acted a superior court receiver for income property in a variety of states and possesses a proven ability to analyze, operate and turnaround underperforming assets. Mr. Warren is a Certified Property Manager (CPM®) through the prominent and renowned industry organization, the Institute of Real Estate Management. Warren has taught property management at California State Polytechnic University was the 2005 co-chair of the Los Angeles/Orange County chapter of the California Receiver’s Forum and is the 2003 past president of the Institute of Real Estate Management Orange County Chapter #91.Mr. Warren holds a BA in Economics and a Master’s in Business Administration.
Delta has 20,000 units under management and 2.5 million square feet of commercial space in nine states.

Baywood Apartments Sell For $18 Million
The site, shown above in red outline, is 288 units on 12 acres with 242,000 net rentable area, with rents on one bedrooms at $730 per month and $930 on two bedrooms. Built in 1984 with 535 parking spaces and 26 separate buildings, the gated community has pools, exercise rooms, central A/C and poor reviews on Google from tenants. Estimated rental income is $2.5 million with 50% expenses resulting in a forecasted $1.25 million NOI, which means the cap rate was 6.94%. For a detailed description of how New Orleans commercial real estate is value based on cash flow, see our article at https://louisianacommercialrealty.com/2012/04/how-to-value-commercial-real-estate/.
Baywood-288 units
Copyright, wwwlouisianacommercialrealty.com.
Sources: deedfax, court records, http://www.deltaacmllc.com/pressreleases.aspx
Drugs are a big money business. Especially legal drug stores like Walgreens. Who else could justify paying $94 per square foot for land and a beautiful building only to demolish the building? That's New Orleans commercial real estate at work utilizing the principal of highest and best use. The result is the most profitable businesses can make it feasible to acquire the best locations, driving the price to new market levels. Here is a secret to successful commercial real estate investing in New Orleans: the market value is based on the value of the business operating at that location, not on the previous sales of nearby property which is how most banks loan money-based on appraisal values.
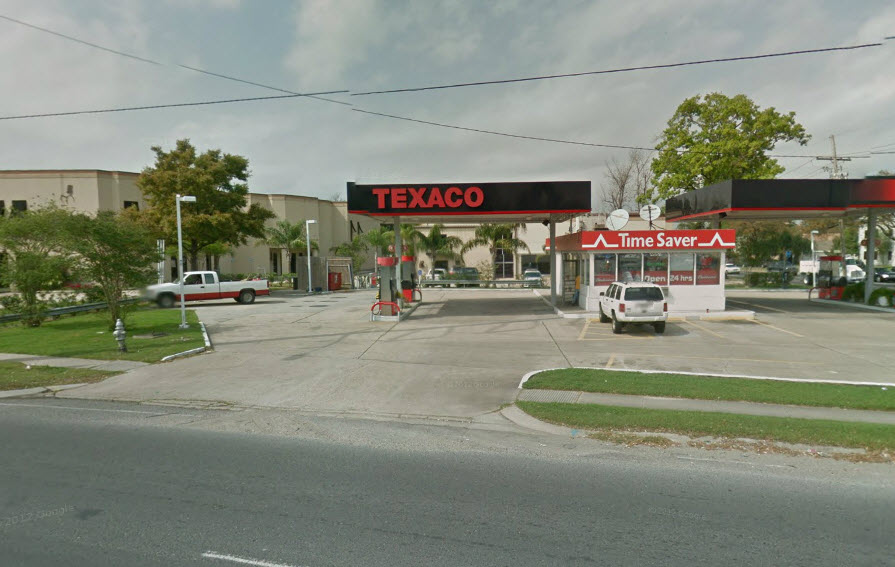
scandinavia site sells for $6.975mm
Walgreens Louisiana purchased the 63,000 square foot L-shaped site for $6 million from Hans Thomsen and Patsy Monk last month and didn't even get the corner 15,000 square foot Texaco site with it, which was purchased separately for $975,000. For other big money New Orleans commercial real estate transactions, see the latest report at https://louisianacommercialrealty.com/2013/03/big-money-new-orleans-commercial-real-estate-transactions-2013/.
The demographics are that good and the population count within a 5 minute drive time is not extraordinary, but the traffic count is between 40,000 and 60,000 cars per day at the intersection, shown below with the site outlined in red.

4513 Airline Highway-Future Walgreens
To find the traffic count for strategic locations in the state, go to http://www.dotd.la.gov/highways/tatv/default.asp. You can select the parish and a list of locations for a traffic count by year, updated to 2011. It is the most accurate database.
Copyright, www.louisanacommercialrealty.com; LOTD
For Immediate Release
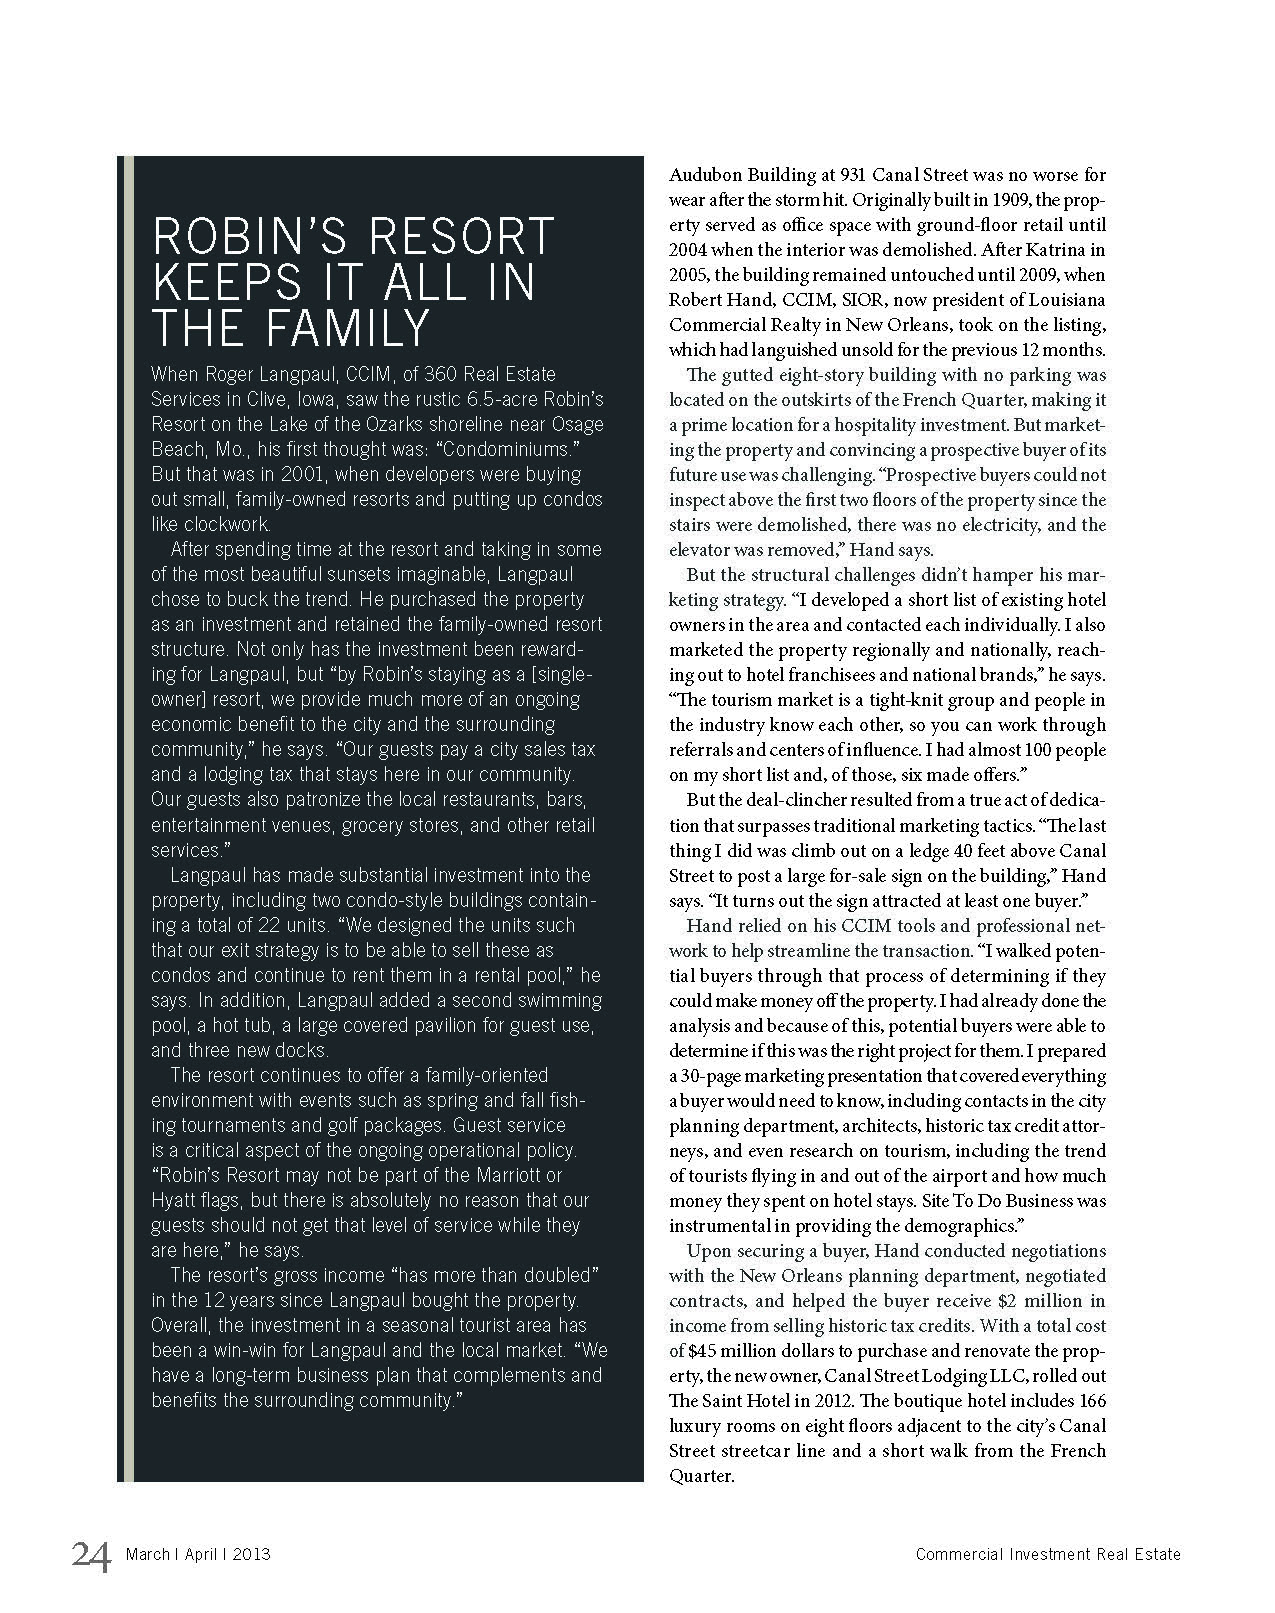
New Orleans — March 29, 2013 — Robert Hand, CCIM, president of New Orleans based Louisiana Commercial Realty, discusses commercial real estate activity in tourist-oriented markets in the March/April issue of Commercial Investment Real Estate, the magazine of the CCIM Institute. Robert explains the challenges of commercial real estate development for local a vacant 8-story building on Canal Street, which is now called The Saint Hotel. The article is published at https://louisianacommercialrealty.com/2013/03/new-orleans-commercial-real-estate-expert-discusses-tourist-based-markets/.
###
![]() About the Louisiana Commercial Realty, LLC
About the Louisiana Commercial Realty, LLC
Based in New Orleans, Louisiana, Louisiana Commercial Realty, LLC is a top rated full service commercial real estate broker, licensed in Louisiana and Mississippi. We specialize in marketing large complex commercial real estate properties, and representing buyers of industrial, hospitality and retail sites. The president, Robert Hand, is the only commercial real estate broker in Louisiana with the CCIM and SIOR designations as well as an MBA.


![]() New Orleans commercial real estate depends on a thriving national economy. We just experienced, in 2008, the worst recession in history, and New Orleans managed to pull through due to reconstruction spending which kept the unemployment rate in the 4%-5% range compared to the national average at 7%-9%. As the FEMA funds dwindle down, the national economy will play a bigger role in the continued growth of the local economy, which is driven by the hospitality, medical, petrochemical industries.
New Orleans commercial real estate depends on a thriving national economy. We just experienced, in 2008, the worst recession in history, and New Orleans managed to pull through due to reconstruction spending which kept the unemployment rate in the 4%-5% range compared to the national average at 7%-9%. As the FEMA funds dwindle down, the national economy will play a bigger role in the continued growth of the local economy, which is driven by the hospitality, medical, petrochemical industries.
Personal income growth is one measure of how the economy is performing, since consumer spending drives about 2/3 of the economy. Today's news from the Bureau of Economic Analysis is that personal income grew $127.8 billion, or 1.1 percent in February 2013 from the previous month. Personal consumption expenditures (PCE) increased $77.2 billion, or 0.7 percent. In January, personal income decreased $513.5 billion, or 3.7 percent, DPI decreased $498.3 billion, or 4.0 percent, and PCE increased $40.8 billion, or 0.4 percent, based on revised estimates. The January change in disposable personal income (DPI) mainly reflected the effect of special factors, such as the expiration of the “payroll tax holiday” and the acceleration of bonuses and personal dividends to December in anticipation of changes in individual tax rates. Excluding these special factors and others, which are discussed more fully below, DPI increased $46.8 billion in February, or 0.4 percent, after increasing $15.8 billion, or 0.1 percent, in January.
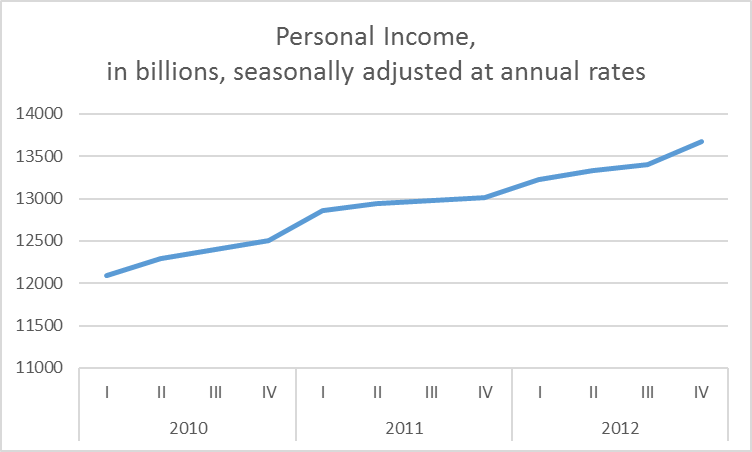
personal income since 2010
Source: Bureau of Economic Analysis, Chamber of Commerce.
Copyright www.louisianacommercialrealty.com
The millionaire matchmaker hit New Orleans commercial real estate recently with these big money transactions for banks, shopping centers and hotels. Examining commercial real estate development in New Orleans gives us an idea of where the future growth will be, and these 6 projects are good indicators of big money activity.
The 108 room St. Christopher Hotel at 200 Magazine sold in 2011 for $3,430,000 to David Francis. The hotel flies a Best Western flag and the building was dates back to 1882 when land was donated to Tulane University, and architects Sully and Toledano designed the tallest building in New Orleans to house a dry goods store.

200 magazine sold for $3.4mm
The next time you are pumping gas and getting coffee at a convenience store, enjoy the fact that you are in a multi-million dollar business. Circle K Stores proved it again when they purchased the Lee Circle location from Exxon for $3.5 million in 2001. The site last sold in 2003 for $750,000- a better return than gold and Google.

704 howard sold for $3.5mm
539 decatur sold for $2.3mm
915 South White for $2,300,000-warehouse near Jefferson Davis and Earhart.
5952 Tchoupitoulas for $2,250,000, almost the entire block at the corner of State Street. Nothing yet announced but smart purchase in a great location.
3412 St. Charles Avenue-land at the corner of Louisiana Avenue for Iberiabank location sold for $4,000,000.
![]() The third estimate for how fast the economy grew last quarter is out, and the answer is 4/10 of one percent. Real gross domestic product -- the output of goods and services produced by labor and property located in the United States -- increased at an annual rate of 0.4 percent in the fourth quarter of 2012 (that is, from the third quarter to the fourth quarter), according to the "third" estimate released by the Bureau of Economic Analysis. Growth of 4/10 percent is too slow for many commercial real estate projects to be feasible, but New Orleans commercial real estate thrives on tourism and the hospitality industry and has proven to correlate less with the national trend.
The third estimate for how fast the economy grew last quarter is out, and the answer is 4/10 of one percent. Real gross domestic product -- the output of goods and services produced by labor and property located in the United States -- increased at an annual rate of 0.4 percent in the fourth quarter of 2012 (that is, from the third quarter to the fourth quarter), according to the "third" estimate released by the Bureau of Economic Analysis. Growth of 4/10 percent is too slow for many commercial real estate projects to be feasible, but New Orleans commercial real estate thrives on tourism and the hospitality industry and has proven to correlate less with the national trend.
Governments are unique entities that get several attempts to estimate data, unlike the private sector that only gets one shot to forecast trends and does so with often incomplete data. GDP is estimated by the Bureau of Economic Analysis. First, they release the advance estimate, then the 2nd estimate and then the final and 3rd estimate.
In the third quarter, real GDP increased 3.1 percent, so growth, while still positive, slowed dramatically. The GDP estimate released today is based on more complete source data than were available for the "second" estimate issued last month. The table below shows all three estimates for 4Q 2012 GDP.
Advance Estimate Second Estimate Third Estimate
Real GDP -0.1 0.1 0.4
Real GDP increased 2.2 percent in 2012 (that is, from the 2011 annual level to the 2012 annual level), compared with an increase of 1.8 percent in 2011.
The increase in real GDP in 2012 primarily reflected positive contributions from personal consumption expenditures (PCE), nonresidential fixed investment, exports, residential fixed investment, and private inventory investment that were partly offset by negative contributions from federal government spending and state and local government spending. Imports, which are a subtraction in the calculation of GDP, increased. The chart below shows GDP growth since 2010 has been positive but inconsistent, making it difficult for businesses to commit to long term investment and adding people to the payroll.

4Q2012 GDP 3rd estimate-0.4% Growth From 3rd Q 2012
The Big Picture
Growth in the 4th quarter of 4 tenths of one percent is slow growth, and the chart below of the longer term trend in GDP shows that of the 88 quarters since 1990, there were only 5 quarters of similar slow growth plus 3 recessions of negative growth.
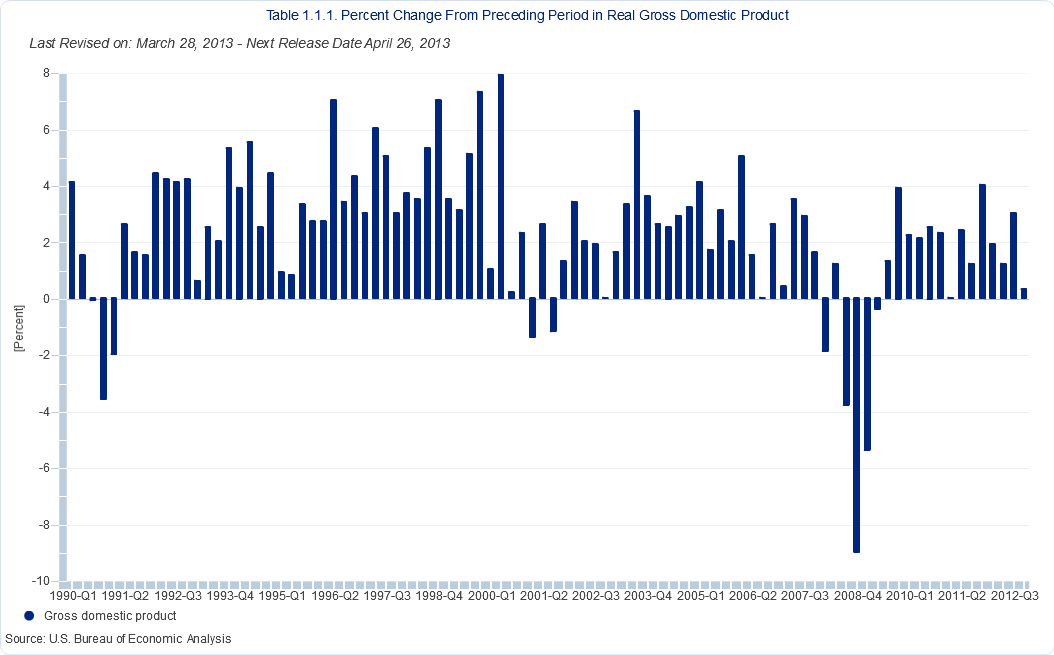
gdp quarterly since 1990
Source: Bureau of Economic Analysis
Copyright, www.louisianacommercialrealty.com
Commercial real estate is known for high value transactions, and New Orleans has its share of movers and shakers looking to put commercial property to its highest and best use.
New Orleans is almost 300 years old and was once the largest port in America, before there was an America. In 1886, New Orleans Cold Storage was founded to make ice for the rail cars and sailing ships, and 129 years later Hurricane Katrina brought the site at 3401 Alvar at least seven feet of water. The site has never been the same. Last month the leasehold interest was sold to Alvar Properties, owned by Jack Jensen. The property is owned by the Port of New Orleans and leased to New Orleans Cold Storage, but they can sell the rights to their lease to a third party. The value of that leasehold interest (tenant's possessory interest created by a lease) was $1,025,000, according to parish courthouse records. The leasehold interest is different from the leased fee interest which is the ownership interest (freehold) where the possessory interest has been granted to another party by creation of a contractual relationship (lease).
The 1,000,000 cubic foot building will be put to a higher and better use by the new tenant, Jack Jensen, owner of TCI Trucking who also leases the warehouse nearby at 3900 France Road. Christian Jensen, President of TCI, said, "There was a 27-acre tract available at the Port of New Orleans that opened tremendous opportunities for us as a company and would also benefit the community. We teamed up with the State of Louisiana and local agencies to raise the capital to build a 150,000 SF facility, which would serve as our warehouse, packaging plant and headquarters. He added that the new facility is connected to the 6 Class-1 railroads in North America through the New Orleans Public Belt Railroad." The packaging process at TCI is very convenient. Rail cars can park on two spurs located alongside TCI's facility. A pneumatic conveyer pulls resins or PVC powder into a silo over the net weighing system just above the TOPAS. After packaging, the goods are palletized and ready for transport by truck or ship.

New Orleans Cold Storage Site
One day CityBusiness will put together a list of people who made millions due to Hurricane Katrina, and the local shoring companies will surely be among the top. The 30,000SF building at 510 Bienville was purchased last month by Chris Cancienne, owner of Orleans Shoring, for $2.5 million, with plans to build 26 high-end condo units costing $6.5 million to renovate and proving there are lots of opportunities to make money when you put commercial real estate to its highest and best use. Cancienne’s company, Orleans Shoring, ignited a controversy in late 2011 when one of its salesman, posing as a potential customer, caught rival firms on undercover video allegedly violating rules of the state’s Hazard Mitigation Program.

516 Bienville
Malta Park, 1101 Aline Street at Magazine Street in the Garden District, sold to Homelife In The Gardens for $8.3 million last month. They offer assisted living, memory care and independent living. We'll all be there one day.

malta park
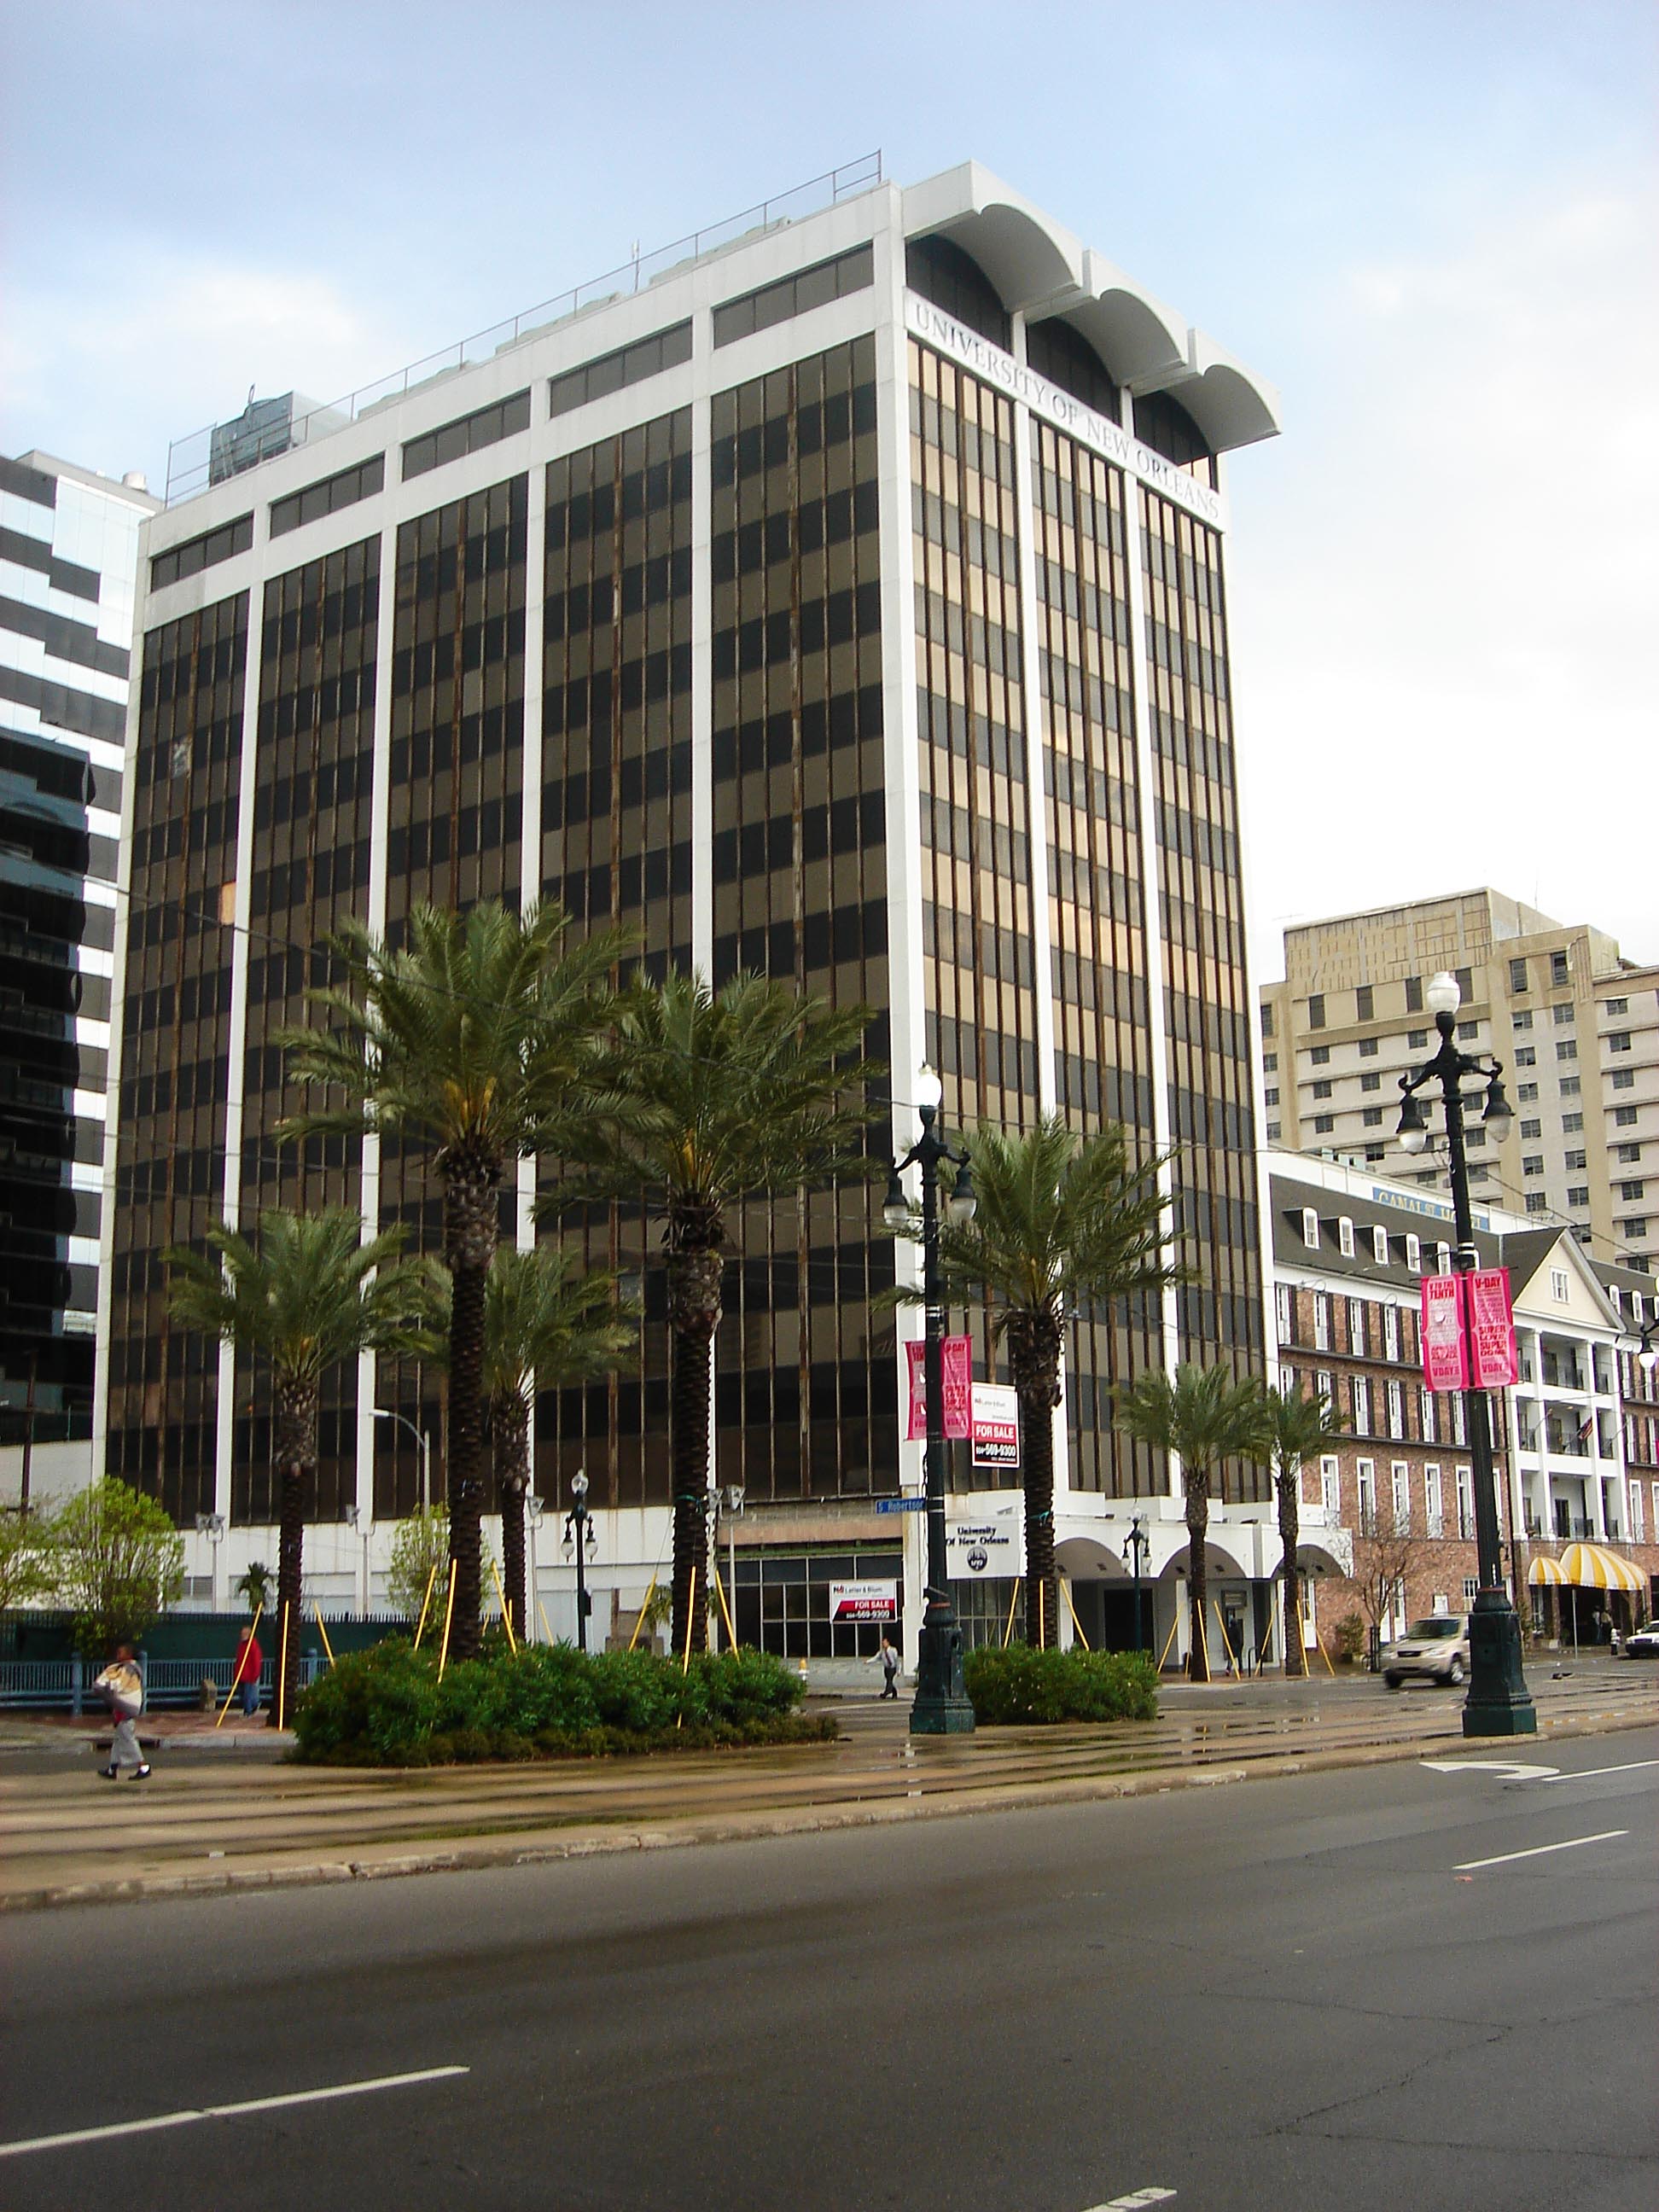
ODECO was Ocean Drilling and Exploration Company, a stock traded company in the early 1980's that made New Orleanians rich as they gasped every time oil prices rose $1 a barrel. Nowadays it doesn't even cause a sigh. ODECO gave the building at 1600 Canal Street to UNO who tried to sell the site after Katrina for $6 million and finally settled for $1 million last month. The building is 121,000 square feet on 13 floors with glass window exterior and steel structural columns and pre-cast concrete floors on a 3,000 PSI concrete slab.
The site had asbestos but was mitigated and still priced assuming lots of risk. There is risk we know and risk we don't know. It's the risk you don't know that you have to account for when you buy commercial real estate.
1600 canal-sold for $1,000,000
Banks don't want to own property, and are always afraid when they take property back because they know buyers take advantage of them. 2001 Canal Street was a classic example of all the wrong ways to develop property. The site is too far from the French Quarter for condos. The developer took too long to renovate the site and then was unable to sell the condos. Iberia Bank took the property back from the developer and sold the 21 mostly finished (70%) condo units for $800,000 last month to another developer. The 9,400SF building on 3 floors sits on 46,000SF of land opposite the $2 billion dollar VA and LSU hospitals being developed. The site will never be feasible for condos and there is no demand for doctor's offices since the hospital site will accommodate everyone, but there is a need for communal hotels, or hostels, which are popular in Europe, for those who travel to New Orleans on a budget. Opportunities exist in addressing the demand of the hospitality industry in New Orleans, but you have to think outside the box.

2001 canal
For new developments in the hospital area, see our newsletter https://louisianacommercialrealty.com/2012/10/tulane-land-sale-brings-highest-price-in-history/.
A few years ago our company visited the New Orleans East City Councilman at the time, Jon Johnson, to discuss efforts to develop $20 million dollar apartments where there was only vacant land in which nearby residents dumped their garbage. His most memorable statement was that I left my briefcase that might have a wad of money in it. No wonder businesses take such a long time to come to the east. Jon is long gone and there is a new sheriff in town and the east is full of opportunity. Last month Wal-Mart (technically one word with hyphen but can be spelled WalMart) spent $5.7 million on 28 acres at 6000 Bullard Avenue at I-10, at the site of a former fertility clinic. They are still trying to sell their former 22 acre site just down the road but on the wrong side of I-10 at Read Road for $3,500,000.
See their annual report at http://www.walmartstores.com/sites/annual-report/2012/WalMart_AR.pdf.
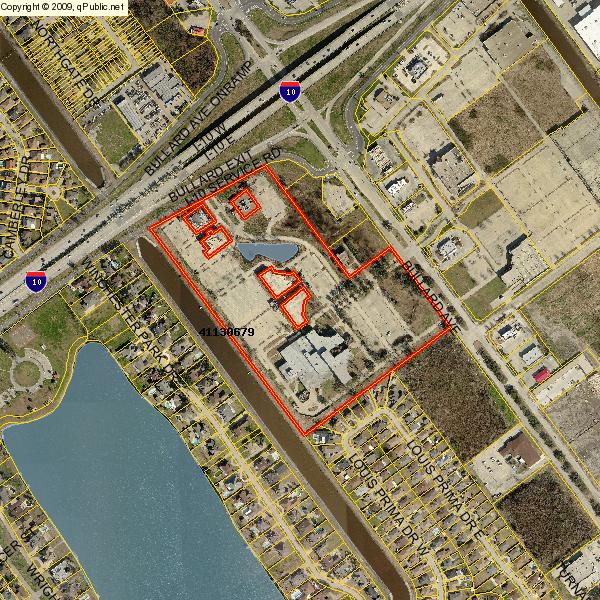
universal health 20 acres bullard
Tired of the $40 PSF rent at Jefferson and Tchoupitoulas, Walgreens paid $3.3 million to the American Legion for 10,400SF with no parking in front. That's $329 PSF, before renovation costs. How is that feasible? Developers sell the Walgreens leases which are for 20-40 years and based on income and since current 30 year treasuries are quoted at 3.09%, when you price the cash flow of a triple net lease at say $30 PSF for 10,000SF, you have an income stream of $300,000 which calculates to a present value of $5,583,000 at a 3.5% yield. That leaves $1.2 million for renovation, or $115 PSF, with a profit to the developer of $1 million. Too bad the American Legion Pension Fund didn't figure that out themselves.
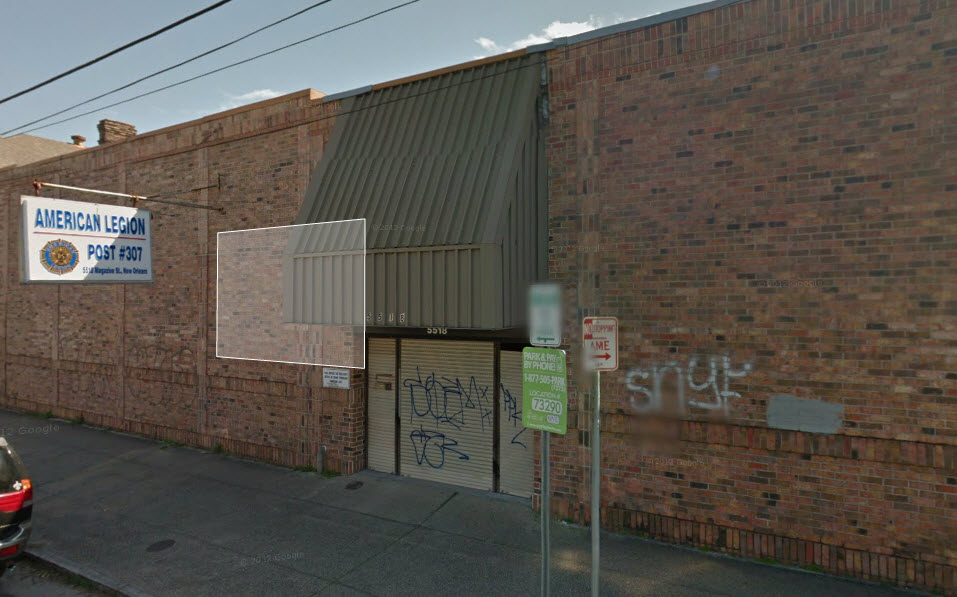
5518 magazine
Copyright, www.louisianacommercialrealty.com.
Sources: Notarial Archives. Courthouse Records. deedfax.
Commercial real estate activity in New Orleans cooled down in the first quarter of 2013, after a heated 4th quarter in 2012 when buyers hurried to close by the end of the year.
There is currently 9.4 million square feet of commercial space for sale at a total sale price exceeding $800 million, and 10.4 million square feet for lease, but the number of listings varies among the eight major New Orleans commercial real estate categories. Among the 2,000 properties for sale in the New Orleans MSA by the end of February 2013, the majority are office properties, followed by vacant land then industrial sites, as shown in the table below:
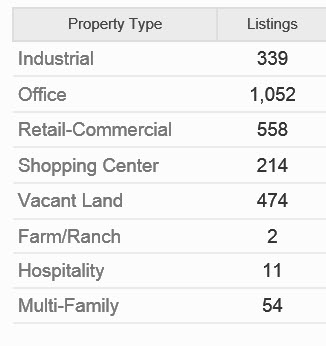
listing count
In the office market there is 5.3 million square feet available for sale and for lease, as of the end of February 2013. Office lease offerings were 909 sites totaling 3.9 million square feet, up 10% from the average the last 12 months. Office property for sale was about the 12 month average at 143, or 1.4 million square feet. In February 2013, 22 properties were leased averaging $18 per square foot and two were sold averaging $69 per square foot, down 15% from the asking sale price. The New Orleans MSA average office asking lease rate at the beginning of the 4thQ 2012 was $16.10 per square foot, higher than the state average but lower than the city and parish asking prices, as shown in the chart below.
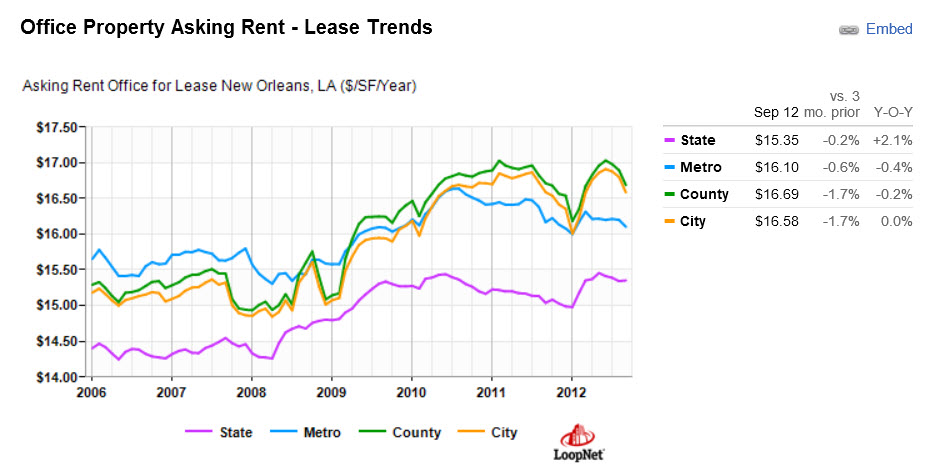
chart office lease prices
The average office property that sold or was leased was on the market 556 days, twice the average of 287 days, so some of the more difficult office properties that have been on the market a long time have finally found new owners. That is a typical sign of a healthy market.
The average asking sale price for office property in the New Orleans MSA was $103 per square foot at the beginning of the 4thQ 2012, about 10% higher than the state average and 25% higher than the city average, as shown in the chart below.
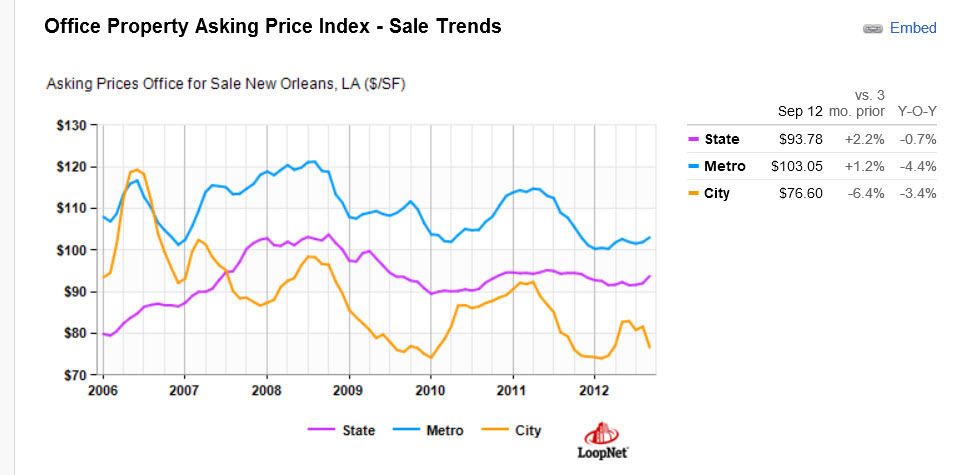
chart office asking prices
For U.S. Census purposes, the New Orleans MSA includes seven parishes: Jefferson, Orleans , Plaquemines, St. Bernard, St. Tammany, St. Charles, and St. John the Baptist, and has a total population of 1.17 million.
For a refresher on last quarter's trends in New Orleans commercial real estate, see our newsletter at: https://louisianacommercialrealty.com/2012/11/trends-in-new-orleans-commercial-real-estate/.
In our next issue, we will cover the trends in other New Orleans commercial real estate categories: industrial and retail.
Copyright www.louisianacommercialrealty.com.
Sources: US Census Bureau.
If revenues are any sign of economic health, the economy is in the best shape in years. For the 12 months ending 2012, revenues from all 50 states and DC from state and local taxes totaled $399 billion, up $97 billion from the previous period, according to the latest census. The chart below shows the tax revenues for the states for the latest 12 month period, in millions.

Tax Revenues, in Millions
Louisiana received most of its tax revenues from individual income taxes in 2012 with sales tax receipts a close second. There is a wide gap between revenue sources; for example, revenue from property tax in Louisiana totaled only $12 million which includes commercial real estate. Notice how little revenues are received from corporate income taxes and documentary taxes. Expect to see Governor Jindal introduce legislation to capture some of these missing revenue streams. Louisiana received $206 million in severance taxes, which is the oil and gas industry, ranking 5th behind Alaska at $1.3 billion, Texas at $1 billion, North Dakota at $332 million and New Mexico at $209 million.
Louisiana's revenue sources differ from even neighboring states. Alabama received $68 million in corporate income taxes compared to Louisiana at $17 million. Florida received $467 million from documentary taxes compared to Louisiana's figure that was too little to count. How the state taxes varies widely from other states and, as the table below shows, there are many revenue streams available.
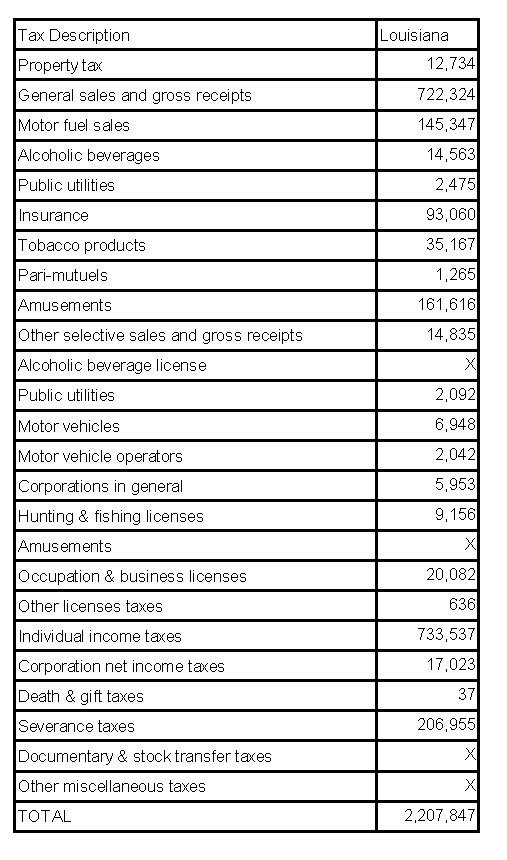
Table of Taxes For Louisiana Revenues 2012, in thousands
Source:www.louisianacommercialrealty.com; Summary of State and Local Government Tax Revenue: 4th Quarter 2012 — This summary shows quarterly tax revenue statistics on property, sales, license, income and other taxes. Statistics are shown for individual state governments as well as national estimates of total state and local taxes, including 12-month calculations. This quarterly survey has been conducted continuously since 1962. Internet address: <http://www.census.gov/govs/qtax/>.
One aspect of a vibrant economy is that businesses and commercial real estate always moves from weak hands to strong hands, and recently, several large commercial real estate properties did just that.
The most powerful New Orleans economic driver is the hospitality industry, a shift originating in the 1980's that moved New Orleans away from the petroleum industry toward hotel, restaurant and retail development. One sale for $12,475,000 was 881 Convention Center Boulevard, the Hyatt Hotel brand called Hyatt Place. It is a 170 room upscale facility covering the entire block (square 9, lot A) even though the footprint only measures 121' by 128'. The hotel only has three meeting rooms, ranging from 432sf to 1,127sf, which reduces demand for region corporate functions tied in to convention center meetings. Offering meeting room space has been a strategic decision by most local hotels in order to increase demand for rooms. The hotel was sold by Hotel NO Partners to Hotel NO Holdings in 2011.

new orleans commercial real estate--881 convention center boulevard
The New Orleans Shopping Center sold for $12,930,189 by the Hertz Investment Group who acquired the New Orleans Centre in October, 2003. The Hertz Investment Group sold the site as part of a set of properties to the family of Tom Benson, owner of the NFL Saints football team. The site is the focal point of Champion's Square, in between the Superdome and the Hyatt Hotel.

champions square
Approximately 30 lots sold in the Tall Timbers subdivision along Woodland Highway for $14,750,000 by 4254 Maple Leaf Drive, LLC, owned by Joseph Jaeger, Jr. of Metairie. These were apartments opposite the large storage center at the corner of General DeGaulle and Woodland Drive which were purchased in 2003 for $9,200,000.

woodland at gen degaulle
The Lowe's at 2501 Elysian Fields sold by Merrick Clayton, LLC, owned by Robert W. Merrick at Latter and Blum and Greg Clayton in Hahnville, for $28,473,942 to CLF Elysian Fields, which is a New York real estate investment trust specializing in single tenant properties with long term leases. Caplease is a public company valued at 450 million (LSE) that lost $11.7 million in 2012. The stock trades around $6 and pays a 4.90% dividend currently based on that price.
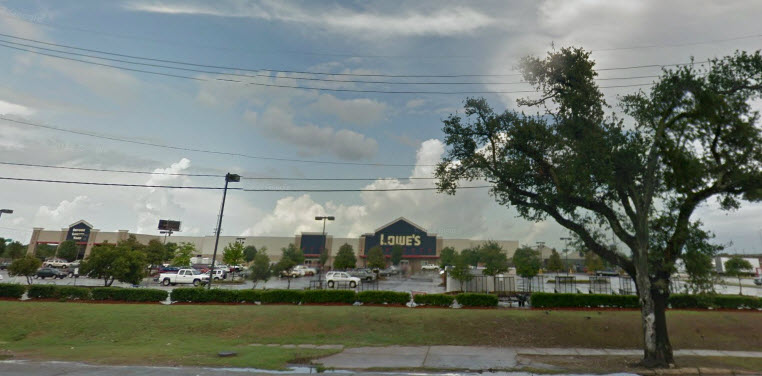
lowes 2501 elysian fields
One Shell square Sells For $102 Million
Metropolitan Life sold the first large skyscraper in New Orleans, One Shell Square, for $102,000,000 to CommonWealth, a Massachusetts real estate investment trust. Built in 1972 with architect Skidmore, Owings and Merrill, the building has 51 floors and 782 parking spaces, mimicking the One Shell Plaza in Houston, Texas. It was the tallest building in the Southeast when constructed but with the exodus of petroleum company employees back to Houston, the building suffered a low occupancy rate. Insurance companies have a business model that takes insurance premiums, factors in an expected payout from a predicted claim rate, and invests to meet those long term payments. Commercial real estate is the investment of choice for these high value investments by insurance companies. The sale price was $81.60 per square foot, less than the $90.49 per square foot paid for the Pan American Life center a few blocks away which sold for $60,900,000.

One Shell Square-New Orleans
Sources: www.louisianacommercialrealty.com; deedfax
| Federal Tax Policy with Fiscal Cliff Updates |
| Federal tax code has not substantially changed for over two decades. 2013 brings a new set of rules and guidelines for all U.S. tax payers. Keep in mind that filing for 2013, is not due until April 2014. Individuals, families and businesses across the board (not only higher-income individuals or households) will be to some degree, impacted by federal tax rate changes negotiated through the fiscal cliff deal.
Capital Gains/Carried Interest 3.8 Percent Healthcare Tax Payroll Tax Alternative Minimum Tax Exemptions and Deductions Estate and Gift Tax Depreciation ("bonus") Leasehold Improvements Income Tax Rates On January 3, 2013 the Internal Revenue Service released a guide on new federal tax rates, Updated Withholding Guidance for 2013. The fiscal cliff negotiations did not produce changes to federal tax policies on depreciation recapture or passive loss. |
New Orleans' CityBusiness magazine interviews Robert Hand, President, Louisiana Commercial Realty, on New Orleans' commercial real estate. New trends show there is some speculation in buying of commercial properties that have been on the market much longer than the average property. This is a classic sign of a healthy commercial real estate market. here is the text of the article.
"Office and retail space in the New Orleans region is moving with increased frequency, and many of the properties changing hands through sales and leases have lingered on the market for extended periods of time, according to data from Louisiana Commercial Realty. That suggests deep-pocketed speculators and other investors are diving into the distressed property market, which Louisiana Commercial Realty owner Robert Hand considers a healthy sign for the local economy. He dissected the data in a November 16 conversation with CityBusiness.
Can speculation be a problem if it’s just speculation only? It’s a healthy sign. What I am deducing is that these properties these are not loved because they have been on the market almost twice as long as normal . They are usually blighted properties that require lots of attention. Maybe they are in a tough neighborhood.
But buyers recently have come along and decided to speculate and buy these things that previously were difficult properties. If they weren’t difficult properties, they wouldn’t have been on the market for very long. We can rule out whether they were on the market an extraordinary long time due to being overpriced because on average they were sold near the average price for properties over the last 12 months — that shows a healthy commercial market. It shows a healthier economy.
The asking office lease rate is dropping. Are lease rates simply dropping enough that they are stimulating movement? The properties that sold or leased were transacted at 15 percent below the list price, which is about average of what we’ve seen the last 12 months. The only unusual thing is office properties leased or sold recently were also on the market a lot longer than normal.
If you look at the asking lease price, it was $16.74 versus the last 12 months at $17.39. So of the properties that were leased or sold, it doesn’t appear they were overpriced. The lease and the asking price were both under the average.
Retail listings are up, as are days on the market for those sold or leased. Does this mean that space not previously in demand is moving because retail is expanding? People want the low-hanging fruit first. When property on the market for a long time finally starts being leased or sold, it means that speculators are coming into the market. That’s really a healthy sign.
Buyers are now more willing to take risks. Normally the banks won’t loan money for speculation. This tells us probably the buyers might have deeper pockets with more equity. They are willing to buy those difficult, unloved, properties that up until now they weren’t.
Industrial property listings are increasing. Is it a buyer’s or seller’s market in the industrial sector? I still think it’s a buyer’s market in the industrial sector because you still have a lot of what I call elasticity, which is, of the additional supply that comes on the market, how does that affect price? What we are seeing is people looking to buy and lease is still pretty price sensitive.
The average property leased in the industrial sector leased for $4.59 a square foot, which is down almost 50 percent from the 12-month average, which was $6.18 a square foot. Some of that depends on the area. Elmwood is $6, Mid-City is $4.50 and New Orleans East is $2.50. But on average what we saw recently was industrial properties that were leased at prices below the last 12 months which is a buyer's market.
There’s more vacant land available, both in the number of listings and millions of square feet. The days on the market are much fewer. What does that tell us? It’s not really a seller’s market because the prices are not higher than normal. Of the properties that were sold, they were sold 24 percent below the list price. Sometimes it’s just because land is hard to value sellers price land too high.
It really depends on what you are going to use it for. You can have somebody that is going to put it in the gas station that makes it highly profitable, and they are willing to pay more for it than someone who is going to put in a parking lot which is less profitable."
Source: http://neworleanscitybusiness.com/blog/2012/11/20/qa-with-robert-hand-louisiana-commercial-realty/
New Orleans' Industrial real estate supply is up, lease prices are up but sale prices are down. In the industrial sector so far in the month of November, there are 110 properties for sale totaling 3.2 million square feet, an 18 percent increase in supply over the last 12 months. The average asking sale price is $39.48 per square foot, down about two percent from the last 12 months, and the average asking lease rate is $4.52 per square foot, up about 3 percent over the last 12 months. The surprising number is that it took 188 days to sell or lease industrial property, which was 27 percent faster than normal. The last 12 months witnessed an average of 5 properties leased and 2 properties sold each month.
In June 2006, Robert Armbruster purchased a 40,000 square foot of land at 1667 Tchoupitoulas for $1,100,000 financed by Gulf Coast Bank. Just 2 blocks from the New Orleans Convention Center and even closer to the recently repurchased defunct Entergy Power Plant, $1.1 million appeared to be a good deal for the property at that time. After a few years of not developing the property, Armbruster gave the property back to the bank. In 2009, celebrity Wendell Pierce and his childhood friend, businessman Troy Henry were able to purchase the same property for $600,000 -saving an astounding 45% of the original price- an ideal example of how commercial real estate development can provide enormous opportunity, but not without substantial risk.
The new buyers wanted to develop the site into a service station with the ability to sell gas to the abundant truck traffic on Tchoupitoulas. With Second Line Stages housing hundreds of production trucks, and the surrounding wharfs frequently trafficking transportation containers on 18-wheelers, it was an ideal location for a gas station. Prior to development here, the closest gas station was inconveniently located on the opposing side of Lee Circle, out of the way of the nearest entrance to Route 90 and the interstate. Seems like a no-brainer; the only reason nobody ever thought of it was that at the time speculators were too busy planning the redevelopment of the power plant that would accommodate major tenants like Bass Pro Shops. Unfortunately for the development duo, the land is zoned “mixed use”, a category of industrial zoning that has a stringent “conditional use” restriction that requires approval by the New Orleans City Council. In such an industrialized area, who would have guessed that a gas station wouldn’t be allowed?
Breaking it down: the three major types of industrial zoning are mixed use, light industrial and heavy industrial.
The most lenient of the three, "mixed use zoning", allows the following without conditional use restriction:
In comparison, “light industrial zoning” allows truck repair and vulcanizing shops, but allows truck stops only as a conditional use, which means it requires city approval and a site plan review.
Lastly, “heavy industrial zoning”, being the most limited of the three, allows trucks stops only as a conditional use.
Ultimately Pierce’s plans were still hindered under the given zoning for the property. Hitting road blocks under all three industrial zoning categories, one would think commercial zoning would allow something as necessary as a gas station to such a busy area. However, commercial zoning C-1A still only allows gasoline service stations as a conditional use. Ironic, considering it allows something as archaic as “tinsmithing”.
How then, should one go about pursing such an endeavor without the hindrance of additional governmental approval? Clearly, interpreting the zoning law can be extremely risky. A commercial real estate broker will represent you in researching these issues ahead of time. Most specifically, you want to look for one with advanced designations such as a CCIM, SIOR or an MBA.
After several years of planning, the property at 1667 Tchoupitoulas is currently being developed and gas will be available for purchase soon.
Follow our website and social media accounts to remain updated on this and other zoning issues!
Sources:
www.louisianacommercialrealty.com
New Orleans Zoning Code (Sections 7.6, 11.54 and 15.2.12)
New Orleans Assessor's Office
The Louisiana unemployment rate has been lower than the national rate 90 percent of the time since 2002. Most of the variance occurred during several months in 2005 due to Hurricane Katrina, but since then the Louisiana unemployment rate has been consistently below the national average.
The Louisiana labor force is at its highest in years at 535,000 workers and the number of those employed is now 499,000. The number employed is 14 percent higher than at the worst level in 2005 but is still 17 percent less than its peak of 600,000 in June 2005.
Just looking at the difference between the national unemployment rate and the Louisiana rate, called the variance, you can see that Louisiana has enjoyed more people working the last 10 years than the national average. The current unemployment rate in Louisiana is 7.0 percent, compared to the national unemployment rate of 7.9 percent.
Unemployment Rate Varies Widely Among States.The southeastern states are all red showing higher unemployment from 8 to 9.9 percent. Califormia, the 5th largest economy in the world, has unemployment exceeding 10%, along with Nevada.
Sources:
LA Commercial Realty, LLC
Bureau of Labor Statistics. ( all rates not seasonally adjusted, age 16 and over, table ID LNU04000000)
http://data.bls.gov/pdq/SurveyOutputServlet
http://www.bls.gov/web/laus/laumstrk.htm
The Bureau of Labor Statistics released the latest economic news today that the unemployment rate was 7.9 percent but that doesn't tell the whole story. How many people are working? The civilian labor force is 155.6 million, up 578,000 in October, and the participation rate is 63.8 percent. How many new jobs were added in October? Total employment for October 2012 rose by 410,000 and nonfarm employment rose in October by 171,000. How many people are not working? There were 12.3 million people unemployed in October 2012.
We still have 8.3 million workers employed part-time because their hours were cut back or they were unable to find work, down 269,000 in October. What you don't see is that we have 2.4 million people "marginally attached" to the work force, about the same as last year. These individuals are not in the labor force but had looked for a job sometime in the last 12 months and are wanting to work and are available for work. They are NOT counted. If they were counted, the 2.4 million would be added to the 12.4 million reported unemployed for a total of 14.8 million and an unemployment rate would be 9.5 percent. The number of long-term unemployed, jobless for over 27 weeks, was 5 million, around 40 percent of total unemployed.
The bottom line is that with large numbers of people not working, the economy has no driving forces to grow rapidly. Which is why we are witnessing slow GDP growth, 30 year treasury rates at 2.92% ans 2 year treasury notes at .28 percent.
But that's not all you need to know. The unemployment rate is not the same for all groups. For teenagers, the unemployment rate is 23.7 percent, for blacks 14.3 percent, for Hispanics 10 percent, Asians 4.9 percent, whites 7 percent, adult men 7.3 percent and adult women 7.2 percent.
Where Is The Job Growth?
Professional and business services added 51,000 job in October, health care added 31,000 jobs, retail 36,000 jobs, leisure and hospitality added 28,000 jobs.
This news release presents statistics from two major surveys, the Current Population Survey and the Current Employment Statistics survey. The household survey provides information on the labor force, employment, and unemployment that is a sample survey of about 60,000 eligible households conducted by the U.S. Census Bureau for the U.S. Bureau of Labor Statistics.
The establishment survey provides information on employment, hours, and earnings of employees on nonfarm payrolls; the data is collected each month from the payroll records of a sample of nonagricultural business establishments. Each month the CES program surveys about 141,000 businesses and government agencies, representing approximately 486,000 individual worksites, in order to provide detailed industry data on employment, hours, and earnings of workers on nonfarm payrolls. The active sample includes approximately one-third of all nonfarm payroll employees.
For both surveys, the data for a given month relate to a particular week or pay period. In the household survey, the reference period is generally the calendar week that contains the 12th day of the month. In the establishment survey, the reference period is the pay period including the 12th, which may or may not correspond directly to the calendar week.
Sources:
www.louisianacommercialrealty.com
http://www.bls.gov/news.release
www.bloomberg.com
You already should know that 3rd quarter GDP increased 2% compared to 2nd quarter's 1.3%, but what you really need to know is why and what is driving the economy. It is really the federal government-just in time for the election.
The acceleration in real Gross Domestic Product in the third quarter primarily reflected the following:
The real drivers are government and defense spending:
Just to be clear, today's release is the first of three estimates of GDP and compares the 3rd quarter 2012 to the 2nd quarter 2012. For the next 3 months, an updated release will bring new figures subject to change since the standard deviation over the last 20 years from first to last revision has been 1.0 percent. This means the estimate of a 2 percent GDP growth, if held up for the entire yea,r could be as much as 50 percent off if there is a 1 percent standard deviation.
These numbers are for "real" GDP which is different from current dollar GDP, and they are seasonally adjusted and expressed in percent. Quantities, or “real” measures, and prices are expressed as index numbers with the reference year -- at present, the year 2005 -- equal to 100. Current-dollar GDP is a measure of the market value of goods, services, and structures produced in the economy in a particular period. Current-dollar GDP -- the market value of the nation's output of goods and services -- increased 5.0 percent, or $190.1 billion, in the third quarter to a level of $15,775.7 billion. In the second quarter, current-dollar GDP increased 2.8 percent, or $107.3 billion.
Of the 2 percent change in 3rd quarter GDP, .72 percent came from Federal spending, which means Federal spending accounted for 36 percent of the growth. Federal spending incurred a tremendous turnaround since in the 2nd quarter it amounted to negative .02 percent of GDP growth, in the 1st quarter amounted to negative .34 percent of GDP, in the 4th quarter 2011 qmounted to negative .34 percent of GDP and in the 3rd quarter 2011 amounted to negative .36 of GDP.
copyright, 2012, www.louisianacommercialrealty.com
Sources:
US Department of Commerce
Bureau of Economic Analysis
http://www.bea.gov/iTable/iTable.cfm?ReqID=9&step=1
The highest price in New Orleans commercial real estate history was paid last week for vacant land on Tulane Avenue, evidencing growth that has surprised everyone. This article chronicles why property values have increased so dramatically and how to spur growth in a city known for checkerboard development.
The 35,000 square foot site at Tulane and Galvez, near the Dixie Brewery, was the second largest tract of land on Tulane Avenue for sale and was on the market 639 days but sold last week for $43 per square foot at the list price of $1,500,000. It only has 66 feet fronting Tulane but is a corner lot and will be a credit union office.
TULANE AND GALVEZ LAND SALE
Selling for list price makes this property unique because rarely do buyers pay list price for commercial real estate, unless the buyer really wants the property and the seller is in no hurry to sell. But there is a larger story unfolding. The price for this property is actually a result of an overall resurgence in commercial real estate in selected areas of New Orleans, because the growth is not a general trend encompassing the entire city, but a checkerboard of growth in areas where the is a concentration of population and disposable income, facilitated by city council member cooperation and tax incentives from the state and federal government.
The growth really started with the devastation of Hurricane Katrina in 2005. Without property being destroyed, owners would never have considered selling since much of New Orleans property is inherited in a city that is almost 300 years old. The change is a classic example of real estate being put to the "highest and best use". For decades before Katrina, Tulane Avenue was a seedy little area with cheap hotels, bail bondsmen and greasy diners. Properties took on three to six feet of flooding during Katrina, and some buildings were leveled because they were no longer useful. Developers were able to acquire large blocks of land at prices that made projects feasible.
The first large sale on Tulane Avenue was the old Crystal Preserves hot sauce plant at 4235 Tulane Avenue, a 136,000 square foot industrial property that sold for $1,850,000, or $13 per square foot in September 2006. The satellite photograph below shows the plant was in bad shape and the interior was destroyed by three feet of flood water. In the upper right hand corner you can see the new development, called the Preserve, a 183 unit apartment built with $1.5 million in Low Income Tax Credits and $15,950,000 in Community Block Grant Funds. The demolition bid was $450,000, and the property had to be rezoned but had the support of city council member Stacey Head. District Council B has seen more growth than any other district due to city council support, which is why development in New Orleans looks like a checkerboard. City council members in District E in New Orleans East have outwardly rejected apartment development and what they call "medium box stores" for the last 5 years, and developers notice this and take their business elsewhere. Without new apartments to increase the population, retailers will not see an area as feasible. It's all about "rooftops".
The second large sale on Tulane Avenue was a 3 acre Saab dealership at 3120 Tulane owned by Volkswagen and sold on May 2007 for $1,500,000:. The original buyer was unable to get financing so Volkswagen gave the current owners 24 hours to come up with $100,000 deposit and pay the same price. They did and the sale was the last cheap price for property on Tulane at $11 per square foot. Low Income Tax Credits for $1.9 million were awarded to the project by a state agency, and financing was provided by the Industrial Development Revenue Board and $19.6 million in Community Block Grant Funds. The 228 unit apartment complex, called the Crescent Club and shown before and after in the photograph below, is now 100% rented, with 2 bedroom units bringing $1,200 per month, and the only stipulation that 40% be rented to individuals below the average income in the area and the other 60% can be rented at a "market rate".
The third development in the area was the last 6 acre site in the city, an abandoned industrial site purchased in July 2007 for $5 million or $20 per square foot.
The site needed rezoning and was developed into the Marquis Apartments, a 435 unit apartment complex at South Broad near the Tulane Courthouse, financed with $2 million in Low Income Tax Credits and $27 million in Community Block Grant Funds.
The fourth largest development was a retail development to provide services to Tulane's new apartment residents, and six residential lots were assembled in September 2008 in the 3100 block of Tulane at a cost of $1.3 million for 34,000 square feet of land, or $39 per square foot. The retail center required rezoning from residential to commercial and is now fully leased with rents over $20 per square foot including well known tenants such as Capital One Bank and Subway.
Sources: New Orleans Assessor's Office, Louisiana Commercial Realty. Robert Hand represented several buyers of the above properties and provided proprietary photographs and data.
Copyright 2012. www.louisianacommercialrealty.com.
Just out today: the economy is still growing, although at a slower pace. The Gross Domestic Product for the 2nd quarter of 2012 increased at 1.3%, compared to the previous quarter which grew at 2.0%. It's like driving down the interstate at 60 miles per hour and you enter construction zone and slow down to 35 miles per hour; you are still moving forward but at a slower speed. You have less momentum.
The chart below shows how GDP has changed since 2010, measuring growth for each three month period against the growth for the previous three month period. The news release today is the third estimate of GDP growth for the 2nd quarter GDP. The 2nd estimate of 2nd quarter GDP was a growth rate of 1.7%, meaning that the estimates were for a stronger economy but recent data is not proving that to be accurate. The first estimate of 2nd quarter GDP was a growth rate of 1.5%.
The economy is still growing but is losing momentum. The result is a whole host of actions on the part of businesses to adapt, which includes: hiring less, carrying less inventory, increasing accounts payable and expecting reduced accounts receivables. The result of less inventory carried by retailers causes less manufacturing which results in less labor utilized and less investment, which results in higher unemployment which brings reduced taxes to local government which leads to roads not being fixed, few raises for police and fire protection and reductions in university budgets. Businesses will reduce employees rapidly in expectation of a slowdown in order to reduce payroll costs so they can get their expenses in line with expected reduced revenues, but government will attempt to increase taxes and property assessments while maintaining their employment count because government has no profit incentive to ration their resources efficiently.
Positive contributions to GDP came from investment and exports, and negative contributions came from lower government spending, both state and local. Imports increased but since they are a deduction from GDP, were a negative factor. GDP is defined as the market value of goods and services produced by labor and property in the United States, regardless of nationality; GDP replaced gross national product (GNP) as the primary measure of U.S. production in 1991. The formula is:
GDP=Consumption + Investment + Government Spending - Imports
The next release on October 26th will be the first estimate of 3rd quarter GDP.
Sources:
http://www.bea.gov/index.htm
The household median value of rental real estate is $170,000 but the value in stocks is only $18,300, according to the US Census Bureau, which explains why the economy could experience an extended period of slow growth not seen by anyone living today. The reason having so much in real estate will have such an impact on us is due to an economic term called "The Wealth Effect", which states consumers will spend more money if they perceive they are wealthier but also will reduce and postpone spending when they perceive they are less wealthy.
We are currently experiencing a period where there is a perceived loss of wealth since the median value of household assets fell 35% from 2005 to 2010, according to a study compiled by Alfred Gottschalck at the US Census Bureau's Study of Income and Program Participation. The numbers are worse for those age 35-44 where household asset values fell by 58%. This decline in household wealth by such a large percentage may result in wealth failing to regain its peak value in our lifetime, because a 58% drop in value of an asset that grows at 2% takes 27 years just to get back to its original value, and growth at 3% takes 18 years to recoup. Growth rates of 2% to 3% are difficult to find today, since Certificates of Deposits are around 1%, GDP annual growth is 1.9% and you have to tie up your money for 30 years to earn 2.50% in US Treasury bonds. This new paradigm will take some getting used to because we are just not used to extended periods of slow growth. "The Wealth Effect" makes everything different this time by reducing consumption which reduces economic growth, and two-thirds of our economy is driven by consumption. The chart below shows that since 1901, unless we were in a recession, the US economy has never experienced more than a two years growth less than 2%. That is, we have either been growing our economy more than 2% annually or suffering a recession caused by excessive growth.
This new normal explains why 30 year bond yields are at 2.50% and the latest #GDP growth was 1.9% annually. The new trend will catch most people by surprise because we naturally expect a regression to the mean and anchor our expectations on a V shaped economic rebound since low interest rates have always spurred the economy on. Not this time, and it will take some time to wring out the excesses. It took Japan ten years to come out of a financial/banking collapse because they propped up their banking system and did not let free markets allocate assets and risk properly, and our government is repeating their mistake. A slow economy for the next 5 to 10 years means investments in consumer staples could excel but there is little room for pricing power and inelasticity. Commercial real estate could be a big winner, since current cash flows are higher than any other investment and in a slow growing economy, cash flow is king. The good news is that 10 years from now, maybe even Obama will understand how businesses are good for the US because businesses have an incentive to adapt and evolve. The free market system and competition always brings us out of our doldrums with a resurgence in creativity and technology, because business has an invisible hand guiding it to seek new ways to deliver better products at lower costs to consumers.
Sources:
http://blogs.census.gov/2012/06/18/changes-in-household-net-worth-from-2005-to-2010/http://www.census.gov/hhes/www/wealth/detailed_tables.htmlAlfred Gottschalck , US Census Bureau, 301-763-5883
copyright 2012. Louisiana Commercial Realty, LLC.New Orleans commercial real estate.
Spending on tourism grew faster than the economy in the first quarter 2012 with an annual growth rate of 3.4%, compared to #GDP growth at 1.9%. Those areas dependent on tourism should continue to see better than average growth. New Orleans is a good example of how cities have capitalized on tourism spending, shifting the driver of their economy away from oil to tourism. The change originated in the early 1980's with the building of the required infrastructure: one of the largest convention centers in the US. New Orleans commercial real esate benefitted from the movement to heavily market the city as a destination tourist attraction for business meetings followed by fine dining and fun. Hotels have adapted to the movement and now offer large ballrooms for meeting space, capitalizing on the trend away from national meetings toward regional gatherings.
Tourism spending is shown by the blue column and gross domestic product (GDP) is the red column. The last blue column showing the rate of tourism spending depicts a decline for the 1st quarter 2012 from the 4th quarter 2011, but the growth rate is still higher than GDP, shown in the red column.
Real spending on travel and tourism increased at an annual rate of 3.4 percent in the first quarter of 2012 after increasing 4.4 percent (revised) in the fourth quarter of 2011. By comparison, growth in real gross domestic product (GDP) increased 1.9 percent (second estimate) in the first quarter after increasing 3.0 percent in the fourth quarter. The increase in real spending on tourism primarily reflected increases in traveler accommodations and in food services and drinking places.
In the first quarter of 2012, total current-dollar tourism-related spending was $1.4 trillion and consisted of $848.6 billion (59 percent) of direct tourism spending — goods and services sold directly to visitors — and $577.9 billion (41 percent) of indirect tourism-related spending — goods and services used to produce what visitors buy.
Total Tourism-Related Employment was 7.6 million in the first quarter of 2012 and consisted of 5.4 million (71 percent) direct tourism jobs — jobs where workers produce goods and services sold directly to visitors — and 2.2 million (29 percent) indirect tourism-related jobs — jobs where workers produce goods and services used to produce what visitors buy.
Source: US Bureau of Economic Analysis
Over the last three months, New Orleans' commercial real estate has experienced an 8% increase in the supply of industrial square footage for sale, an 8% increase in shopping centers and a 17% increase in land, but a 5% decline in retail properties.
This additional supply in square footage of industrial and land is confirmed in the table below by the percent change in the number of listings, but not in the shopping center sector where the square footage increased 8.33% and the number of listings fell 8.64%. The explanation is that small size properties were leased or sold and large size properties were added.
| Industrial | Office | Retail | Shopping Center | Land | Farm | Hospitality | Multi-Family | |
| Percent change in number of listings, march to June 2012 | 13.83% | 2.60% | 3.35% | -8.64% | 6.96% | 0.00% | 23.08% | 30.56% |
| Number listings, March 2012 | 311 | 924 | 508 | 162 | 388 | 1 | 13 | 36 |
| Number listings, June 2012 | 354 | 948 | 525 | 148 | 415 | 1 | 16 | 47 |
The big surprise to most commercial property sellers is the number of days a property sits in the marketing phase, as shown in the table below. Multi-family takes the longest, at almost two years to transact, since it is an investment sale that requires more complex cash flow analysis and is usually a higher value transaction.
| Industrial | Office | Retail | Land | Hospitality | Multi-Family | |
| Days On Market, June 2012 | 344 | 260 | 332 | 296 | 267 | 635 |
In the industrial sector, the days on the market (shown in the chart in black) has averaged 344 days over the last 12 months, as of June 2012. The lease rate (shown below in the blue line) has experienced less variation, averaging $4.45 per square foot.
Somebody must have leaked to Obama today's release of manufacturing profits showing a 9.45% increase in after-tax profits, from 134 billion in the 4th quarter of 2011 to 146 billion in the 1st quarter 2012, which caused him to claim the private sector is OK. Drill down to the specific industries and you will see that the private sector is not OK.
It's true that after-tax profits were higher than in any 1st quarter period since 2008, as shown in the blue column in the chart below.
However, not all industries are doing well. In fact there is a wide dispersion, with the following distinctions:
These numbers are just for the last three months, from the 4th quarter 2011 to the 1st quarter 2012.
The good news is that some industries did very well, increasing after-tax profits by:
Source: http://www.census.gov/econ/qfr/
Quarterly Financial Report (QFR)
Manufacturing, Mining, Trade, and Selected Service Industries
The Bureau of Economic Analysis released GDP growth by state today, showing Louisiana ranking in the bottom 40% and Mississippi in the bottom 20%, among all 50 states. Broken into quintiles, or 5 groups with 20% each, Louisiana ranked in the 2nd quintile and Mississippi in the lowest quintile. The map below shows GDP growth by state with the highest growth shown in the dark blue states and the slowest growth shown in the orange states. GDP increased in 43 states and overall US GDP grew in 2011 by 1.5% compared to 2010 which grew by 3.1% over 2009.
Broken down into regions, GDP growth was highest in the Southwest region with 2011 GDP growth of 2.7%, led by Texas with a 3.3% GDP growth in 2011 over 2010.
In our Southeast region, the highest 2011 GDP growth was in West Virginia with 4.5% growth, followed by Tennessee, North Carolina and Georgia.
Louisiana experienced the fastest GDP growth in 2010 at 9.4% compared to US growth of 3.1%. In 2011, Louisiana ranked 36 and experienced growth of .5%, compared to the US GDP growth of 1.5%.
Contributions to Louisiana GDP growth came mostly from mining and finance sectors, with government and non-durable goods manufacturing experiencing the highest decline.
copyright 2012. Louisiana Commercial Realty. LLC.New Orleans' Commercial Real Estate.
Just out today is the actual number for GDP growth for the 1st quarter of 2012, showing a slowing of growth to an annual rate of 1.9% from the 4th quarter 2011 of 3.0%, a 36% drop in activity.
The 1st quarter advance estimate was 2.2% GDP growth but with more information now available, we have a second estimate of 1.9%. These are annual growth rates in percent change from the preceding quarter.
A slowing economy reduced prices, especially for commercial real estate, because it reduces demand, but in the long run the lower demand results in lower interest rates which eventually will increase the return on investment and spur growth.
Top employers in New Orleans.
| Company | Type of Business | Employment |
| Ochsner Health System | Health Care | 9,107 |
| St. Tammany Parish Public School Board | Elementary & Secondary Schools | 7,651 |
| Jefferson Parish School Board | Elementary & Secondary Schools | 7,000 |
| Northrop Grumman | Ship Building & Repairing | 5,400 |
| LSU Health Sciences Center New Orleans | Colleges & Universities | 5,000 |
| Tulane University | Colleges & Universities | 4,410 |
| Jefferson Parish Government | Government | 3,671 |
| City of New Orleans | Government | 3,500 |
| East Jefferson Hospital | Health Care | 3,150 |
| United States Postal Service | Government | 2,887 |
| Lockheed Martin Corp/Nasa Michoud | Space Research and Technology | 2,832 |
| Harrah's New Orleans Casino | Casinos | 2,200 |
| Capital One | Commercial Banking | 2,150 |
| Al Copeland Investments | Restaurants & Food Manufacturing | 2,000 |
| Dow Chemical Company | Chemical Manufacturing | 2,000 |
| North Oaks Medical Center | Health Care | 1,835 |
| Touro Infirmary | Health Care | 1,835 |
| Naval Support Activity | Government | 1,800 |
| Jefferson Parish Sheriff's Office | Government | 1,655 |
| West Jefferson Medical Center | Health Care | 1,654 |
| Southeastern Louisiana University | Colleges & Universities | 1,601 |
| Saint Tammany Parish Hospital | General Medical & Surgical Hospitals | 1,519 |
| Boh Bros. Construction Co. | General Contractor | 1,500 |
| Children's Hospital | Health Care | 1,417 |
| Hilton-New Orleans Riverside | Hotels & Motels | 1,400 |
| Whitney Holding Corp. | Commercial Banking | 1,399 |
| Tulane Medical Center | Health Care | 1,343 |
| New Orleans Sewerage and Water Board | Government | 1,300 |
| US Army Corps of Engineers | Government | 1,300 |
| USDA, National Finance Center | Government | 1,300 |
| St. Tammany Parish Hospital | Health Care | 1,266 |
| Universal Sodexho (USA) Inc. | Catering | 1,233 |
| New Orleans Recovery School District | Elementary & Secondary Schools | 1,180 |
| Textron Marine & Land Systems | Manufacturing | 1,165 |
| University of New Orleans | Colleges & Universities | 1,150 |
| Boomtown Casino | Casinos | 1,100 |
| Laitram LLC | Manufacturing | 1,050 |
| Bollinger Gulf Repair | Ship Building & Repairing | 1,000 |
| Entergy Corp. | Electric Power Distribution | 1,000 |
| Loyola University | Colleges & Universities | 1,000 |
| Sanderson Farms | Food manufacturing | 1,000 |
| Shell Exploration & Production | Oil and gas exploration | 1,000 |
| Times-Picayune | Newspaper Publishers | 1,000 |
| Xavier University of Louisiana | Colleges & Universities | 1,000 |
| Source: CityBusiness Book of Lists 2007-08, Info USA Business List, D&B Selectory Business List, Parish Economic Development Websites, & Area Newspapers. | ||
Today, one of the best measurements of the strength of the economy-the Leading Economic Index-showed a decline in April of 0.1 percent, in contrast to March's 0.3 percent increase and also February's 0.7 percent increase. A declining Leading Economic Index has predicted 7 of the last 8 recessions, but this does provide a signal of possible slowdown which could lead to falling commercial real estate prices; however, that could be followed by lower interest rates due to a lower demand to borrow money, since interest rates are nothing more that the intersection of the demand and supply for money.
Today's news release and analysis of the leading indicators is prepared by the Conference Board, which is not a government agency, but a 501 (c)(3) non-profit association of business members. The index is based on a scale where the year 2004 is 100. Today's number is 95.5.
The Leading Economic Index is composed of the following individual indicators:
To confirm a change in the direction of the economy, we also look at the Coincident Economic Index.
There are four economic statistics comprising the Coincident Economic Index:
In summary, watch the next few months of data and should we see further weakness, prepare for lower commercial real estate prices, a slowing economy around the time of the presidential elections causing havoc for incumbents, but also lower interest rates.
Source: http://www.conference-board.org/data/bcicountry.cfm?cid=1
If you want to know how healthy the economy is, just watch the consumer. The US economy is one-third manufacturing driven and two-thirds consumer driven, and consumer spending depends on personal income. When the consumer spends, businesses grow, causing them to lease additional space and open new locations, causing demand for new warehouses for distribution and manufacturing and benefiting many sectors of commercial real estate.
Just out today is personal income for March 2012, which rose 0.4 percent, showing a tepid but healthy consumer.
Personal income increased $50.3 billion, or 0.4 percent in March. In February, personal income increased $39.6 billion, or 0.3 percent, based on revised estimates which are often changed by billions of dollars. The January personal income estimate was 26.5 billion and revised to 36.8 billion, a change of 10.3 billion but only increasing the percent change from 0.2 percent to 0.3 percent.
|
Revisions In Personal Income |
||||
| January 2012 Previous | January Revised | February 2012 Previous | February Revised | |
| Percent | 0.2 | 0.3 | 0.2 | 0.3 |
| Dollars | 26.5 | 36.8 | 28.2 | 39.6 |
Source: Bureau of Economic Analysis
This economy is like your car on the highway when you approach a school zone: you are still moving forward but with less momentum. Just out is #GDP for the 1st quarter 2012 which grew at 2.2%, meaning we are still out of the severe recession of 2008, but growth is slowing compared to the 4th quarter GDP growth of 3%.
For commercial real estate, this leads to these six consequences:
The real culprit in the news is called real nonresidential fixed investment which decreased 2.1 percent in the first quarter, in contrast to an increase of 5.2 percent in the fourth quarter 2011-specifically the following:
|
Sources: US Bureau of Economic Analysis
Dr. Tichenor died at age 85 but his company is alive and well, delivering toothpaste, mouthwash and catchy slogans such as:
In January 2012, the company got $1.1 million from the Solomon Group for their building at 819 Girod, where they first got started selling half a billion bottles of mouthwash.
Dr. Tichenor was wounded in battle in 1863 and against doctor's advice to amputate his leg, he left the hospital and developed his antiseptic formula.
You can still buy T-shirts and caps at their website http://www.drtichenor.com/
The last remaining vestige of Heisman Trophy winner Reggie Bush, his penthouse condo at One River Place, was sold for $1.975 million on February 8, 2012, down 16% from his $2.3 million dollar asking price. Reggie came to the Saints in 2006 and rushed for 565 yards, his best year because he also had 742 receiving yards, but he was traded in 2011 to the Miami Dolphins where he rushed for 1,086 yards.
You might remember that the River Place condos were the victims in 1996 of the 700 foot tanker, Bright Field, crashing into the Riverwalk Shopping Center and the lower parking area of the River Place condos, spewing Mercedes Benz's and BMW's onto the edge of the Mississippi River.
Reggie's sale price of 16% of list actually is not too bad in this environment. A survey of commercial properties sold the last 5 years showed a sale price at 15% less than the list price, except for land which averaged a sale price at 47% off the list price. Valuation of land vary with the future use of the property, and the time required to sell land averages 2 years. A 15% discount on sale of commercial property shows the list price is fairly accurate, which is tribute to the research commercial agents perform when they market properties.
17 years is a long time to reap a 259% return, but that's how New Orleans commercial real estate works. Back in 1995 when the Resolution Trust was liquidating Landmark Land assets, the 1.248 acres at 1709 Poydras Street, opposite the Mercedes Benz Superdome, was purchased for $1.35 million by the team of Bob Merrick, owner of Latter & Blum, and Rathborne Properties, developer of Elmwood Business Park. Last month, the property was sold to Zelia CNP, operated by Tom Benson, owner of the New Orleans Saints Football team and the New Orleans Hornets Basketball team, for $3.5 million, or $64/sf. That works out to a 5.6% annual return. Just to compare, in 1995 the stock market was 5,000, Bill Clinton was president, gas was $1/gallon, gold was $380/oz, interest rates were 8.5% and OJ was innocent.
Look for a new development in the space rather than the existing parking lot, which could bring more commerce to a challenging part of Poydras Street but increase property values. The property next door is about twice as big and owned by Entergy and assessed for tax purposes at exactly the same value per square foot for the land as the price Benson paid.
It's not timely, but today's release by the Bureau of Economic Analysis on personal income growth does show the fastest growing counties in Louisiana: Bossier, Iberville, Catahoula, LaSalle, Natchitoches and St. Bernard, with greater than 5.1% annual growth for 2010.
The map below shows the fastest growing counties in dark blue, and the big surprise is the Mississippi Delta area with 13 counties ranked in the top category. The fastest growing county in the Southeast was Issaquena County, Mississippi at 17.4%.
The Southeast accounted for 23% of the nation's personal income growth, but the per capita income was $36,108, or 90% of the national average of $39,937. Texas still has the fastest growing personal income in the US, with declines in the Rust Belt and lower Nevada.
Source: Bureau of Economic Analysis, US Department of Commerce
Personal income is the income received by all persons from all sources. Personal income is the sum of net earnings by place of residence, rental income of persons, personal dividend income, personal interest income, and personal current transfer receipts.
There are only 3 New Orleans commercial properties priced over $2 million sold so far in 2012, with the highest sale exceeding $18 million for the old Amoco office building.
The largest commercial real estate market in New Orleans is the office category, but it is only one of 5 major types of commercial property. New Orleans MSA commercial real estate properties currently listed for sale total over one billion dollars and include at least 2,300 commercial properties, divided into these 5 basic property types:
1. Industrial-328 listings for 6.4 million sf totaling $263,000,000 in value.
2. Office-966 listings for 5 million sf totaling $434,000,000 in value.
3. Retail-Commercial-513 listings for 3.6 million sf totaling $307,000,000 in value.
4. Retail-Shopping Centers-150 listings for 1.2 million sf totaling $87,000,000 in value.
5. Vacant Land-428 listings for 182 million sf totaling $72,000,000 in value.
1. The highest price commercial property sale is the old Amoco office building at 1340 Poydras Street, sold on February 16, 2012, for $18.75 million, or $49.60/sf. The 20 story, 378,000sf, building was built in 1977.
2. Mid-City Carrollton, known as Victory Real Estate Investments, in Columbus, Georgia, sold 4.97 acres including the old Bohn Ford auto dealership on February 16, 2012, for $7.35 million to SST Carrollton WD, which is owned by Lewis Sterling and Gerald Songy. The site was under contract to Green Coast Enterprises, who planned to lease 30,000sf of space at $20/sf for grocery store Jack-n-Jake's, specializing in produce from local farmers, but Green Coast decided not to execute their option on the site so Victory sold the property for a record $35/sf for retail development. The new owners will develop the site into a 107,000sf building for anchor tenant Winn-Dixie and Office Depot, Pinkberry, Five Guys Burgers, and Jefferson Feed Pet Store.
3. At the corner of Chartres Street and St. Philip in the heart of the French Quarter, a two story building on 11,410sf land sold January 26, 2012, for $3.8 million by Riso Investments, owned by Jeff and Chris Riso, to Chartres Empire, owned by David Clement.
926 chartres Notorial Archives, LACDB Sources: Louisiana Secretary of State, New Orleans Assessor,
On Friday, US Senator David Vitter sided with developers who face astronomical costs in developing in areas regulated by the US Army Corps of Engineers who now require 2.4 acres of land to be mitigated for every acre developed, compared to previous method requiring 1.6 acres. This affects New Orleans commercial real estate development since this amounts to a 50% price increase.
Vitter spoke at a public meeting of the Mississippi River Commission (MRC) which was established by an Act of Congress on June 28, 1879. Congress charged the MRC with the mission to develop plans to improve the condition of the Mississippi River, foster navigation, promote commerce, and prevent destructive floods, and they have a public meeting twice a year to discuss strategies.
Every year, on average, the Corps of Engineers allows 20,000 acres of wetlands to be impacted by developments because they require 56,000 acres of wetlands to be restored by developers. This article explores how developers with a permit from the Corps are allowed to buy mitigation bank credits to offset the impact a development might have on wetlands.
Since New Orleans is technically under sea level, you would expect many real estate developers to be eventually confronted with wetlands on their property, which the Environmental Protection Agency defines as “an area that is regularly saturated by surface water or groundwater and is characterized by a prevalence of vegetation that is adapted for life in saturated soil conditions”. Although these areas make up a very small percentage of the total land found in the United States, Southern Louisiana contains 40 - 45% of the wetlands found in the lower 48 states. This is because Louisiana is the drainage gateway to the Gulf of Mexico for the Lower Mississippi Regional Watershed which drains more than 24 million acres in seven states from southern Illinois to the Gulf of Mexico.
Compensatory mitigation for unavoidable wetland impacts may be accomplished through three distinct mechanisms:
• Permittee-Responsible Mitigation: Restoration, establishment, enhancement or preservation of wetlands undertaken by a permittee in order to compensate for wetland impacts resulting from a specific project. The permittee performs the mitigation after the permit is issued and is ultimately responsible for implementation and success of the mitigation. Permittee-responsible mitigation may occur at the site of the permitted impacts or at an off-site location within the same watershed.
• Mitigation Banking: A wetlands mitigation bank is a wetland area that has been restored, established, enhanced or preserved, which is then set aside to compensate for future conversions of wetlands for development activities. Permittees, upon approval of regulatory agencies, can purchase credits from a mitigation bank to meet their requirements for compensatory mitigation. The value of these “credits” is determined by quantifying the wetland functions or acres restored or created. The bank sponsor is ultimately responsible for the success of the project. Mitigation banking is performed "off-site," meaning it is at a location not on or immediately adjacent to the site of impacts, but within the same watershed. Federal regulations establish a flexible preference for using credits from a mitigation bank over the other compensation mechanisms.
• In-Lieu Fee Mitigation: Mitigation that occurs when a permittee provides funds to an in-lieu-fee sponsor (a public agency or non-profit organization). Usually, the sponsor collects funds from multiple permittees in order to pool the financial resources necessary to build and maintain the mitigation site. The in-lieu fee sponsor is responsible for the success of the mitigation. Like banking, in-lieu fee mitigation is also "off-site," but unlike mitigation banking, it typically occurs after the permitted impacts.
Here’s how mitigation works in New Orleans commercial real estate development. Let’s say a private developer is building a subdivision on 900 acres of land, of which 300 acres has been declared wetlands by the U.S. Department of Army under the Corps of Engineers. Once federal and state regulatory agencies have agreed that the developer cannot avoid or even minimize the effect on those acres, the developer must compensate – hence, the word mitigation – for the wetlands’ loss by purchasing credits in a mitigation bank.
The mitigation bank is the area that has been restored-not a bank as we know it- and has four distinct components:
1. The bank site: the physical acreage restored, established, enhanced, or preserved;
2. The bank instrument: the formal agreement between the bank owners and regulators establishing liability, performance standards, management and monitoring requirements, and the terms of bank credit approval;
3. The Interagency Review Team (IRT): the interagency team that provides regulatory review, approval, and oversight of the bank; and
4. The service area: the geographic area in which permitted impacts can be compensated for at a given bank.
Before a bank can be permitted, and approved for wetland credit sales, federal and state government regulatory agencies form a Mitigation Banking Review Team (MBRT) that must approve plans for building the bank, from the hydrological and planting design to maintenance and monitoring arrangements. The MBRT also approves the number of mitigation credits that may be earned by the banker.
A developer can buy credits only if they have applied to the federal and/or state agency responsible for wetland permitting, and have provided adequate justification of a need to impact wetlands on their development. Mitigation regulations recommend that the impact and compensation be located in the same watershed and that the impact and mitigation be the same habitat, of similar ecological value or ecologically preferable.
A permit applicant may make a payment to an in-lieu fee program that will conduct wetland, stream or other aquatic resource restoration activities. In-lieu fee programs, as shown in Chart One, are generally administered by government agencies or non-profit organizations that have established an agreement with the regulatory agencies to use in-lieu fee payments collected from permit applicants.
Usually a non-profit organization acts as an intermediary to restore, enhance, create and preserve wetlands and assumes responsibility for their long-term maintenance, earning mitigation credits for their efforts. Non-profits can then sell these mitigation credits to developers who have a permit who must compensate for having impacted wetlands. The sale of wetland credits legally transfers the liability for wetland mitigation from the permittee to the wetland banker.
In 2008, the U.S. Army Corps of Engineers adopted new rules that dramatically changed its approach to mitigation under Section 404 of the Clean Water Act, which regulates fill in wetlands and other waters of the United States. The new rules adopt a mitigation hierarchy that moves away from the prior preference for onsite mitigation in favor of mitigation banks and watershed-based mitigation programs. If you wish to obtain a permit to impact wetlands, you must first minimize impacts, and then compensate for unavoidable impacts. The basis for the new rule is that despite progress over the last two decades, there are still gaps in the science of restoration ecology.
The new rule state a permittee must have mitigation plans which include the following:
| *objectives | *a mitigation work plan |
| *site selection criteria | *a maintenance plan |
| *baseline information (for impact sites) | *credit determination methodology |
| * performance standards | *a long-term management plan |
| *site conservation easements | *monitoring requirements |
| *financial assurances |
1 Federal Register, Guidance for Establishment, Use and Operation of Mitigation Banks, November 28, 1995
Just out today is the news that personal income for last month increased 0.2%, meaning that the consumer is doing well which can spur consumer spending which can create demand for commercial real estate development.
Personal income increased $28.2 billion, or 0.2 percent, and disposable personal income (DPI) increased $18.9 billion, or 0.2 percent, in February, according to the Bureau of Economic Analysis. Personal consumption expenditures (PCE) increased $86.0 billion, or 0.8 percent. In January, personal income increased $26.5 billion, or 0.2 percent, DPI increased $5.0 billion, or less than 0.1 percent, and PCE increased $40.9 billion, or 0.4 percent, based on revised estimates. While a growth in personal income for February 2012 of 0.2% may seem small, it shows the economy continues to stay out of the recession of 2008. The chart below shows personal income by quarter since 2004 and ending 2011.The last 9 quarters have witnessed positive growth.
Positive growth in personal income leads to consumer spending which drives commercial real estate development.
Real gross domestic product (GDP) -- the output of goods and services produced by labor and property located in the United States -- increased at an annual rate of 3.0 percent in the fourth quarter of 2011 (that is, from the third quarter to the fourth quarter), according to the "third" estimate released today by the Bureau of Economic Analysis. In the third quarter, real GDP increased 1.8 percent. The chart below of GDP shows the rapid falloff we experienced in 2008 and 2009 where GDP fell by 8.9%, then we experienced the strongest quarter comeback in the 1st quarter of 2010 with 3.9% growth. This national economic growth is one reason New Orleans commercial real estate picked up in 2011.
4th quarter 2011r means the number was revised. The news out today is for the "third" estimate as seen in the table below. The "third" estimate of the fourth-quarter percent change in real GDP is the same as the "second" estimate issued last month, primarily reflecting a downward revision to exports that was offset by an upward revision to nonresidential fixed investment.
|
Advance Estimate |
Second Estimate |
Third Estimate |
|
| Real GDP |
2.8 |
3.0 |
3.0 |
With good growth in the economy, we should have expanding corporate profits which fuel expansion and new commercial real estate development. It is a domino effect of new industrial facilities needed to meet new demand and new offices needed to house new employees at new locations. As shown in the chart below, coming out of the recession of 2008, corporate profits grew 32% in 2010 over 2009; however, profits grew more slowly in 2011 at 7.9%.
Corporate profits, when measured by quarter in 2011, illustrate a slowing in growth in the 4th quarter from 1.7% to 0.90%, as seen in the table below. This slowdown might put commercial real estate projects on hold until the 1st quarter of 2012 shows us a stronger economy.
| 2011.1 | 2011.2 | 2011.3 | 2011.4 | |
| Corporate profit growth | 1.00% | 3.30% | 1.70% | 0.90% |
| (With inventory valuation and capital consumption adjustments) | ||||
The Bureau of Economic Analysis reported today that Louisiana had growth in personal income of 4.83%, comparing 2011 to 2010, which ranks 34th among all states. The highest growth was North Dakota at 8.13% and the lowest growth was Maine at 3.35%. The reason we examine personal income is because it is a driver of growth for the economy and influences commercial real estate demand. Personal income growth drives commercial real estate demand because it increases consumer discretionary spending which causes retail development which leads to housing development which causes office and industrial development. New Orleans East is a good example of low personal income growth preventing commercial development. It never developed commercially because there were never enough rooftops and discretionary spending; in fact, Lake Forest Shopping Center was losing tenants long before Hurricane Katrina.
In order to get commercial real estate development in areas where there is low personal income growth, you need more population or rooftops. For example both Walgeens and CVS require 20,000 people in their trade area. It also helps to have a City Council Representative that is pro-business.
Personal income is the sum of net earnings by place of residence, property income, and personal current transfer receipts. Property income is rental income of persons, personal dividend income, and personal interest income. Net earnings is earnings by place of work (the sum of wage and salary disbursements, supplements to wages and salaries, and proprietors’ income) less contributions for government social insurance, plus an adjustment to convert earnings by place of work to a place-of-residence basis. Personal income is measured before the deduction of personal income taxes and other personal taxes and is reported in current dollars (no adjustment is made for price changes).
SA1-3 Personal income summary-sorted by 2010-2011 % Change |
||
| Personal income (percent change from preceding period) | ||
| Bureau of Economic Analysis | ||
Area |
2009-2010 |
2010-2011 |
| North Dakota | 9.36 | 8.13 |
| Iowa | 3.1 | 6.81 |
| Texas | 5.3 | 6.64 |
| Oklahoma | 5.28 | 6.21 |
| South Dakota | 4.4 | 6.2 |
| Nebraska | 3.24 | 5.9 |
| Wyoming | 4.06 | 5.88 |
| Colorado | 3.75 | 5.67 |
| California | 3.99 | 5.62 |
| District of Columbia | 5.66 | 5.62 |
| Utah | 3.82 | 5.48 |
| Idaho | 4.01 | 5.4 |
| Tennessee | 4.24 | 5.37 |
| Washington | 2.95 | 5.35 |
| Oregon | 3.2 | 5.3 |
| Michigan | 3.25 | 5.23 |
| Illinois | 2.79 | 5.22 |
| Wisconsin | 3.8 | 5.21 |
| Montana | 4.67 | 5.1 |
| United States | 3.67 | 5.08 |
| Minnesota | 4.45 | 5.05 |
| Connecticut | 2.71 | 5.04 |
| Indiana | 2.47 | 5.04 |
| Massachusetts | 3.64 | 5.03 |
| Georgia | 3.03 | 5.01 |
| Arizona | 2.85 | 4.99 |
| New Hampshire | 2.79 | 4.89 |
| Maryland | 3.96 | 4.88 |
Louisiana |
3.61 |
4.83 |
| Pennsylvania | 3.34 | 4.82 |
| Florida | 3.23 | 4.74 |
| Kentucky | 1.98 | 4.71 |
| Delaware | 3.79 | 4.68 |
| South Carolina | 3.61 | 4.67 |
| Virginia | 3.75 | 4.67 |
| West Virginia | 3.27 | 4.65 |
| Rhode Island | 3.34 | 4.63 |
| Ohio | 2.96 | 4.57 |
| New Mexico | 4.41 | 4.52 |
| Hawaii | 3.67 | 4.49 |
| New York | 4.26 | 4.39 |
| North Carolina | 3.72 | 4.34 |
| Vermont | 3.41 | 4.32 |
| Kansas | 2.71 | 4.3 |
| Arkansas | 3.2 | 4.27 |
| New Jersey | 3.73 | 4.25 |
| Missouri | 2.51 | 4.2 |
| Alaska | 4.48 | 4.17 |
| Nevada | 1.85 | 4.07 |
| Mississippi | 3.81 | 3.85 |
| Alabama | 3.17 | 3.79 |
| Maine | 1.69 | 3.35 |
| Legend / Footnotes: | ||
| All dollar estimates are in current dollars (not adjusted for inflation). | ||
| Last updated: March 28, 2012 - new estimates for 2011; revised estimates for 2008-2010. | ||
Most industrial property owners are shocked to discover the average time it takes to find a buyer or tenant in New Orleans is 368 days, and that is with an average asking price of $37.91 per square foot and lease price of $4.48 per square foot. But there is good news in that, for this month, supply is down. There are 88 properties for sale totaling 2.2 million square feet, which is down about 20% from the average, and 223 industrial properties for lease totaling 3.8 million square feet, down about 14% from the average. The average sale price occured 27% below the list price. The chart below shows the number of days on the market and the lease rate for industrial propeties in the New Orleans MSA, which includes Metairie and Kenner. You can see there is little direct correlation over the last 12 months, which means when lease rates are reduced, it does not cause a shorter number of days on the market, or cause a property to sell or lease faster. In economics, this is called "elasticity".
source: LACDB, market statistics, industrial, new orleans MSA
In 2013 the long term capital gains rate is expected to increase by 58%, so get with your accountant and strategize. While taxes should never be the sole decision to acquire or dispose of commercial real estate - that decision should rely on the economic feasibility of the development - the long term capital gains tax for 2012 is only 15%, and with a government struggling to pay for a recession and wars, capital gains tax rates could go much higher over the next few years.
The 2012 capital gains rate is one of the lowest on record and has been in effect since 2003. You have to go back to 1934 to witness a previous era where capital gains tax rates were 15% or less. As shown below in the "Table of Historical Capital Gains Tax Rates Since 1913", rates have usually been much higher - such as in the late 1980’s when long term capital gains rates were 33% due to the Tax Reform Act of 1986. In 2013 the long term capital gains rate is expected to increase to 20%, plus a 3.8% Medicare Tax, plus Obama’s “Buffet Rule” may increase rates to 30% for millionaires. That increase from 15% to 23.8% is a percentage increase of 58%, so it commands a thoughtful plan.
If you expect your commercial property’s market value will not increase much over the next five years, it might make sense to sell now and pay the 15% capital gains tax rate, rather than sell for the same price in a few years and pay a higher tax rate. In finance terms, the opportunities you would miss by not having that money to reinvest in other projects over that five year period are called "opportunity costs", and smart commercial property owners take into account the future value of any asset that might sit idle for several years. Here's how it works: if you miss earning 5% on an asset valued at $1,000,000 today, you have lost $283,358 over 5 years, because the future value of an asset worth $1,000,000 today will be worth $1,283,358 in 5 years.
Click on the pdf below for a helpful summary from Putnam Company of most of the tax information you need to know: capital gains rates, individual and corporate income rates, retirement plan contribution limits, estate tax rates, social security amount taxed, and FICA tax limits. As always, see your accountant for tax advice.
TABLE OF HISTORICAL CAPITAL GAINS TAX RATES SINCE 1913
Year |
Capital Gains Rate |
1913-15 |
15% |
1916 |
15% |
1917 |
67% |
1918 |
77% |
1919-21 |
73% |
1922 |
12.5% |
1923 |
12.5% |
1924 |
12.5% |
1925-28 |
12.5% |
1929 |
12.5% |
1930-31 |
12.5% |
1932-33 |
12.5% |
1934-35 |
31.5% |
1936-37 |
39% |
1938-40 |
30% |
1941 |
30% |
1942-43 |
25% |
1944-45 |
25% |
1946-47 |
25% |
1948-49 |
25% |
1950 |
25% |
51-64 |
25% |
64-67 |
25% |
1968 |
26.9% |
1969 |
27.5% |
1970 |
32.3% |
1971 |
34.3% |
1972-75 |
36.5% |
1976-77 |
39.9% |
1978 |
39% |
1979-80 |
28% |
1981 |
23.7% |
1982 |
20% |
1983 |
20% |
1984-86 |
20% |
1987 |
28% |
1988-90 |
33% |
1991-92 |
28.9% |
1993-96 |
29.2% |
1997-2000 |
21.2% |
2001 |
21.2% |
2002 |
21.2% |
2003-05 |
16.1% |
2006-07 |
15.7% |
2008-09 |
15.4% |
2010-12 |
15% |
2013-on |
25% |
| Sources: www.taxfoundation.org, www.visualizingeconomics.com,www.seekingalpha.com,www.forbes.com, www.CTJ.org | |
copyright 2012. Louisiana Commercial Realty, LLC.
New Orleans commercial real estate.