![]() Louisiana Commercial Realty announced today that the company had brokered 22,000 square feet at 210 Industrial Avenue for one of the highest prices recorded in Jefferson Parish for industrial land.
Louisiana Commercial Realty announced today that the company had brokered 22,000 square feet at 210 Industrial Avenue for one of the highest prices recorded in Jefferson Parish for industrial land.
Commercial real estate broker Robert Hand says, "In Jefferson Parish there are currently 80 properties of vacant land for sale at an average price of $5.68 per square foot over the last 12 months, which is up from an average price of $5.44 per square foot over the last two years. Because our company designs and executes a strategic marketing plan for each property, we were able to target a specific market for this industrial property and negotiated a price over $10 per square foot."
In marketing the M-2 zoned property, Hand concentrated on permitted uses and targeted specific industry groups using NAICS codes for businesses. The offer to purchase the property had to be re-negotiated four times to allow the purchaser to sell another property in order to finance the purchase of the industrial lot. Each re-negotiation was a challenge because the seller wanted to allow time for the buyer to fund the purchase, but needed protection in case the buyer was unable to complete the transaction. Hand's solution was to require the buyer to pay the seller a non-refundable payment in order to keep the property off the market and allow the buyer more time to fund the purchase.
The sale at a high price for industrial land could be a trend, says Hand, "It's called 'Highest and Best Use', and commercial property owners are getting smart about their real estate and getting expert advice to help them maximize their return on assets, just like big corporations do. In this case the buyer had an industrial property in an area that was transforming into a retail area, causing the property values to increase. So it just made sense that the industrial property owner would sell to someone who would pay a higher value for the industrial property because they could put the property into retail use which provides a higher return. The industrial property owner then utilizes the cash from the sale to purchase a larger industrial property and make their business more efficient."
Hand thinks the commercial market will see more property owners experience the same situation because New Orleans is almost 300 years old and it is common to see areas transition into different uses, especially since Katrina. If you want to track the price trend on office, retail, or industrial property, Hand keeps a chart of each on his website, www.louisianacommercialrealty.com.
Louisiana Commercial Realty announced today the completion of negotiations and the purchase of 2200 Royal Street for the newest location of a Sukho Thai restaurant in New Orleans. Robert Hand, president of Louisiana Commercial Realty, says, "After an exhausting search including hundreds of possible locations, we are pleased to have completed negotiations for our client to purchase this terrific location for a new Sukho Thai restaurant."

New Sukho Thai location at 2200 Royal Street
Like many New Orleans businesses, Sukho Thai is steeped in local tradition: Sukho Thai's owners, Keith and Supreeya Scarmuzza, are relatives of Al Scarmuzza, of Seafood City fame. Old New Orleanians remember Al's famous family presented commercial and theme song around crawfish season.
The new Sukho Thai location at 2200 Royal Street is the newest addition to the current locations at 4519 Magazine Street and 1913 Royal Street. The building was purchased for $750,000 and is approximately 3,780 square feet on two floors with authentic architectural detail and a corner location at Elysian Fields and Royal Street. One obstacle to putting the vacant property back into commerce was the HMC-2 zoning which required 21 parking spaces, and, like many properties around and in the French Quarter, the property had very little parking.
Commercial real estate broker Hand explains, "My company specializes in complex commercial real estate, so we immediately got to work to solve our client's problem. First, we researched the zoning permitted uses and parking requirements since the restaurant would be a change in use of the property from the previous office use, even though the building had been vacant for a long time. Second, we procured a letter from New Orleans' Safety and Permits Department verifying the number of grandfathered spaces at 7, which left a final parking requirement of 14 spaces. Third, we negotiated an extension in time with the seller to allow us to resolve the parking issue, and we also negotiated space with nearby parking lot owners as a back-up plan, and proceeded to help our client file an application for a parking waiver with the New Orleans' Board of Zoning Adjustments. Every neighbor within 300 feet was notified about the application for a parking waiver, and a meeting was held for neighbors to voice concerns. The meeting's results and a floor plan of the new restaurant were submitted, and a hearing was conducted by the Zoning Board who ruled to waive the parking requirement. The whole process was completed in under 8 weeks."
After a complete renovation of the inside which keeps the architectural detail and makes the space functional, the Sukho Thai restaurant will occupy the ground floor. The second floor will be for lease as office space and will include four private offices and a conference room. The restaurant is expected to open around the end of the year.
The largest contiguous Class A office tower space for lease in New Orleans' CBD is now available, according to Robert Hand, president of Louisiana Commercial Realty, who is co-marketing the office space with Maria McLellan, Associate Broker of Corporate Services with Gulf States Real Estate Services, LLC. The space encompasses four full floors at 1250 Poydras Street, located on the corner of Loyola Avenue and Poydras Street, in downtown New Orleans. The office space is available for sublease until October 31, 2018.
"The space is strategically located in the center of all the new and exciting activity in downtown New Orleans. It is next door to Champion's Square and the Superdome, across the street from City Hall and the new $200 million dollar South Market mixed-use development, adjacent to the $275 million dollar Hyatt Hotel, on the new Loyola Avenue streetcar line and near the 45 story 1001 Howard | Plaza Tower $100 million dollar redevelopment. There's more activity in this area than anywhere else in downtown New Orleans," said Robert Hand, president of Louisiana Commercial Realty.

floor 20 boardroom
Associate Broker Maria McLellan, says, "There's nothing like it in New Orleans. All four floors are fully furnished, the space is in “move-in” condition, located in the same elevator bank with the highest security available, and comes with covered parking via a skywalk to the adjacent Hyatt Hotel. This space has over 200 private offices, 15 conference rooms, 28 storage rooms, kitchens, a data center, telecommunications room and its own backup generator."

floor 20 reception area
McLellan believes the office space will be leased by a new industry relocating to Louisiana, and is targeting the digital media industry. New Orleans is an attractive destination for relocating companies because of its dynamic business environment, tax incentives, and world-renowned culture. That was GE Capital’s logic in opening its GE Capital Technology Center in 2012, according to a February 2012 BusinessWire article. “New Orleans has many of the things we need to build a center – a great location, talent, and an attractive business environment,” Brackett Denniston, GE’s senior vice president and general counsel, said.
Generous New Orleans' business incentives add to the city’s attraction, particularly for media and software companies. Hand says, "A 2010 report by the Brookings Institution showed that New Orleans has pushed far ahead of the rest of the nation in business creation. We lead the nation in providing incentives for businesses. For example, there is a 35% rebate for digital media payroll. There is a 25% tax credit for hardware expenditures. That is a dollar-for-dollar tax credit. There is a 50% bonus depreciation and tax exempt financing at a 2% interest rate. There is a tax credit for live performances up to 25% of expenditures. There is a tax credit of 30% which can also be sold on movie expenditures. There is a 39% federal plus a 25% state New Market Tax Credit for development. There is a 25% tax credit for Sound Recording expenditures. Just to name a few."

1250 Poydras Office Tower
Here is a short list of the business incentives which seem to be driving new industry to Louisiana:
Louisiana's 35% Digital Interactive Media and Software Development refundable tax credit — the strongest of its kind in the nation — is helping traditional and digital companies of all sizes gain a competitive edge.
The refund is available at the end of each year for 100% of its value claimed on Louisiana state tax return or certified applicants can receive 85% of the value earned as a rebate any time during the year. Development must be for digital media sold as a product.
The Enterprise Zone is a jobs incentive program that provides Louisiana income and franchise tax credits to a new or existing business located in Louisiana creating permanent net new full-time jobs, and hiring at least 50% of those net new jobs from one of four targeted groups. The benefit provides a one-time $2,500 job tax credit for each net new job created. A 4% rebate of sales and use taxes paid on qualifying materials, machinery, furniture, and/or equipment purchased or a 1.5% refundable investment tax credit on the total capital investment, excluding tax exempted items.
The Research and Development Tax Credit encourages existing businesses with operating facilities in Louisiana to establish or continue research and development activities within the state. Provides up to a 40% tax credit of global payroll on qualified research expenditures incurred in Louisiana — with no cap and no minimum requirement.
This Program provides a cash rebate as an incentive to encourage targeted businesses to locate in Louisiana, create quality jobs and promote economic development. The cash rebate is an annual rebate for up to 10 years of 5% of gross annual payroll for hourly wage rates of at least $14.50, or 6% of gross annual payroll for minimum hourly wage rates of $19.50. Additionally, businesses that expand or locate are eligible for a state rebate of 4%, and a local rebate for sales/use taxes paid on equipment, machinery and construction materials.
The Competitive Projects Payroll Incentive Program provides, by invitation only, an incentive rebate of up to 15 percent of a participating company's new payroll for up to 10 years. Additionally, a participating company will be eligible for either a rebate of state sales and use taxes on capital expenditures or 1.5 percent project facility expense rebate.
Provides customized workforce recruitment, screening and training to any manufacturing, corporate headquarters, warehouse and distribution, or research and development company, at no cost.
Prices for office space in New Orleans have averaged $16.41 per square foot recently, up from $15.25 in 2006, as shown in the chart below.
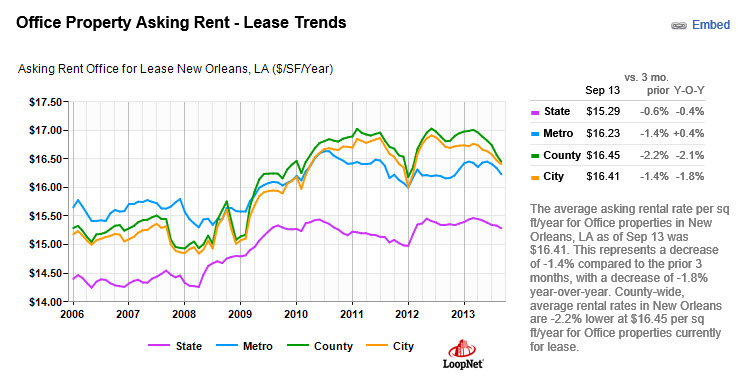
chart market trends
About Louisiana Commercial Realty LLC
Louisiana Commercial Realty LLC is renowned for its creative problem solving in marketing high value, complicated commercial properties. President Robert Hand is the only commercial real estate broker in Louisiana with an MBA and the CCIM and SIOR designations.
About Gulf States Real Estate Services LLC
Gulf States Real Estate Services LLC works with corporate users, land owners, institutional and private investors to identify, acquire, and oversee all aspects of development, leasing, sales, and construction activity. Maria McLellan has twenty years of commercial real estate experience helping national, regional and local companies lease over one million square feet of office space. She offers a comprehensive service including: assessment, market analysis, site inspection, site selection, proposal development, contract negotiation, and managing the entire move-in process.
For investors and/or commercial brokers, negotiating a commercial real estate contract can be rather daunting. If done incorrectly, then the losses can be astronomical. It is critical that you know the key provisions of a commercial real estate contract and how to effectively negotiate terms.
First and foremost, it is important to understand what your main objective of the negotiation will be. For example, is your objective to obtain the lowest price for the property? Or is your objective to close within an acceptable time frame? You get the idea. Since negotiating is a process of communication with the intent to reach a joint agreement, then it is important that you know what you want to communicate. You will notice that the Donald Trump’s of the world bring an attitude of high expectations to the negotiating table, every time.
Next, decide whether you will take a cooperative or combative approach. It should be no surprise that the cooperative approach tends to be the most effective and efficient way to negotiate. The combative approach, which includes negative comments, emotional statements, table pounding, etc…, does not leave room for any creative problem solving solutions. If you are negotiating with a combative negotiator, then it is helpful to the entire process if you do not respond emotionally. Also, do not argue and at the same time do not ignore their arguments. Furthermore, when dealing with a combative negotiator, always back up your statements with written facts.
Many people when entering into a negotiation for commercial real estate do not know that every point of the contract is negotiable. Remember that all the points in an offer can be used to help structure the deal. When followed, all the points in an offer can offer trade-off opportunities for both parties to reach a satisfactory negotiation.
Before you walk into a negotiation it is important to understand your leverage. The more that you know about the buyer’s or seller’s needs, then chances are you will be prepared with solutions for those obstacles.
Contract negotiation can be a sensitive time. Therefore, it is important that you act with integrity and try to develop a trust with the other party. If you can find some common ground with your buyer or seller, then you will be in a stronger negotiating position.
When negotiating price, know that buyers typically offer less than the list price. There is no standard percentage under the list price that is applicable when negotiating a commercial real estate contract. Market analysis’s show all the recent sales for the area, which is the best way to reference when establishing an offer.
If you are lucky enough to receive multiple offers, then it is beneficial for all parties involved to be given the opportunity to raise or adjust their offer within a set time frame. Then after that time frame the seller can review all the offers and decide which one to accept.
Finally, there is no one way to negotiate a commercial real estate contract. Just negotiate.
P![]() OSTPONING TAXES WITH 1031 EXCHANGES
OSTPONING TAXES WITH 1031 EXCHANGES
The 1031 exchange, also termed the Starker exchange or tax-deferred exchange, allows you to sell investment property and to defer capital gains and depreciation recapture taxes. Assuming that you are reinvesting 100% of the equity into “like-kind” property of equal or greater value. “Like-Kind” property is any property held for investment purposes. The idea behind 1031 exchange is that when an owner has reinvested the sale proceeds into another property, the economic gain has not yet been realized in a way that generates funds to pay any taxes. In other words, it would be unfair to tax a person on a paper gain, so to speak.
It is important to note that the 1031 exchange merely defers the tax. If and when the investment property is ultimately sold, the original deferred gain plus any additional gain realized, is subject to tax.
There are five different types of 1031 exchanges. There is the Simultaneous Exchange, which is when the exchange of the relinquished property occurs at the same time. The Delayed Exchange is common and occurs when there is a time gap between the transfer of the relinquished property and the acquisition of the replacement property. Next, the Build-to-Suit Exchange allows for the taxpayer to build on or make improvements to the relinquished property, using the exchange proceeds. The Reverse Exchange is when the replacement property is acquired prior to transferring the relinquished property. Finally, the Personal Property Exchange is when exchanges are not limited to real property; meaning personal property can also be exchanged for other personal property of like-class.
The advantages of 1031 Exchange are that there are relatively few other methods available for postponing taxes on the sale of an investment property. Another advantage of the exchange is that when you defer the tax you then have more money available to invest with. Also, any gain from depreciation recapture is postponed. The other benefit of the 1031 Exchange is that you can acquire and dispose of properties to reallocate your investment portfolio without paying tax on any gain.
The disadvantages of the 1031 Exchange are that you will have a lower depreciation schedule when you go to acquire new properties and that losses on your income tax return cannot be deducted if you exchange property rather than sell it. Therefore, if you do not want to take a loss, call it a sale and not an exchange.
In summary, the requirements for 1031 Exchange are rather simple. First, an actual exchange must take place. Second, the transfer must involve real property for real property. Additionally, the properties that are sold and acquired by you must be held for productive use in a trade, business or as an investment. There is a 45 day and a 180 day maximum timing requirement for identifying and acquiring replacement property. Finally, Section 1031 is mandatory, meaning that if you fulfill the prior requirements, then the IRS will consider your action an exchange even if you did not intend for it to be so.
There will always be risks involved when purchasing a piece of investment property. However, the goal is to minimize these risks as much as possible. The following are several potential sale contract pitfalls you may want to avoid.
It is critical that you find out if there are any defects in title before you sign on the dotted line. Since property is recorded in the form of a deed, research the public record system for the deeds to your potential real estate investment property. Sometimes, deeds are not recorded and sometimes people sell or transfer partial interests in property. It is more common than not those easements are given to cross over or use property that may or may not be of record. Additionally, a judgment against a person can be recorded and become a lien against any real property that the person owns, even without their consent. All of these issues can become a lien against title. It is better to know what you are purchasing beforehand, than to find out ten minutes before signing or even after signing the sale contract.
In the same sense, your potential investment may have a mechanics lien on it. A mechanics lien is a statutory lien that contractors, laborers, etc… may place on a property that they have performed work on. Ultimately, a mechanics lien could be used to foreclose a property.
Commercial loans, oftentimes, will require that a business maintain a certain net equity. Also, there may be pre-payment penalties, which are common on real property loans. Read the fine print and ask the appropriate questions. Lenders for large, commercial real estate deals require that there legal fees and costs be paid by the borrower(s).
For many commercial real estate investors, zoning issues can become a major sale contract pitfall. It is imperative that you make sure that not only is the relevant property zoned, but also that the zoning of nearby and adjacent properties is correct. Issues can arise down the road if government agencies or neighbors try to change the zoning on your property to limit your use of it. So, know your zone.
If you are an investor or commercial broker, then you know that changes in property values and other market fluctuations can have a profound effect on your investments. When rents go up and down and tenancy rates increase and decrease, these market fluctuations will have an impact on your property. That is why it is important to figure out when you go to sell or lease your property what the current market values are and that the property is priced correctly.
Finally, probably one of the biggest potential concerns when owning commercial property are hazardous wastes or environmental clean up problems. It is the property’s owner who is responsible for fixing any hazardous waste or environmental problems, even if the current property owner did not cause them. Also, if you are found to be in the chain of title to a contaminated property, you are then potentially responsible for paying for its clean up.
A triple net lease, also known as a true net lease, is when the tenant or lessee agrees to pay all the taxes, insurance and common area maintenance expenses that arise from the use of the property, in addition to the basic rental space costs. In a triple net lease the tenant is also responsible for all costs associated with repairs or replacement of structural building elements of the property. It is common for the expenses to increase over time, with a triple net lease.
There are both advantages and disadvantages to triple net leases. First, one advantage of a triple net lease is that the rents tend to be lower, than in other leases. The lower rents makes those types of leases favorable for real estate investors, since all the expenses incurred on the investor are decreased due to the financial responsibility of the property from the investor to the lessee.
Triple net leases can be advantageous to the tenant by providing them with many of the advantages of ownership, including control over the property, without substantial capital investment that a new acquisition requires. Also, a triple net lease can last for at least 50 years, which provides a certain type of security for the tenant.
Triple net leases are typically used for freestanding buildings, such as commercial developments or single-tenant sites.
Triple net leases may have some tax disadvantages for the lesser. If the lessee produces losses, then these could be prohibited for their tax advantage due to the passive loss limitations of the Internal Revenue Code Section 469. Also, significant income from these could cause a C corporation to become a Personal Holding Company or an S corporation to lose their status.
This type of lease can be risky to the investor/lesser. Landlords run into the probability that a tenant may not be able to pay the fees and therefore end up allowing the building to go in disrepair. There have been cases where the tenant was unable to pay for the upkeep of the property and so they decided to damage the property in order to collect the insurance money. This is why it is not uncommon for there to be a reserve fund set up for the tenant to make payments to, in case of an emergency or repairs.
A triple net lease is constructed between the tenant and the lesser, on a case by case basis. There may be certain restrictions or stipulations found within the contract. For example, terms of the lease may include a cap on the total amount on property taxes that the tenant is required to pay. Therefore, if the property taxes rise above a certain amount, then the lesser will be responsible to pay the remainder. There may also be certain caps on the rise of insurance rates and/or the cost of maintenance.
If you are considering a triple net lease, then it is imperative that you make sure that you understand and agree upon all the terms.
![]() Even though large tracts of vacant land are scarce in New Orleans, it can be difficult to accurately value raw land. This article explains how sophisticated commercial property investors value land to determine if their development is feasible.
Even though large tracts of vacant land are scarce in New Orleans, it can be difficult to accurately value raw land. This article explains how sophisticated commercial property investors value land to determine if their development is feasible.
How property is valued will surprise you. The value depends on how the site is utilized. It's called highest and best use. A gas station is more profitable than a car wash, so it can pay more for the land in order to get a business into commerce. A hotel is more profitable than a gas station, so it can pay more for the land. When property is put to the highest and best use, the resources are allocated properly, everyone benefits. The public benefits from the highest taxes on the property coming into the city coffers. The seller benefits from receiving the best price. The buyer benefits because the property allows a feasible project to put capital to work and earn a desired rate of return. So the value is not what the seller paid for the land. That is sunk cost and immaterial to a buyer. The value is what the highest price is that makes the new use of the property feasible.
Land Residual Technique
It is called the Land Residual Technique: a method of estimating land value in which the net operating income attributable to the land is capitalized to produce an indication of the land's contribution to the total property.
The land residual technique is but one of the residual techniques available. Another technique, and one more common in the highest and best use analysis, is the cost analysis version. With this technique, a hypothetical building is constructed that represents the highest and best use of the site. Deductions are then made for the creation costs (i.e. labor, capital, and entrepreneurship) to arrive at a residual value for the underlying site. Both techniques have their place and, depending on the available data, can be very useful in estimating site values or in connection with a proper, well-supported highest and best use analysis. Let's try an example. What if you were planning to build a hotel on land that is currently a parking lot? How would you value the land under a 340 room hotel assuming $200 per night rates at 60 percent occupancy with overall expenses at 60%?
?Rent is $200.00/night.
?Vacancy and collection loss is 40%.
?Expenses to the landlord are 60%.
?Overall capitalization rates for a property like the subject property are 10%.
?Constructions costs are $175,000 per room but does not include the site value.
Determine the net operating income (IO) for the property.
Potential Gross Income (340 rooms x $200/night) $25,000,000
Less: Vacancy & Collections (40%) $10,000,000
Effective Gross Income $15,000,000
Expenses (60%) $9,000,000
NOI (IO) $6,000,000
Capitalize the NOI (IO) into a value.
VO = NOI (IO) / Cap Rate
VO= $6,000,000/ 0.10
VO= $60,000,000
Deduct the construction costs from the total costs (except land).
VL= $60,000,000 - $59,500,000 (340 rooms at $175,000 each)
VL= $500,000
The end value is $500,000 but that is not the value of the land. The value of the land is best determined by the market, or what the values are of other like properties that can also be purchased and put to the same use. What the end value does tell us is the maximum price the developer can pay for the land and still make the project feasible.
If the land asking price is higher than $500,000, the developer has to find a way to reduce construction costs or increase net operating income through reduced expenses or increased revenues, or not buy the property.
Sources: www.louisianacommercialrealty.com, Appraisal Institute: Advanced Spreadsheet Modeling
New Orleans East is an area with seven times the national population growth rate and an estimated 100,000 people with median household income of $43,000 who are underserved by businesses yet to come back to the area. An opportunity exists for retail businesses to come to the area and this report examines which businesses are in demand. Our analysis shows a current need for furniture stores, supermarkets, lawn and garden stores, sporting goods and clothing stores. This report examines not only the demographics of population, income and age, but also the consumer spending behavior and compares spending in this area to the national average in a variety of categories to determine where spending is higher than normal, called the Market Potential Index. We also conduct a Retail Gap Analysis, where we determine where the gaps are in money spent on goods and services and businesses selling goods and services, and calculate the Leakage Factor showing money spent outside the area which could be spent inside the area, if only businesses were there to provide the goods and services.
Neighborhoods
This analysis shows there is real demand for supermarkets and estimate $111,000,000 is currently spent on food at home, but we also drill down in the data to determine what types of items a supermarket could sell to have a competitive advantage. For example, within a 10 minute drive time, there is $38,000,000 spent on snacks for food at home. There is little competition for some of these needed industries. Currently there is no sporting goods store or clothing or department store in the area. There are only two Winn-Dixie supermarkets and none along the I-10 corridor where demand is highest.
The area has enjoyed a neighborhood rejuvenation with major developments such as the new Lowe’s on Read Road, a proposed library at Lake Forest, a new Methodist Hospital on Read Road near I-10 which was recently purchased by the City of New Orleans, and the new $40 million dollar Village de Jardin, a 224-unit mixed-use senior housing center near Crowder and I-10. The area is also unique in that it is close to four colleges and universities, an airport, and also major employers like NASA and Lockheed Martin.
Until the late 1800’s, New Orleans East was outside of the city limits of New Orleans, although within Orleans Parish. There was little development other than in two areas. The first area hugged the long, narrow ridge of higher ground along Gentilly Road, which followed the natural levee of an old bayou. Various farms, plantations, and small villages such as Michoud were sited along this ridge. The other older area of development consisted of a linear strip of "camps", clusters of houses raised high on wooden stilts, in the shallows along the edge of Lake Pontchartrain, the largest and longest-lasting of these being at Little Woods.
In the early 1900’s some residential development of the area began, at first as an extension of Gentilly. Construction of the Industrial Canal began in 1918 and was completed in 1923, creating the principal barrier that would separate the East from the rest of New Orleans. New Orleans East's present southern boundary was realized in 1944 with the completion of a re-routing of the Intracoastal Waterway, involving the excavation of a new segment stretching east from the Industrial Canal to the Rigolets and cut through the raw swampland south of the Gentilly Ridge and north of Bayou Bienvenue.
The great growth of the East did not occur until after World War II, and particularly commenced during the administration of Mayor Vic Schiro (1961–1970). Many new subdivisions were developed in the 1960’s and 1970’s, to cater to those who preferred a more suburban lifestyle but were open to remaining within the city limits of New Orleans. New Orleans East grew in a comparatively well-planned and neatly zoned fashion. Some care was taken to avoid placing major thoroughfares along the rights-of-way of unsightly drainage canals, as had frequently occurred in suburban Jefferson Parish. Instead, major roads such as Mayo, Crowder, Bundy, Read, and Bullard were located equidistant from parallel canals and were outfitted with landscaped medians, or neutral grounds. Numerous subdivisions were developed with large lakes at their centers, providing both an assist to neighborhood drainage and a scenic backdrop for the backyards of homes. From the late 1960’s onwards, buried utilities were required, lending to new development in the East a pleasingly uncluttered visual appearance quite distinct from the wire-hung stop light signals, tangled webs of power lines, and forests of leaning utility poles common to suburban New Orleans. By 1980, New Orleans East had received significant commercial office and retail investment, epitomized by the regional mall The Plaza at Lake Forest, the largest in Greater New Orleans at the time of its completion.
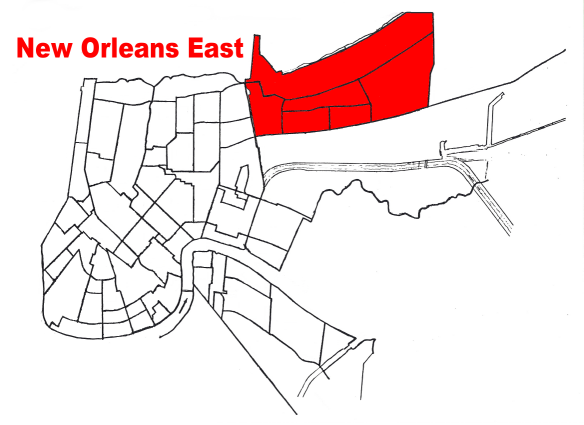
New Orleans East is bounded by the Industrial Canal to the West, the Intracoastal Waterway to the South, Bayou Savage Wildlife Preserve to the East and Lake Ponchartrain to the North.

New Orleans East Boundaries
New Orleans East is primarily zip codes 70126, 70117, 70128 and 70129.
St. Bernard Parish borders the area to the South.

New Orleans East Zip Codes
This analysis focuses on three areas designated by drive times: a 5 minute drive time (blue area), 10 minute drive time (brown area) and 15 minute drive time (green area) from the center of New Orleans East at Read Road and Interstate 10. Notice the 15 minute drive time almost reaches Slidell to the east and extends west to the French Quarter, Central Business District and Lakeside Mall.

Map Drive Times
Within the 5 minute drive time, the population is estimated to grow from 35,217 in 2010 to 45,824 by 2015. This is seven times the national growth rate. The average household income in 2010 was $43,486.
Drive Time: 5 minutes |
||
Demographic Summary |
2010 |
2015 |
Population |
35,217 |
45,824 |
Total Number of Adults |
25,930 |
33,827 |
Households |
11,851 |
15,477 |
Median Household Income |
$43,486 |
$45,717 |
In addition to the population count, we can drill down in the data to determine how the population spends money, which will help determine what businesses are needed. We can examine spending behavior, which is demand, and services offered by current businesses, which is supply, and the result is the Retail Gap Analysis, which will show us what businesses are needed because of unfulfilled demand. These data are based upon national propensities to use various products and services, applied to local demographic composition. Usage data were collected in a nationally representative survey of U.S. households, and forecasts for 2010 and 2015 are prepared by ESRI.
We also calculate the propensity to spend in various categories of consumer behavior within the 5 minute drive time, and the results on the following pages are organized into three columns:
Product/Consumer Behavior |
# Adults |
% Adults |
MPI |
| Apparel (Adults) | |||
| Bought any men's apparel in last 12 months |
12,323 |
47.5% |
94 |
| Bought any women's apparel in last 12 months |
11,154 |
43.0% |
94 |
| Bought apparel for child <13 in last 6 months |
8,367 |
32.3% |
114 |
| Bought any shoes in last 12 months |
13,037 |
50.3% |
96 |
| Bought any costume jewelry in last 12 months |
5,831 |
22.5% |
108 |
| Bought any fine jewelry in last 12 months |
6,888 |
26.6% |
116 |
| Bought a watch in last 12 months |
6,134 |
23.7% |
114 |
| Automobiles (Households) | |||
| HH owns/leases any vehicle |
9,528 |
80.4% |
92 |
| HH bought new vehicle in last 12 months |
815 |
6.9% |
83 |
| Automotive Aftermarket (Adults) | |||
| Bought gasoline in last 6 months |
21,076 |
81.3% |
94 |
| Bought/changed motor oil in last 12 months |
12,762 |
49.2% |
95 |
| Had tune-up in last 12 months |
7,634 |
29.4% |
94 |
| Beverages (Adults) | |||
| Drank bottled water/seltzer in last 6 months |
16,859 |
65.0% |
103 |
| Drank regular cola in last 6 months |
15,119 |
58.3% |
112 |
| Drank beer/ale in last 6 months |
10,697 |
41.3% |
97 |
| Cameras & Film (Adults) | |||
| Bought any camera in last 12 months |
3,988 |
15.4% |
104 |
| Bought film in last 12 months |
5,684 |
21.9% |
93 |
| Bought digital camera in last 12 months |
1,716 |
6.6% |
94 |
| Bought memory card for camera in last 12 months |
1,974 |
7.6% |
100 |
| Cell Phones/PDAs & Service (Adults) | |||
| Bought cell/mobile phone/PDA in last 12 months |
7,482 |
28.9% |
98 |
| Avg monthly cell/mobile phone/PDA bill: $1-$49 |
5,855 |
22.6% |
87 |
| Avg monthly cell/mobile phone/PDA bill: $50-99 |
8,692 |
33.5% |
105 |
| Avg monthly cell/mobile phone/PDA bill: $100+ |
4,280 |
16.5% |
108 |
| Computers (Households) | |||
| HH owns a personal computer |
7,954 |
67.1% |
93 |
| HH spent <$500 on home PC |
1,139 |
9.6% |
106 |
| HH spent $500-$999 on home PC |
2,051 |
17.3% |
94 |
| HH spent $1000-$1499 on home PC |
1,474 |
12.4% |
84 |
| HH spent $1500-$1999 on home PC |
838 |
7.1% |
85 |
| Spent $2000+ on home PC |
719 |
6.1% |
78 |
| Health (Adults) | |||
| Exercise at home 2+ times per week |
6,973 |
26.9% |
91 |
| Exercise at club 2+ times per week |
2,335 |
9.0% |
78 |
| Visited a doctor in last 12 months |
19,688 |
75.9% |
97 |
| Used vitamin/dietary supplement in last 6 months |
11,324 |
43.7% |
92 |
| Home (Households) | |||
| Any home improvement in last 12 months |
3,219 |
27.2% |
87 |
| Used housekeeper/maid/cleaning service in last 12 months |
1,626 |
13.7% |
87 |
| Purchased any HH furnishing in last 12 months |
1,099 |
9.3% |
88 |
| Purchased bedding/bath goods in last 12 months |
6,497 |
54.8% |
100 |
| Purchased cooking/serving product in last 12 months |
2,837 |
23.9% |
88 |
| Bought any kitchen appliance in last 12 months |
1,907 |
16.1% |
91 |
| Insurance (Adults) | |||
| Currently carry any life insurance |
12,504 |
48.2% |
100 |
| Have medical/hospital/accident insurance |
17,639 |
68.0% |
94 |
| Carry homeowner insurance |
12,065 |
46.5% |
88 |
| Carry renter insurance |
1,841 |
7.1% |
118 |
| Have auto/other vehicle insurance |
19,925 |
76.8% |
91 |
| Pets (Households) | |||
| HH owns any pet |
4,523 |
38.2% |
80 |
| HH owns any cat |
2,125 |
17.9% |
77 |
| HH owns any dog |
3,215 |
27.1% |
78 |
| Reading Materials (Adults) | |||
| Bought book in last 12 months |
12,234 |
47.2% |
95 |
| Read any daily newspaper |
10,699 |
41.3% |
96 |
| Heavy magazine reader |
6,411 |
24.7% |
124 |
| Restaurants (Adults) | |||
| Went to family restaurant/steak house in last 6 mo |
18,588 |
71.7% |
98 |
| Went to family restaurant/steak house last mo: <2 times |
6,546 |
25.2% |
97 |
| Went to family restaurant/steak house last mo: 2-4 times |
6,668 |
25.7% |
94 |
| Went to family restaurant/steak house last mo: 5+ times |
5,379 |
20.7% |
106 |
| Went to fast food/drive-in restaurant in last 6 mo |
23,133 |
89.2% |
99 |
| Went to fast food/drive-in restaurant <5 times/mo |
7,347 |
28.3% |
93 |
| Went to fast food/drive-in 5-12 times/mo |
7,657 |
29.5% |
94 |
| Went to fast food/drive-in restaurant 13+ times/mo |
8,131 |
31.4% |
113 |
| Fast food/drive-in last 6 mo: eat in |
8,270 |
31.9% |
83 |
| Fast food/drive-in last 6 mo: home delivery |
3,092 |
11.9% |
107 |
| Fast food/drive-in last 6 mo: take-out/drive-thru |
13,532 |
52.2% |
100 |
| Fast food/drive-in last 6 mo: take-out/walk-in |
6,975 |
26.9% |
110 |
| Telephones & Service (Households) | |||
| HH owns in-home cordless telephone |
6,937 |
58.5% |
91 |
| HH average monthly long distance phone bill: $60+ |
572 |
4.8% |
110 |
| Product/Consumer Behavior |
# Adults |
% Adults |
MPI |
| Convenience Stores (Adults) | |||
| Shopped at convenience store in last 6 months |
15,257 |
58.8% |
98 |
| Bought cigarettes at convenience store in last 30 days |
4,018 |
15.5% |
105 |
| Bought gas at convenience store in last 30 days |
8,343 |
32.2% |
97 |
| Spent at convenience store in last 30 days: <$20 |
2,175 |
8.4% |
86 |
| Spent at convenience store in last 30 days: $20-39 |
2,722 |
10.5% |
105 |
| Spent at convenience store in last 30 days: $40+ |
8,943 |
34.5% |
98 |
| Entertainment (Adults) | |||
| Attended movies in last 6 months |
15,456 |
59.6% |
102 |
| Went to live theater in last 12 months |
2,950 |
11.4% |
90 |
| Went to a bar/night club in last 12 months |
4,139 |
16.0% |
87 |
| Dined out in last 12 months |
10,169 |
39.2% |
80 |
| Gambled at a casino in last 12 months |
3,995 |
15.4% |
96 |
| Visited a theme park in last 12 months |
5,725 |
22.1% |
99 |
| DVDs rented in last 30 days: 1 |
635 |
2.4% |
92 |
| DVDs rented in last 30 days: 2 |
1,089 |
4.2% |
90 |
| DVDs rented in last 30 days: 3 |
843 |
3.3% |
105 |
| DVDs rented in last 30 days: 4 |
1,037 |
4.0% |
100 |
| DVDs rented in last 30 days: 5+ |
3,013 |
11.6% |
88 |
| DVDs purchased in last 30 days: 1 |
1,255 |
4.8% |
90 |
| DVDs purchased in last 30 days: 2 |
1,321 |
5.1% |
97 |
| DVDs purchased in last 30 days: 3-4 |
1,564 |
6.0% |
123 |
| DVDs purchased in last 30 days: 5+ |
1,834 |
7.1% |
131 |
| Spent on toys/games in last 12 months: <$50 |
1,626 |
6.3% |
100 |
| Spent on toys/games in last 12 months: $50-$99 |
657 |
2.5% |
92 |
| Spent on toys/games in last 12 months: $100-$199 |
1,736 |
6.7% |
94 |
| Spent on toys/games in last 12 months: $200-$499 |
2,502 |
9.6% |
93 |
| Spent on toys/games in last 12 months: $500+ |
1,283 |
4.9% |
90 |
| Financial (Adults) | |||
| Have home mortgage (1st) |
3,483 |
13.4% |
74 |
| Used ATM/cash machine in last 12 months |
12,300 |
47.4% |
93 |
| Own any stock |
1,852 |
7.1% |
79 |
| Own U.S. savings bond |
1,439 |
5.5% |
78 |
| Own shares in mutual fund (stock) |
2,067 |
8.0% |
85 |
| Own shares in mutual fund (bonds) |
1,268 |
4.9% |
85 |
| Used full service brokerage firm in last 12 months |
1,367 |
5.3% |
87 |
| Used discount brokerage firm in last 12 months |
575 |
2.2% |
113 |
| Have 401K retirement savings |
3,695 |
14.3% |
86 |
| Own any credit/debit card (in own name) |
17,371 |
67.0% |
91 |
| Grocery (Adults) | |||
| Used beef (fresh/frozen) in last 6 months |
17,573 |
67.8% |
98 |
| Used bread in last 6 months |
25,134 |
96.9% |
101 |
| Used chicken/turkey (fresh or frozen) in last 6 months |
19,679 |
75.9% |
102 |
| Used fish/seafood (fresh or frozen) in last 6 months |
13,945 |
53.8% |
105 |
| Used fresh fruit/vegetables in last 6 months |
22,089 |
85.2% |
99 |
| Used fresh milk in last 6 months |
23,356 |
90.1% |
99 |
| Product/Consumer Behavior |
# Adults |
% Adults |
MPI |
|
|
|
|
|
| Television & Sound Equipment (Households) | |||
| HH owns 1 TV |
2,074 |
17.5% |
88 |
| HH owns 2 TVs |
2,781 |
23.5% |
88 |
| HH owns 3 TVs |
2,761 |
23.3% |
104 |
| HH owns 4+ TVs |
2,827 |
23.9% |
114 |
| HH subscribes to cable TV |
6,969 |
58.8% |
102 |
| HH watched 15+ hours of cable TV last week |
7,308 |
61.7% |
103 |
| Purchased audio equipment in last 12 months |
1,080 |
9.1% |
110 |
| Purchased CD player in last 12 months |
724 |
6.1% |
116 |
| Purchased DVD player in last 12 months |
1,297 |
10.9% |
104 |
| Purchased MP3 player in last 12 months |
910 |
7.7% |
88 |
| Purchased video game system in last 12 months |
998 |
8.4% |
97 |
| Travel (Adults) | |||
| Domestic travel in last 12 months |
11,732 |
45.2% |
86 |
| Took 3+ domestic trips in last 12 months |
4,302 |
16.6% |
80 |
| Spent on domestic vacations last 12 mo: <$1000 |
2,983 |
11.5% |
91 |
| Spent on domestic vacations last 12 mo: $1000-1499 |
1,415 |
5.5% |
79 |
| Spent on domestic vacations last 12 mo: $1500-1999 |
959 |
3.7% |
92 |
| Spent on domestic vacations last 12 mo: $2000-2999 |
868 |
3.3% |
81 |
| Spent on domestic vacations: $3000+ |
1,029 |
4.0% |
82 |
| Foreign travel in last 3 years |
5,340 |
20.6% |
82 |
| Took 3+ foreign trips by plane in last 3 years |
876 |
3.4% |
75 |
| Spent on foreign vacations last 12 mo: <$1000 |
1,201 |
4.6% |
84 |
| Spent on foreign vacations last 12 mo: $1000-2999 |
956 |
3.7% |
93 |
| Spent on foreign vacations: $3000+ |
838 |
3.2% |
69 |
| Stayed 1+ nights at hotel/motel in last 12 months |
9,057 |
34.9% |
84 |
Two conclusions can be drawn from consumer spending data. First, the preceding pages show where the MPI exceeds 100, meaning a higher than average propensity to spend on seafood, chicken or turkey in both the 5 and 10 minute drive time. Second, the population is high enough to support at least four supermarkets, using the assumption that a 50,000 square foot supermarket needs a population of approximately 8,000 residents.
Population |
35,217 |
|
|
Supermarket-Consumer Behavior |
# Adults |
% Adults |
MPI |
Used beef (fresh/frozen) in last 6 months |
17,573 |
67.8% |
98 |
Used bread in last 6 months |
25,134 |
96.9% |
101 |
Used chicken/turkey (fresh or frozen) in last 6 months |
19,679 |
75.9% |
102 |
Used fish/seafood (fresh or frozen) in last 6 months |
13,945 |
53.8% |
105 |
Used fresh fruit/vegetables in last 6 months |
22,089 |
85.2% |
99 |
Used fresh milk in last 6 months |
23,356 |
90.1% |
99 |
10 Minute Drive Time |
|||
Population |
114,408 |
||
Supermarket-Consumer Behavior |
# Adults |
% Adults |
MPI |
Used beef (fresh/frozen) in last 6 months |
55,638 |
66.4% |
96 |
Used bread in last 6 months |
81,008 |
96.7% |
100 |
Used chicken/turkey (fresh or frozen) in last 6 months |
62,963 |
75.2% |
101 |
Used fish/seafood (fresh or frozen) in last 6 months |
44,710 |
53.4% |
105 |
Used fresh fruit/vegetables in last 6 months |
70,776 |
84.5% |
98 |
Used fresh milk in last 6 months |
75,389 |
90.0% |
99 |
We can drill down further in the data to determine how much is spent on food at
home. Within a 5 minute drive time, total amount of money spent on food at home
exceeds $39,000,000, and within a 10 minute drive time exceeds $111,000,000.
The supply of operational large supermarkets is limited to two Winn Dixie
stores, both located to the south on Chef Menteur.

table supermarket demand
Using the industries categorized by NAICS code, research allows us to examine where demand might exceed supply which would dictate that a need for a business in that industry would exist. We can determine supply by estimating sales to consumers by establishments, but sales to businesses are excluded. We forecast demand, or retail potential, by estimating the expected amount spent by consumers at retail establishments. Supply and demand estimates are in current dollars. The gap between demand and supply is called the Leakage Factor, which presents a snapshot of retail opportunity. This is a measure of the relationship between supply and demand that ranges from +100 (total leakage) to -100 (total surplus). A positive value represents ‘leakage’ of retail opportunity outside the trade area. A negative value represents a surplus of retail sales, a market where customers are drawn in from outside the trade area. The Retail Gap represents the difference between Retail Potential and Retail Sales. Retail establishments are classified into 27 industry groups in the Retail Trade sector, as well as four industry groups within the Food Services & Drinking Establishments subsector. Developed in cooperation with Canada and Mexico, NAICS represents one of the most profound changes for statistical programs focusing on emerging economic activities. The system was developed using a production-oriented conceptual framework, grouping establishments into industries based on the activity in which they are primarily engaged. NAICS moves down in detail from Sector to Subsector to Group then to Industry. This is an improvement over the previous method, the 1987 Standard Industrial Classification (SIC) system.
The chart below shows the Leakage Factor by NAICS Subsector for the target area. The highest Leakage Factor shows new businesses needed are:

Leakage By NAICS
Research can get more specific for more detailed level of industry classification which shows unsatisfied demand for industry groups: vending machines, used merchandise retailers, and lawn and garden stores.

Leakage By Industry
The Leakage Factor shows what businesses are needed by the percent that demand exceeds supply, but research also shows the dollar amount of the unfulfilled demand. This can be used to forecast sales for a business coming into the area. New businesses with the highest sales (Retail Gap) are:

table retail gap
The Michoud Assembly Facility is an 832-acre site owned by NASA and located in New Orleans East. Organizationally, it is part of NASA's Marshall Space Flight Center. It is one of the largest manufacturing plants in the world with 43 environmentally controlled acres under one roof, and it employs approximately 3,700 people. Since September 5, 1973, it has been used for the construction of the Space Shuttle's External Tanks by its lead contractor Lockheed Martin. The Michoud Assembly Facility is currently a multi-tenant complex which is currently maintained and operated by Jacobs Technology. in order to allow both commercial and government contractors, as well as government agencies to use the site. The facility was originally constructed in 1940 at the village of Michoud, Louisiana by Higgins-Tucker division of Higgins Industries under the direction of Andrew Jackson Higgins on behalf of the United States government for the war production during World War II to make plywood C-46 cargo planes and landing craft. During the Korean War it made engines for Sherman and Patton tanks. It came under the management of NASA in 1961 and was used for the construction of the S-IC first stage of the Saturn V rocket and the S-IB first stage of the Saturn IB rocket. It is home to the first stage of the last constructed Saturn V, SA-515.
The Michoud Assembly Facility has been most closely associated with the construction and production of NASA's External Tank (ET) program. Throughout the Space Shuttle program, the facility produced 136 tanks. Rollout for ET-1 used for STS-1 was rolled out June 29, 1979. The last flight ready tank, ET-122, rolled out on. Only tank produced at the facility, ET-94, was not used in spaceflight and remained at Michoud as a test article.
The Michoud Assembly Facility also houses other organizations such as the National Finance Center operated by the United States Department of Agriculture, the United States Coast Guard, and the National Center for Advanced Manufacturing, a partnership between the state of Louisiana, the University of New Orleans, Blade Dynamics and NASA.
Within a 5 minute drive time, the growth of population in the area is 7 times the national average, and the satellite map below shows a few of the new businesses in the area such as Lowe’s, McDonald’s, Waffle House, Popeye’s, Day’s Inn, Best Western, Chase, and large developments such as the proposed Methodist Hospital and new $40 million senior housing center Village de Jardin.

rejuvination
Village de Jardin, a 224-unit mixed-use senior housing center in eastern New Orleans between Lake Forest Boulevard and Interstate 10. The $39.7 million project, funded by the Federal Emergency Management Agency and the Louisiana Recovery Authority, is expected to be completed in 18 months. The senior housing section of the complex will consist of two apartment buildings, each five stories tall with 150 either one- or two-bedroom apartments. Space is being considered for a commercial kitchen and dining area, a covered garage, an exercise facility, a lounge, a wellness center/clinic, activity rooms, a common area and administrative and maintenance offices. The attached unit housing is composed of eight buildings with three individual living spaces connected by exterior porches and common garden areas. There will be 14 single-family garden homes. In addition, there will be 45 townhouse-style apartments and retail space for lease. The total amount of FEMA funding available for the project is $46.4 million, including $6.6 million previously obligated for demolition of the former Gaslight Apartments.
The Methodist Hospital was purchased on June 16, 2010, by the city of New Orleans for $16.25 million, with Mayor Mitch Landrieu promising to redevelop the vacant building into an 80-bed public hospital that would be the first to open east of the Industrial Canal since Hurricane Katrina in 2005. Administration officials say the city is negotiating with a potential operator for a new hospital and plans to open an emergency department within a year and complete a full renovation sometime in 2013 to serve a population base now at 77,000 and projected to be 105,000 by 2014. The total redevelopment, according to the Landrieu administration’s 100-page review of the health care system in eastern New Orleans, is projected to cost $110 million.
New Orleans East is close to four Universities and Lakefront Airport

universities
In the 5 minute drive time, population from 2000 to 2009 declined from 67,717 to 32,391. The population is expected to grow to 45,693 by 2014. The household growth rate from 2009 to 2014 is among the highest in the US at 7.28%.
5 minute drive time |
10 minute drive time |
15 minute drive time |
|
| Population Density, 2000 |
67,717 |
343,898 |
658,759 |
| Population Density, 2009 |
32,391 |
200,007 |
478,534 |
| Per Capita Income, 2009 |
14,405 |
16,875 |
20,391 |
| Average Household Income, 2009 |
40,743 |
42,560 |
50,039 |
| Renter Occupied Housing Units, 1990 |
45% |
47% |
45% |
| Renter Occupied Housing Units, 2000 |
46% |
47% |
45% |
| Renter Occupied Housing Units, 2009 |
22% |
29% |
33% |
| Renter Occupied Housing Units, 2014 |
32% |
39% |
39% |
| 2009 Population, age 20-24 |
2,426 |
15,489 |
38,109 |
| 2009 Population, age 25-34 |
4,291 |
27,241 |
67,181 |
Households By Income, 2009 |
5 minute drive time |
10 minute drive time |
15 minute drive time |
| under $10,000 |
14% |
16% |
13% |
| $10,000-$19,999 |
17% |
18% |
16% |
| $20,000-$29,999 |
14% |
15% |
13% |
| $30,000-$39,999 |
14% |
12% |
12% |
| $40,000-$49,999 |
9% |
9% |
9% |
| $50,000-$59,999 |
9% |
8% |
8% |
| over $60,000 |
19% |
19% |
19% |
| Households By Income, 2009 |
11,440 |
77,589 |
191,851 |
| 2009 to 2014 Household Growth Rate |
7.28% |
5.92% |
3.34% |
The annual growth rate in the area of 5 minute drive time is 7 times the state and national average (see chart below, Trends 2009-2014).

population growth rate
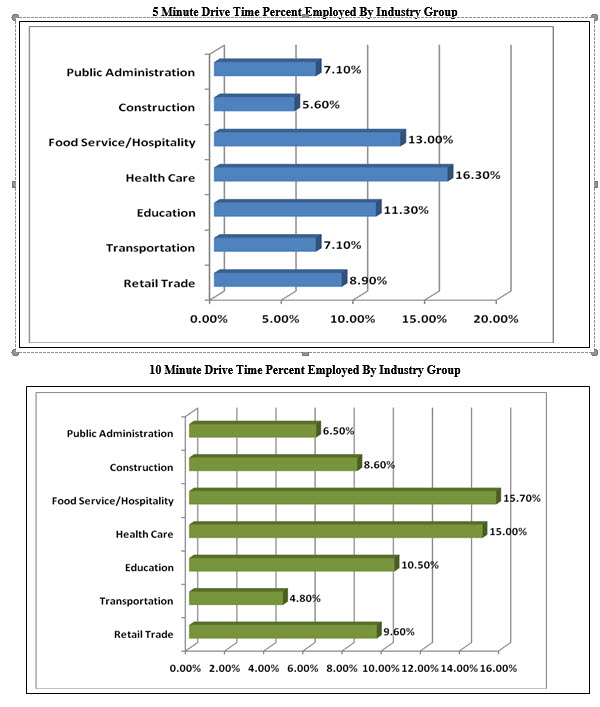
chart industry employment
Population within a 5 minute drive time exceeds the US average in every age group below 35, and the 55-64 age group, and 37% of the population with a 5 minute drive time earns over $40,000 annually.
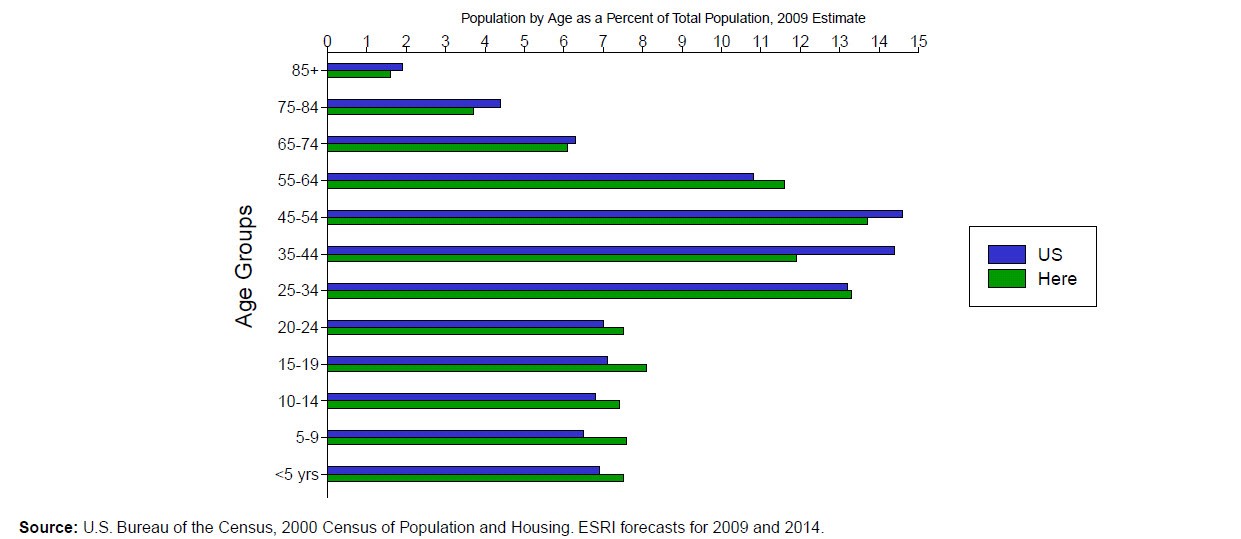
population by age

chart households by income
The 2008 traffic study by the Louisiana Department of Transportation showed the I-10 traffic in New Orleans east between 34,000 and 58,000 cars per day.

traffic count map
Sources: wwwlouisianacomercialrealty.com; US Bureau of Census; ESRI; CCIM Site To Do Business
For a copy of the report in pdf format with original tables and charts, email the author at roberthand@cox.net.
New Orleans Commercial Real Estate is a diversified market with seven different sectors, each sector is different in size. The table below shows the major sectors of the New Orleans commercial real estate market, as well as the average asking prices and actual transaction price variance, and the number of days the property was on the market.

market statistics for new orleans commercial real estate
Currently there is 4.1 million square feet of New Orleans commercial real estate for sale and 3.9 million square feet of New Orleans commercial real estate for lease. Of the space for lease, the office sector comprises 2.4 million square feet, with 1.8 million square feet for lease and 600,000 square feet for sale. The average asking lease rate is $16.35 per square foot but the actual lease rate is around $14 per square foot and has been on the market 590 days. Since 2006, the office lease rates have increased steadily in New Orleans from $15 per square foot, with a few hiccups in 2008 and 2011. The New Orleans office lease rate has been 7% higher than the average lease rate in the state.

chart asking office rents
Source: www.louisianacommercialrealty.com, lacdb, loopnet
![]() Research shows the available space in the Metairie office/warehouse market is the smallest of the six major areas of industrial space in the New Orleans MSA, with just 47,540 square feet, or 1% of the total square footage of available space, as seen in the table and pie chart below.
Research shows the available space in the Metairie office/warehouse market is the smallest of the six major areas of industrial space in the New Orleans MSA, with just 47,540 square feet, or 1% of the total square footage of available space, as seen in the table and pie chart below.
| Market | Warehouse Availability |
| (SF) | |
| CBD | 957,167 |
| East New Orleans | 716,028 |
| Elmwood & South Metairie | 1,188,729 |
| Kenner | 215,664 |
| North Metairie | 47,540 |
| St. Charles & St. John | 448,911 |
| Westbank | 1,110,211 |
| TOTAL | 4,684,250 |

chart of metairie industrial market size
2012 was the second consecutive year of positive absorption of warehouse space which Metairie has not witnessed in six years.

chart showing positive absorption in metairie industrial market
Economics would dictate that such small supply of available space would command high prices, but that would assume demand is constant among all markets, which it is not. Metairie competes with the Elmwood market since it is in close proximity, and the result is a ceiling on prices of available space in the Metairie market. In Elmwood, smaller office/warehouse space rents for an average of $6.00 per square foot and larger spaces average closer to $3.00 per square foot. New Orleans commercial real estate leases typically are triple net, with the tenant paying taxes and insurance.

chart of rental rates 2012 by market
The Loopnet database currently includes only ten listings in the Metairie area, and as of September 2012, the average lease rate was $6.05 per square foot, an increase of 5.6% year over year, down from the peak in 2008 when many post Katrina three year leases were not renewed.
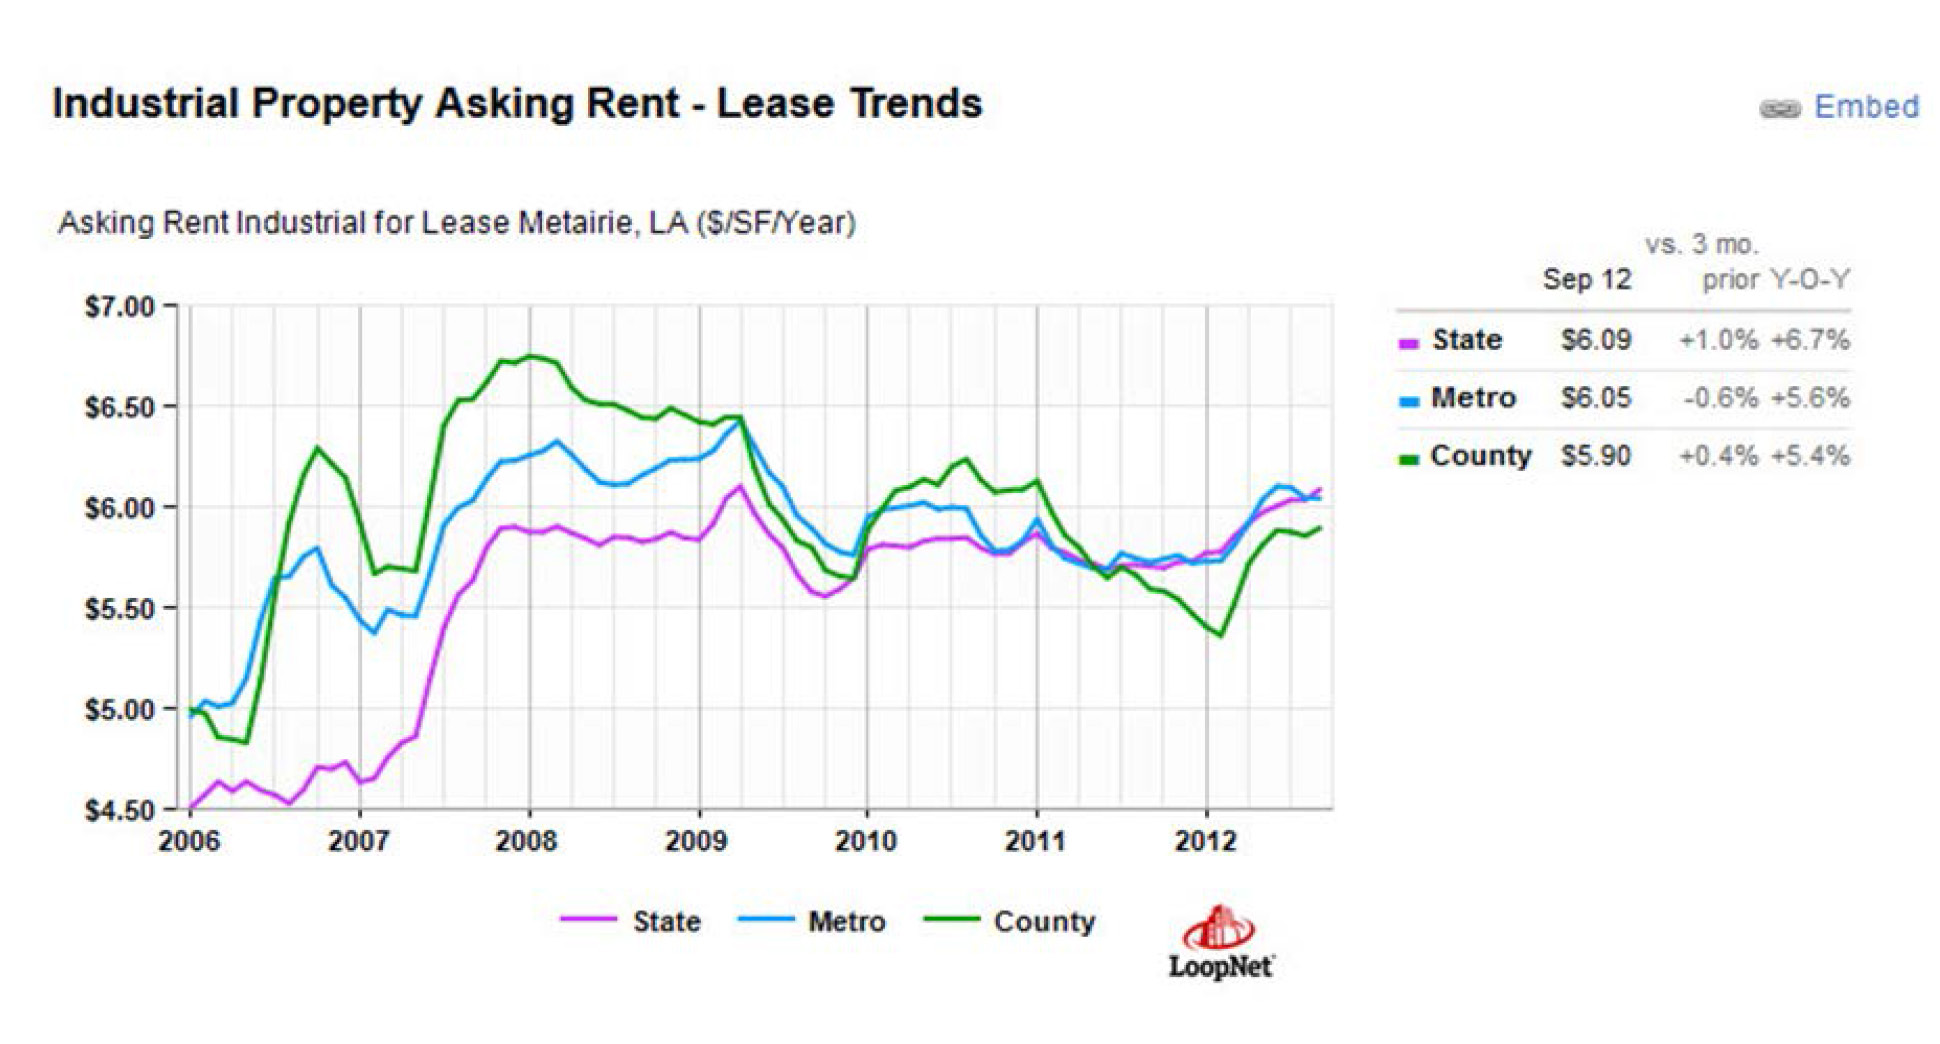
industrial property asking rents
There are currently only ten industrial properties for sale in the Metairie market, according to the Loopnet database, with an average asking price of $51.04, down 8.8% year over year.
A smaller database, LACDB has 21 industrial properties for sale and for lease in Metairie, totaling 236,085 square feet and averaging a sale price of $56.17 or lease price of $5.67 per square foot and have been on the market an average of 211 days. Final transaction prices are reported to have occurred on average at 11.3% below the list price.

industrial property sale prices
sources: Louisiana commercial real estate databases, www.louisianacommercialrealty.com
copyright, 2013, Louisiana Commercial Realty LLC
In the wake of Hurricane Katrina, many New Orleans companies discovered too late that a Business Continuity Plan ensures operations can continue in the event of a disaster. New Orleans commercial real estate firms were especially affected since their continued operation was vital to businesses getting back on their feet by securing new office and distribution space. Large companies have a detailed plan to protect the data on their computer servers but thousands of small firms can use the same template for more common catastrophes like losing a cell phone containing all your contacts, appointments and emails.
Here are the basics of any good Business Continuity Plan:
Sources:
http://www-935.ibm.com/services/us/en/it-services/business-continuity-and-resiliency-services.html
www.purdue.edu
http://web.mit.edu/security/www/pubplan.htm
http://www.finra.org/industry/issues/businesscontinuity/p006464
If you operate a bar or music venue, you already realize the fire marshal can close down your business for a variety of reasons. For example, the allowed capacity is one person for every 7 square feet of space if the property is sprinklered, or 142 people per 1,000 square feet. Property not sprinklered requires 15 square feet per person, or a capacity of 66 people per 1,000 square feet. Even the juke box at F and M's on Tchoupitoulas draws a crowd bigger than that.
Regulations come from a National Fire Code, The Americans for Disabilities Act, The Uniform Construction Code Council and The American National Standards Institute. There is also Energy Code Compliance. In charge of implementing the law is Butch Browning, the Louisiana Fire Marshal, who created the Louisiana State Fire Marshal's Online Manual which draws from Louisana law under Titles 14, 22, 23, and 40 of the Louisiana Revised Statutes.
The Fire Marshall publishes an Annual Report and monthly Interpretive Memos covering topics such as fire alarms, sprinkler systems, emergency evacuation and the kitchen environment. You can get a Plan Review by an architect at the Fire Marshal's Office, and they have satellite offices all over the state. Just call 225-925-4920.
Sources:
http://sfm.dps.louisiana.gov/index.htm
www.louisianacommercialrealty.com
Copyright 2012. #firecode
You would think if a property in Orleans Parish has the same zoning designation as a property in Jefferson Parish, that the permitted use would be the same. Logical, but not true. In Orleans Parish, the C-1, Commercial, zoning designation allows residential, single-family development, but in Jefferson Parish, new single family development is not allowed. You have to read the Jefferson Parish Zoning Code carefully, since the language initially states residential is allowed, but that means existing residential. If you are developing residential on vacant land in Jefferson Parish, you cannot do so in C-1 zoning. Here is how the zoning code actually reads in each parish. Notice how in Orleans Parish you have to follow the lineage since one zoning designation allows a different zoning designation.
In C-1 districts only the following uses of property shall be permitted:
(1) Any existing stand-alone single-family, two-family, three-family, or four-family dwelling shall be recognized as a conforming use; however, the existing stand alone single-, two-, three-, or four-family dwelling cannot be restored if it is destroyed beyond seventy-five (75) percent or more of its value.
The following uses of land are authorized as permitted uses with the C-1 General Commercial District subject to the performance standards of Section 7.5:
The following uses of land are authorized as permitted uses in the B-1 Neighborhood Business District subject to the performance standards of Section 7.5, except that timeshare buildings, transient vacation rentals, bowling alleys, and uses which sell alcohol for consumption on the premises or for consumption off the premises occupying 5,000 square feet or less are prohibited.
The following uses of land are permitted uses within the B-2 Neighborhood Business District subject to the performance standards of Section 7.5, except that timeshare buildings, transient vacation rentals, and bowling alleys are prohibited:
The following uses of land are authorized as permitted uses in the RM-1 Multiple-Family Residential District except that timeshare buildings and transient vacation rentals are prohibited:
The following uses of land are authorized as permitted uses in the RM-2 Multiple-Family Residential District except that timeshare buildings and transient vacation rentals are prohibited:
The following uses of land are authorized as permitted uses within the RS-1 Single-Family Residential District, except that timeshare buildings and transient vacation rentals are prohibited:
The chart below summarizes the Orleans Parish Zoning Code relationships for the C-1, Commercial, designation.
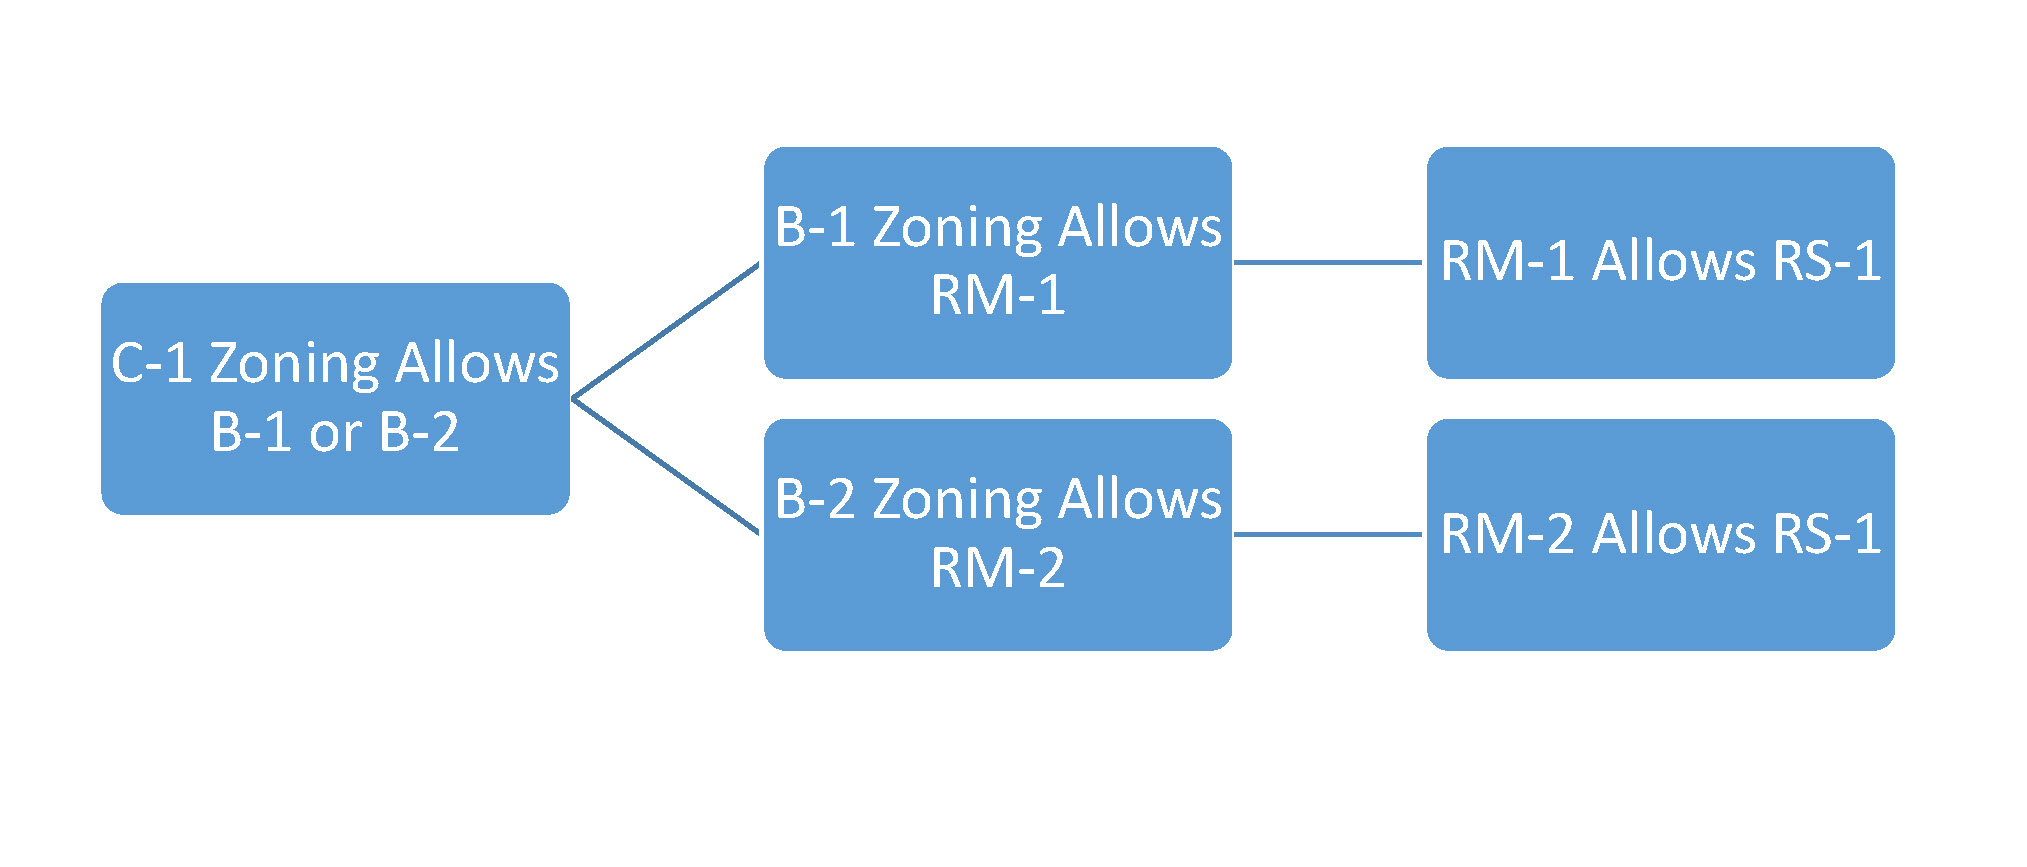
zoning code chart
Figure 1-Orleans Parish Zoning Ordinance C-1
There are 13 basic tools using technical analysis that can assist you in investing. These tools of technical analysis, combined with fundamental analysis, could give you more confidence in decision-making.
The 10 Day Moving Average Long/Short signal is designed to identify stocks that are technically sound and whose price has retraced to within 1% of its 10 day moving average. This condition is typically a good entry point since it represents a situation where by a stock is in a short term up trend and has retraced back to an area which represents the average price paid for the stock over the preceding ten day period.
In addition to the above criteria, both the Money Flow Index and the slope of the next longer term moving average (21 Day) are incorporated into the formula. The Money Flow Index (MFI) is an oscillator that tracks the flow of money into or out of a stock. A MFI value over 80 signals an Overbought (Bearish) condition while readings below 20 are considered to be an Oversold (Bullish) condition. To confirm the stock's longer term price trend, the slope of the 21 day moving average is utilized. A Positive slope (Bullish) denotes a rising moving average while a Negative Slope (Bearish) denotes a declining moving average.
The following is a summary of the conditions necessary to generate the 10-Day Moving Average BUY/SHORT signals:
The 21 Day Moving Average Long/Short signal is designed to identify stocks that are technically sound and whose price has retraced to within 1% of its 21 day moving average. This condition is typically a good entry point since it represents a situation where by a stock is in a short term up trend and has retraced back to an area which represents the average price paid for the stock over the preceding twenty-one day period.
In addition to the above criteria, both the Money Flow Index and the slope of the next longer term moving average (50 Day) are incorporated into the formula. The Money Flow Index (MFI) is an oscillator that tracks the flow of money into or out of a stock. A MFI value over 80 signals an Overbought (Bearish) condition while readings below 20 are considered to be an Oversold (Bullish) condition. To confirm the stock's longer term price trend, the slope of the 50 day moving average is utilized. A Positive slope (Bullish) denotes a rising moving average while a Negative Slope (Bearish) denotes a declining moving average.
The following is a summary of the conditions necessary to generate the 21-Day Moving Average BUY/SHORT signals:
Stochastics is an Overbought/Oversold oscillator that compares today's price to a present window of high and low prices. This data is then transformed into a numerical range that varies between 0 and 100. Stochastic readings of 20 or less denote an Oversold condition. Values of 80 or greater signal an Overbought scenario. Stochastic indicators can either be Fast or Slow and are referred to as as Fast %K and Slow %K. Slow %K is the same as Fast %K except that it is smoothed with a simple moving average to make it less erratic.
The relative movements of each stochastic value are used to identify both Buy and Short Sale entry points. Buy Signals are generated when Fast %K is below 20 (Oversold), is increasing in value and crosses Slow %K curve from below. Short Sale Signals occur when Fast %K is above 80 (Overbought), is decreasing in value and crosses Slow %K from above.
RSI was developed by J. Welles Wilder to detect Overbought and Oversold conditions. The Index is comprised of three variables:
RSI measures the degree of strength left in a price trend. If Price has been declining and RSI drops to 30 or lower, traders should be alerted to a probable reversal of the downtrend, since momentum would appear to be losing its strength. If RSI moves above 70 as Price rises, an intermediate top is usually imminent.
Oscillator indicators such as RSI are most effective in a trading range market environment. The problem with oscillators is that stocks can enter an Overbought/Oversold area and remain in this condition for an extended period of time. Research has demonstrated that the best signals obtained from the RSI oscillator are when the stock is coming out of these extreme conditions.
Buy signals are generated when a stock's RSI value has been under 30 (oversold) and then crosses above 30. Short Sale signals are created when a stock's RSI value has been over 70 (overbought) and then crosses below 70.
CCI is a powerful technical tool that is used to identify stocks that are either at the top or bottom of their trading cycle. The CCI reflects the increase in volatility that typically occurs as a stock approaches either a short term top or bottom. As the mean price of a stock distances itself from its average mean price, the stock approaches an Overbought/Oversold area. CCI readings of -100 or less are regarded as Oversold (bullish) while readings of +100 and higher are considered to be an Overbought (bearish) condition. Once the CCI enters either of these regions, conditions exist for the short term trader to enter the market.
Although CCI signals provide excellent entry points, research has demonstrated that stronger BUY/SELL signals can be achieved by delaying entry points until the CCI retraces from an Overbought/Oversold area and crosses the zero line.
Buy signals are generated when the CCI declines below -100 and the crosses the zero line from below while Short Sale signals are produced when the CCI exceeds +100 and the crosses the zero line from above. generated a CCI-SELL signal.
The Chaikin Oscillator integrates the effect of volume and price movement when determining Buy/Sell points. It uses the product of average price for a day's trading activity and volume. The underlying premise is that as the price of a stock moves up it is under accumulation and down when under distribution. The key is that the stock's daily volume must confirm the move to be valid. The Chakin Oscillator creates a volume multiplier which increases during periods of accumulation (stock closes above its midpoint for the day) and decreases during periods of distribution (stock closes below its midpoint for the day). When all variables are taken into account, the Chaikin Oscillator has its highest values when price is increasing under heavy volume, conditions present during a healthy advance. The lowest values are generated during a price decrease under low volume.
Buy signals are generated when the Chaikin Oscillator is making new lows and the slope of the 21-day moving average is positive. Short Sale signals are created when the Chaikin Oscillator is making new highs and the slope of the 21-day moving average is negative.
A stock's moving average is the average of the closing prices over a designated period of time. The last point of a ten-day moving average is the average price that the stock closed at over the last ten trading days. The second to last point is the average close of the next most recent ten days, and so on. These points are plotted over time to form a graph representing the smoothed price movement of the stock. The fewer the number of days used in a moving average, the more sensitive the moving average will be. This is because one day's closing price will have a greater effect on an average of the closes over the last ten days than it will on an average over the last twenty-one days.
Moving average trading strategies are based on crossings of faster and slower moving average to trigger Buy and Sell signals. The logic behind this approach is that as a fast moving average crosses a slower moving average, the price trend of the stock is reversing.
Buy signals are generated when the faster moving 10-Day Moving Average crosses the slower moving 21-Day Moving Average from below. Conversely Short Sale signals are created when the faster moving 10-Day Moving Average crosses the slower 21-Day Moving Average from above.
Developed by Gerald Appel, Moving Average Convergence/Divergence Short Term (MACD-ST Cross) utilizes various exponential moving averages of a stock's closing price to generate Buy and Sell signals. Exponential moving averages assign greater weight to the most recent price data and therefore are more sensitive than simple moving averages. MACD consists of the Differential Line and the Signal Line. The Differential Line is constructed by measuring the difference between two exponential moving averages, a 12- and 26-day time period. The Signal Line is a 9-day exponential moving average of the Differential Line.
Buy signals are generated when the Differential Line crosses the Signal Line from below while Sell signals occur when the Differential Line crosses the Signal Line from above. For the Differential line to cross the Signal Line from below the difference between the 12-day and the 26-day exponential moving averages must widen (diverge). For this to occur, the shorter term moving average (12-day) must move away from the longer term moving average. The Buy signal is triggered when this divergence is sufficient enough to cause a cross of the Signal Line.
Short Sale signals are generated when the opposite scenario exists. The difference between the 12-day and the 26-day averages must narrow (converge), suggesting that the price of the stock is trending down. The signal occurs when the declining Differential Line crosses the Signal Line from above.
Moving Average Convergence/Divergence Long Term (MACD-LT Cross) was developed by Gerald Appel. MACD utilizes various exponential moving averages of a stock's closing price to generate Buy and Sell signals. Exponential moving averages assign greater weight to the most recent price data and therefore are more sensitive than simple moving averages. MACD consists of the Differential Line and the Signal Line. The Differential Line is constructed by measuring the difference between two exponential moving averages, a 38- and 78-day time period. The Signal Line is a 18-day exponential moving average of the Differential Line.
Buy signals are generated when the Differential Line crosses the Signal Line from below while Sell signals occur when the Differential Line crosses the Signal Line from above. For the Differential line to cross the Signal Line from below the difference between the 38-day and the 78-day exponential moving averages must widen (diverge). For this to occur, the shorter term moving average (38-day) must move away from the longer term moving average. The Buy signal is triggered when this divergence is sufficient enough to cause a cross of the Signal Line.
Short Sale signals are generated when the opposite scenario exists. The difference between the 38-day and the 78-day averages must narrow (converge), suggesting that the price of the stock is trending down. The signal occurs when the declining Differential Line crosses the Signal Line from above.
A stock's moving average is the average of the closing prices over a designated period of time. The last point of a ten-day moving average is the average price that the stock closed at over the last ten trading days. The second to last point is the average close of the next most recent fifty days, and so on. These points are plotted over time to form a graph representing the smoothed price movement of the stock. The fewer the number of days used in a moving average, the more sensitive the moving average will be. This is because one day's closing price will have a greater effect on an average of the closes over the last fifty days than it will on an average over the last two-hundred days.
Moving average trading strategies are based on crossings of faster and slower moving average to trigger Buy and Sell signals. The logic behind this approach is that as a fast moving average crosses a slower moving average, the price trend of the stock is reversing.
Buy signals are generated when the faster moving 21-Day Moving Average crosses the slower moving 50-Day Moving Average from below. Conversely Short Sale signals are created when the faster moving 21-Day Moving Average crosses the slower 50-Day Moving Average from above.
A stock's moving average is the average of the closing prices over a designated period of time. The last point of a ten-day moving average is the average price that the stock closed at over the last ten trading days. The second to last point is the average close of the next most recent fifty days, and so on. These points are plotted over time to form a graph representing the smoothed price movement of the stock. The fewer the number of days used in a moving average, the more sensitive the moving average will be. This is because one day's closing price will have a greater effect on an average of the closes over the last fifty days than it will on an average over the last two-hundred days.
Moving average trading strategies are based on crossings of faster and slower moving average to trigger Buy and Sell signals. The logic behind this approach is that as a fast moving average crosses a slower moving average, the price trend of the stock is reversing.
Buy signals are generated when the faster moving 50-Day Moving Average crosses the slower moving 200-Day Moving Average from below. Conversely Short Sale signals are created when the faster moving 50-Day Moving Average crosses the slower 200-Day Moving Average from above.
The original theory of On-Balance-Volume (OBV) was developed by Joseph Granville. The basic assumption underlying the method is that the marketplace is divided between "Smart Money" and the "General Public." Smart money accumulates stocks at low prices and distributes it to the general public at higher prices. The OBV technique is an attempt to uncover smart money's hidden accumulation and distribution patterns before significant price movement occurs.
OBV is computed in the following manner. If a stock closes up for the day, the total volume for that day is considered to have been Buy Induced and therefore the stock is under accumulation. Conversely, a stock that closes down for the day is regarded as having been under Sell Induced pressure and the trading activity is considered to have been distribution. The volume on Up days is totaled against the volume traded on Down days. The net is a 50 day running total of OBV, and is either a positive which is bullish (BL) or negative, a bearish (BR) condition.
Buy signals are created when OBV is positive and price has experienced a negative divergence meaning it is lower than it was when OBV previously peaked. Short Sale signals are generated when OBV is negative and price has experienced a positive divergence meaning it is higher than it was when OBV recorded a new low reading. Both of these conditions suggest a potential sling shot move in the stock as price returns to levels in line with the OBV indicator.
Relative Strength (RS) is calculated by taking a stocks price performance and comparing it to the price performance of the S&P 500 over the previous fifty days of trading. RS ratings of 1.01 or higher are positive and indicate that the stock has out performed the S&P 500 during the last 50 days. Readings of .99 or less indicates that the stock has under performed the S&P 500, a negative condition.
Buy signals are created when RS is positive and price has experienced a negative divergence meaning it is lower than it was when RS previously peaked. Short Sale signals are generated when RS is negative and price has experienced a positive divergence meaning it is higher than it was when RS recorded a new low reading. Both of these conditions suggest a potential sling shot move in the stock as price returns to levels in line with the Relative Strength indicator.
© 2013 Computrade Systems, Inc. Market Edge® and Second
Opinion® are registered trademarks of Computrade Systems, Inc.
Advanced Tools is designed for the experienced investor/trader. It consists of 3 modules: Point & Figure Analysis, Trading Systems, and Industry Group Analysis.
Point & Figure Analysis uses Point & Figure Charts to identify stocks which are breaking through Resistance(bullish) or Support(bearish) areas. This module identifies those stocks that have broken through these areas and those stocks that will break through if they trade through the Breakout Price. Point & Figure Analysis is for those traders who are thoroughly familiar with the use of Point & Figure Charts.
Trading Systems is for the advanced technicians. It is a series of technical trading systems that identify significant chart patterns. In order to properly use one of these systems, you need to be completely familiar with the technical indicators that make up the system. This is not for novices.
Industry Group Analysis provides daily analysis for 94 major industry groups. The groups are first analyzed using various Market Edge indicators to identify those groups that show favorable/unfavorable market conditions. The individual stocks that make up the group are then reviewed using Second Opinion for buy/short decisions. The purpose of this analysis is to identify those stocks in the groups that are leading the industry. Studies have shown that when an Industry group moves, the entire group tends to move in concert, with certain stocks in the group outperforming the remaining stocks.
To properly use Industry Group Analysis, the investor/trader must have superior discipline in that there are very few independent decisions to make once a group has been identified. The user must stick to the list of stocks in the group and not add stocks he thinks may be similar.
Market Letter consists of three proprietary market timing models; the Cyclical Trend Index (CTI), the Sentiment Index and the Momentum Index.
Cyclical Trend Index (CTI): The CTI is based on a technical application known as Cyclical Analysis. The underlying premise of Cyclical Analysis is that the market, as measured by the Dow Jones Industrial Average (DJIA), tends to move in cycles that often resemble sine waves, a basic cycle which determines much of the motion in the universe. The utilization of sine waves in market forecasting is based on studies that demonstrate that stocks, and in particular the DJIA, tend to experience price reversals at anticipated time intervals. These intervals, referred to as cycles, consist of the price movement of the DJIA from a significant Low to an identifiable High, followed by a retreat to a recognizable Low. Cyclical Analysis systematically determines the beginning and ending points of these various cycles enabling the user to accurately time purchases and sales for maximum profit. To picture how these cycles influence price direction, visualize the stock market as a piece of elastic that is constantly subjected to positive or negative forces that exert pressure in the same or opposite directions. These forces are the five cycles that are incorporated in the CTI. The following table classifies each Cycle by its average time duration:
| Cycle | Average Time Duration | A | 6 weeks (+or-) 2 weeks | B | 18 weeks (+or-) 3 weeks | C | 36 weeks (+or-) 5 weeks | D | 72 weeks (+or-) 10 weeks | E | 216 weeks (+or-) 32 weeks |
Ideally, each cycle exerts upward pressure at the beginning of its time frame and continues to do so until it is one-half completed. At this point, the process is reversed resulting in negative pressures being applied to the market. When dealing with five cycles, the picture can become confusing. Two cycles may be in an up posture, while one may be flat, and the remaining two may be pointing down. In order to have a collective positive or negative picture of the state of the market, each cycle must be evaluated in such a way as to total their independent, positive or negative forces. This is done by assigning each cycle either a positive or negative numerical value based upon the amount of time that has elapsed since it's previous bottom. The sum of these + or - values is called the Cyclical Trend Index (CTI). This indicator reduces the cyclical status of the market to an absolute, numerical value. Readings of +1 to +21 indicate a Bullish trend in the market, whereas a 0 to -21 value signals a downward, Bearish scenario.
A major problem that can arise when employing Cyclical Analysis in forecasting the market is the determination of starting points for the various cycles. Errors in assigning an accurate count can lead to aborted readings and adverse results. This problem can occur when identifying a cycle's low and is most pronounced when more than one of the cycles are due to make a bottom. In order to rectify this problem, both a Momentum Index and a Sentiment Index have been developed and are used in conjunction with the Cyclical Trend Index to refine the Market Timing Model.
Momentum Index: The Momentum Index is designed to measure market divergence by comparing the performance of eight, non-Dow Jones Industrial Average Indices to that of the Dow Jones Industrial Average. Divergence is a technician's term that measures whether the DJIA is performing better or worse than the majority of the other market indices. Whenever the DJIA goes its own way for a period of time, whether up or down, a market turn is usually at hand. Typically, negative divergence (DJIA is up while broader indices are trending down) exists at significant market tops, while positive divergence (DJIA is down while broader indices are trending up) indicates a market bottom.
Momentum Index::...................................................+3 Bullish
| Indicators | Current Reading | Connotation |
| Dow Jones Industrial Averages (DJIA) | 11005.37 | |
| Dow Jones Transportation Average | 2929.20 | NEGATIVE |
| S&P 500 Index | 1277.9 | NEGATIVE |
| NYSE Composite Index | 647.13 | NEUTRAL |
| NYSE Advance-Decline Line | -58859 | POSITIVE |
| 10 Day MA Advance-Decline Line | 1.21 | POSITIVE |
| AMEX Index | 936.04 | POSITIVE |
| NASDAQ Composite Index | 2251.06 | NEGATIVE |
| DJ Utilities Index | 390.07 | POSITIVE |
| Trin (5 Day Average) | 1.34 | NEUTRAL |
| NYSE New High-New Lows | 511-48 | POSITIVE |
| Zweig Breadth Indicator | 0.46 | NEGATIVE |
| McClellan oscillator | -1 | NEGATIVE |
| McClellan Summation Index | 2879 | NEGATIVE |
| Unchanged Issue index | 0.07 | NEUTRAL |
Included in the Index are four additional indicators that measure the market's positive or negative breadth & momentum. An explanation of these indicators follows.
Zweig Breadth Indicator divides the number of NYSE advancing issues by the sum of the NYSE advancing and declining issues. Readings above .6 are regarded as Bullish while levels below .4 are Bearish.
McClellan Oscillator measures the difference between the number of NYSE advances and declines over a 19-day period subtracted from the number of advances and declines over a 39-day observation. This indicator is regarded as Bullish when it drops below zero and is Bearish when above zero.
TRIN 5-Day Average is computed by dividing the ratio of NYSE advancing issues to declining issues by the ratio of advancing issue volume to declining issue volume. Market Edge calculates a ten-day moving average of this index. Values above 1.24 are Bullish, while values below .75 are Bearish.
Unchanged Issue Index is calculated by dividing the number of NYSE unchanged issues by the total number of NYSE issues traded. Readings less than .186 are Bearish, while readings greater than .22 are Bullish.
Sentiment Index: The Sentiment Index, which measures the degree of optimism or pessimism prevalent in the market, is an important indicator when attempting to determine he market's future direction. Market Edge tracks nine technical indicators that measure excessive speculative or sentiment conditions prevalent in the market.
Sentiment Index . . . . . . . . . . . . . . . . . . . . . . . . . . +3 Neutral
| Indicators | Current Reading | Connotation |
| Odd Lot Short Ratio (5 Day Avg.) | 5.24 | BEARISH |
| NYSE Short Interest Ratio | 4.80 | BULLISH |
| Public-Specialist Short Ratio | 0.36 | NEUTRAL |
| Put/Call Ratio (5 day Avg.-Index Options) | 1.40 | BULLISH |
| Dividend Yield Spread | 5.56 | NEUTRAL |
| Mutual Fund liquid Asset Ratio | 5.80 | BULLISH |
| Bullish Investment Advisors | 47.9 | NEUTRAL |
| Bearish Investment Advisors | 35.4 | NEUTRAL |
| Bearish + Corrections Total | 52.1 | NEUTRAL |
| VIX (CBOE Volatility Index) | 22.9 | NEUTRAL |
Sentiment based technical indicators are:
| Indicators | Current Reading | Connotation |
| Odd Lot Short Ratio: The number of Odd Lot shares sold short divided by the total number of Odd Lot sales. | +10 - +50+.06 - +.09+.00 - +.05 | BULLISH NEUTRAL BEARISH |
| NYSE Short Interest Ratio: The number of shares sold short on the NYSE divided by the average monthly trading volume. | +3.5- +9.0+3.0 - +3.5+0.0 - +3.0 | BULLISH NEUTRAL BEARISH |
| Public-Specialists Short Ratio: The number of NYSE shares sold short by the public divided by the # of shares sold short by the specialist. | +.60 - UP+.36 - +.59+.00 - +.35 | BULLISH NEUTRAL BEARISH |
| Put-Call Option Ratio: A ten day moving average of the number of Index Put options purchase divided by the number of Index Call options purchased. | +1.70 - UP+1.00 - +1.69+.00 - +1.00 | BULLISH NEUTRAL BEARISH |
| Dividend Yield Spread: The relationship between the average NYSE dividend rate and the yield on thirty-year Treasury bonds. | +3.00 - +5.75+5.75 - +6.75+6.75 - +9.99 | BULLISH NEUTRAL BEARISH |
| Mutual Fund Liquid Asset Ratio: The ratio of mutual fund cash to total assets. | +11% - +20%+09% - +10%+00% - +08% | BULLISH NEUTRAL BEARISH |
| Bullish Investment Advisors: The percentage of newsletter writers who are Bullish on the market as measured by Investors Intelligence. | +00% - +40%+41% - +54%+55% - +99% | BULLISH NEUTRAL BEARISH |
| Bearish Investment Advisors: The percentage of newsletter writers who are Bearish on the market as measured by Investors Intelligence. | +50% - +99%+21% - +49%+00% - +20% | BULLISH NEUTRAL BEARISH |
| Bearish + Corrections Total: The total percentage of newsletter writers who are either Bearish or forecasting a correction for the market as measured by Investor Intelligence. | +00% - +29%+30% - +69%+70% - +99% | BULLISH NEUTRAL BEARISH |
Each indicator is assigned a positive, negative or zero value depending on whether its reading is deemed to be Bullish, Bearish or Neutral. The sum of these values is referred to as the Sentiment Index. Plus 3 to plus 11 readings are Bullish, while minus 1 to minus 11 readings are Bearish.
Is Jack Welch right in his claim the 7.8% #unemployment numbers released on October 5 by the Bureau of Labor Statistics are suspect? The numbers show there are 133,500,000 nonfarm workers employed as of September 2012. There are actually two surveys performed, one is called the Household Survey which is also reported as the Adjusted Household Survey ( smoothed for population control revisions) and the second survey is called the Payroll Survey. Over the last 12 years, the percent of workers unemployed is still near its highest level at 40%, down from 45% but well above the 10% number in the 1990 recession.
The most telling number and what Jack Welch, ex-CEO of General Electric, can't reconcile with the 7.8% number is the labor force participation rate at 63.5% which is at a 12 year low, down from a high of 67% in 1999, and a steep drop from the 2008 labor participation rate of 66%.
The employment to population ratio is a 12 year low of 59%, down from a 1999 high of 65%, and not all employment sectors have responded equally to the recent economic cycle, with construction, information and government jobs negative over the last 2 years.
The largest decline was a 470,000 job loss in the government sector since February 2010. The largest employment gains were 1,414,000 in professional and business services and 1,015,000 in health care, followed by 746,000 in hospitality over the last 2 years. Not all races have responded equally since the 2008 recession with african american unemployment at 13.4% and 16 to 24 year old unemployment at 15.5% as of September 2012. There is also an 8 year high of people not in the labor force at 2,500,000, called marginally attached, and a 12 year high of involuntary part time employment of 8,000,000 workers, up from a 1999 low of 3,000,000 workers.
Click this link for the full explanation and PowerPoint presentation by the Bureau of Labor Statistics: BLS employment explanation.
Sources: Department of Commerce, Census Bureau, Thomas Nardone, Associate Commissioner for Employment and Unemployment Statistics at the Bureau of Labor Statistics.
copyright www.louisianacommercialrealty.com, new orleans commercial real estate.
The growth rate of the economy is slowing, according to the latest figures released from the Bureau of Economic Analysis. Back in August 2013, personal income grew at .5% and then is September grew at .4% but then in October, November, December started to wane with December's growth less than .1 percent. This means we should prepare for a slower growth economy and possibly a stagnant one to come over the next 12 months.
Personal income increased $2.3 billion, or less than 0.1 percent, and disposable
personal income decreased $3.8 billion, or less than 0.1 percent, in
December according to the Bureau of Economic Analysis. Personal consumption
expenditures increased $44.1 billion, or 0.4 percent. In November,
personal income increased $29.8 billion, or 0.2 percent, DPI increased $14.4
billion, or 0.1 percent, and PCE increased $74.8 billion, or 0.6 percent, based
on revised estimates.
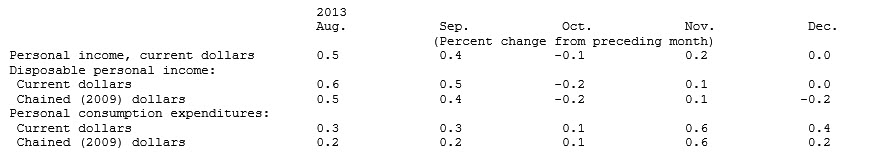
The total supply of commercial real estate for sale in New Orleans is approximately $726,000,000 with vacant land being the largest sector valued at almost $242 million, followed by office property valued at $175 million.
There are two databases that house information on most of the commercial property for sale in the New Orleans area. The largest, Loopnet.com, claims to have 3,000,000 registered users nationally who spend an average of twenty minutes searching through 640,000 listings.
LACDB.com is the other database, a Louisiana host for the Catylist Network, which claims access to 100,000 commercial agents nationally and is used by approximately 800 Louisiana commercial real estate agents. Most commercial agents make sure their property for sale is listed in both databases, and some also use the MLS database to increase visibility to residential agents. LACDB.com provides data on the actual sale price of properties which can be compared to the original list price of properties to provide useful information on the actual value of commercial real estate.
This price trend is determined by a variance, called the Demand/Supply Gap. For example list prices for warehouses ranged from $10-$20/sf in New Orleans East to $60-$70/sf in Elmwood, but averaged $35 per square foot overall. Since actual sale prices averaged $26 per square foot, sellers were willing to accept 31% less than originally expected. This gap is a measure of strength or weakness in a market. As shown in Table One and the Supply/Demand Gap Chart, retail sector prices had to fall 34% before buyers were interested.
| Listed | Actual | Variance | |
| Industrial | $35.06 | $26.85 | -31% |
| Office | $72.93 | $67.89 | -7% |
| Shopping Center | $60.37 | $71.87 | 16% |
| Retail-Commercial | $94.25 | $70.36 | -34% |
| Multi Family | $50.19 | $56.92 | 12% |
In the New Orleans MSA, which includes Metairie and Kenner, there is a higher supply of land, office, retail and industrial property versus any other sector, but the average price of land for sale is $1.1 million compared to the average shopping center priced at $2.2 million. The total market of commercial real estate for sale totals $726 million.
Table Two: Value of Commercial Sectors In New Orleans MSA |
||
| Property Type | Total Value | Listed |
| Industrial | $94,481,600 | 77 |
| Office | $175,583,362 | 115 |
| Shopping Center | $33,500,140 | 15 |
| Retail-Commercial | $122,664,722 | 123 |
| Vacant Land | $242,866,435 | 221 |
| Multi Family | $57,094,550 | 53 |
| TOTAL | $726,190,809 | |
COPYRIGHT 2012, www.louisianacommercialrealty.com. / orig.pub.jan. 2009.
Commercial real estate in New Orleans is often valued incorrectly which can be a disaster, but it also creates opportunity: big money is made when you understand how to value commercial real estate correctly. This article examines three basic mistakes anyone can make when valuing commercial real estate.
The first mistake commercial real estate buyers and sellers make is to depend on appraisals, whose main function is to finance the property by allowing a bank committee to say they used a logical process to make a loan to purchase the property. The appraisal value is not the same as the market value and here's why: the appraisal looks at past sales and corrects for physical differences. Makes sense but the past is not the future. The basic assumption in all appraisals is that it assumes that the past sales that took place between a willing buyer and seller would repeat themselves. In reality, commercial real estate is always purchased by a buyer who has a specific use for that specific property and may not have the same use for an additional property even though it is similar. Often commercial real estate buyers will value a property because they can generate a certain cash flow from a business on that property. We cannot assume a nearby property has the same valuation for two reasons:
A good example of a useless appriasal was the purchase of a 40,000 square foot of land at 1667 Tchoupitoulas in New Orleans in June 2006 for $1.1 million, based on an appraisal and financed by Gulf Coast Bank. The buyer was unsuccessful in flipping the property and put it back on the market for sale, eventually giving it back to the bank who sold the property in December 2011 for $600,000 to Infiniti Fuels who will build a convenience store on the site.
The second big mistake made in valuing commercial real estate is to depend on the last sale price. Often a seller believes that the market value of property is what he paid for it plus some carrying cost. Psychologically this is called "benchmarking". In reality, the market price is what a willing buyer would pay for it, which is more accurately predicted by what other properties match his needs. This is called the "Law of Substitution", because any buyer will ask themself, "Why should I pay one million for your property when I can get the same property down the street for $750,000?" One excellent way to determine market value is to research what other properties are selling for.
The third mistake in valuing property is not understanding "Opportunity Cost" which is the unit of some commodity "A" given up in order to obtain the same amount of commodity "B". By overvaluing commercial real estate, a property could sit unsold for several years, resulting in the owner losing the opportunity to invest those proceeds in another property, or the stock market, or give to grandchildren to pay for a college education. Smart commercial property owners understand a financial ratio called "Return on Assets", which is your property's net income divided by the value of the asset. With commercial real estate, your return is the rental income plus capital gain and property is often held several years. If you buy land for one million and forego the opportunity to sell the property for $1.5 million in 5 years because you think the property is worth 2 million, you might get your price but it might take you another 5 years to do so and your return on your asset would be 6.95% per year, not including taxes and insurance and time and property management expenses. Had you sold the property for less at $1.5 million in a shorter period of time of 5 years, your return on assets would have been 8.13% per year. Really smart commercial property owners not only know the return on assets but compare all their investments and allocate resources to the investments that have the highest return on assets with some adjustment for risk. In financial economics this is called riding the "Efficient Frontier", and it works for Mark Cuban and can work for you too.
Louisiana will be exploding with growth over the next 5 years, considering the incentives offered for businesses. For example, there is a 25% tax credit that can be sold for digital media expenditures. That is a dollar-for-dollar tax credit. There is a 50% bonus depreciation and tax exempt financing at a 2% interest rate. There is a tax credit for live performances up to 25% of expenditures. There is a tax credit of 30% which can also be sold on movie expenditures. There is a 39% federal plus a 25% state New Market Tax Credit for development in low income areas.There is a 25% tax credit for Sound Recording expenditures. We need to get the word out, and here are 14 major incentives and a summary of benefits all in one list.
14 Major Business Incentives Louisiana Offers
1. The Digital Media Incentive provides a tax credit of 25% of qualified production expenditures for state-certified digital interactive productions in Louisiana and 35% tax credit for payroll expenditures for Louisiana residents.
2. Economic Development Award Program assists publicly owned infrastructure for industrial or business development projects that promote targeted industry economic development and that require state assistance for basic infrastructure development.
3. The Enterprise Zone (EZ) program is a jobs incentive program that provides Louisiana income and franchise tax credits to a business hiring at least 35% of net new jobs from one of four targeted groups. EZs are areas with high unemployment, low income or a high percentage of residents receiving some form of public assistance. A business must create permanent net new jobs at the EZ site. A business is not required to be located in an EZ. A business does not have to invest money, only create additional jobs.
OR
4. The Gulf Opportunity Zone Act of 2005 (GO Zone) provides federal and state tax incentives for business development in parishes most affected by hurricanes Katrina and Rita.
5. The Industrial Tax Exemption (ITE) Program provides property tax abatement for up to 10 years on a manufacturer's new investment and annual capitalized additions. This exemption applies to all improvements to the land, buildings, machinery, equipment and any other property that is part of the manufacturing process.
6. The Live Performance Tax Credit program offers a fully transferable tax credit that can be sold or applied against Louisiana tax liability. Tax credits received for infrastructure cannot exceed $10 million per project and are also subject to a $60 million annual cap. There is no annual cap on the production credits. The tax credit value increases with higher levels of certified expenditures, as outlined below:
In addition to the baseline tax credits for live performance production and infrastructure, the producer may also qualify for additional incentives, including:
7. Mentor-Protégé Tax Credit program enhances Louisiana's business environment for new construction companies. This program provides technical and economic benefits to Louisiana-based contractors who will create and/or retain jobs for Louisiana citizens, expand the state's economy and increase available quality jobs.
8. The Modernization Tax Credit program provides a 5% refundable state tax credit for manufacturers making capital investments to modernize or upgrade existing facilities in Louisiana.
9. The Motion Picture Industry Development Tax Credit provides a 30% tax credit on qualified motion picture expenditures with no project or program caps. Payroll expenditures for Louisiana residents qualify for an additional 5% tax credit (35% effective total credit rate).
10. The New Markets Tax Credit program encourages investment in urban and rural low-income areas to help finance community development projects, stimulate economic growth and create jobs.
Private-sector investors receive credit against federal income taxes. The program allows individual and corporate taxpayers to receive a credit against federal income taxes for making qualified equity investments in Community Development Entities, or CDEs. Credits can be obtained every year the investment is held, for up to seven years of the credit period.
11. The Quality Jobs (QJ) program provides a cash rebate to companies that create well-paid jobs and promote economic development.
OR
12. The Research and Development Tax Credit encourages existing businesses with operating facilities in Louisiana to establish or continue research and development activities within the state.
13. The Restoration Tax Abatement (RTA) program provides five-year property tax abatement for the expansion, restoration, improvement and development of existing commercial structures and owner-occupied residences.
14. The Sound Recording Investor Tax Credit program rebates a 25% refundable tax credit for qualified production expenditures for state-certified sound recording projects.
Source: Louisiana Economic Development Foundation
Kenner is like most zoning authorities in that they want to spell out in zoning ordinances exactly what is allowed, such as areas for blacksmithing, macaroni making, manufacturing of looseleaf paper, thermometers and wire brushes. Zoning codes also detail some silly permitted uses. This article compares the industrial zoning codes and clears up the confusion.
Kenner, Louisiana, has its own zoning ordinance-separate from Jefferson Parish. The three main industrial zoning codes are Light Industrial, Heavy Industrial Zoning, and also the Special Industrial Zoning Code. Kenner was developed in the late 1960's as residential and commercial growth expanded from Metairie and today the area has a population of 245,000.

Kenner Boundaries
The Kenner Warehouse Market is considered part of the larger suburban Jefferson Parish Sub-Market within the New Orleans Metropolitan Area. The suburban Jefferson Parish Sub-Market (±26,651,960 rentable square feet in 920 buildings) is divided into three sub-areas: Elmwood (±20,203,566 rentable square feet in 541 buildings), Kenner (±4,286,170 rentable square feet in 237 buildings), and North Metairie (±2,162,244 rentable SF in 142 buildings).
A survey conducted by The Real Estate Market Data Center & Center for Economic Development of the University of New Orleans in the first quarter of 2012 includes the following:

kenner industrial space for lease market share
Since Kenner has older industrial areas that grew out of nearby residential areas, the Special Industrial Zoning requires industrial businesses to make their sites attractive so they don't conflict with nearby residential properties. There is no storage allowed in the front yard, and a landscaped front yard of 20 feet is required. Permitted uses can be commercial as well as industrial, but the only two businesses with detailed restrictions are cocktail lounges and adult bookstores.. Signs must be a maximum of eight square feet and less than 30 feet high and buildings have a maximum height of 75 feet. There is no difference in parking and loading zone requirements however.
Zoning of Light Industrial areas still require uses to be controlled to make them compatible with nearby residential districts, and you still need a 20' yard, but storage outside is not restricted. Uses detailed in the zoning ordinance allow industries not seen in Louisiana in 75 years, but its good to know you can manufacture boots, looseleaf paper, watches, thermometers, wire brushes and macaroni (with city council approval). These specific industries in the zoning code must be a result of some very fine lobbying by someone long forgotten. The room for interpretation tends to slow down the permitting process, making development more expensive, which results in older structures not being put to their highest and best use. The end result is a lower tax base and less resources for schools and government services.
This zoning looks out for itself, with no regard to residential consideration. The purpose is to provide for all types of industrial uses, with the only detailed use not allowed being hazardous and obnoxious industries. Any use in the Light Industrial Zoning is also permitted except for residences. Specifically mentioned in this zoning code are permitted uses for cigar manufacturing (useful during WW2), junk yards, barge terminals and macaroni manufacturing (again). Buildings may have a height of 100' and now require a 30' front yard. The requirements for parking and loading are no more stringent than for Light Industrial and Special Industrial.
COMPARISON OF KENNER ZONING CLATEGORIES |
|||
| S-I Special Industrial | L-1, Light Industrial | H-1, Heavy Industrial | |
| Purpose | The purpose of this district is to provide sufficient space in appropriate locations for certain types of business and manufacturing relatively free from offense, in modern landscaped buildings and to make available more attractive locations for these businesses and industries. This district provides a transition area between associated land uses. Residential uses are excluded, except for overnight facilities for watchman and/or caretaker employed on the premises. | The purpose of this district is to provide for a wide variety of light manufacturing, fabricating, processing and other uses appropriately located near major streets or railroads for access and to control operations of industrial uses under such conditions to make them compatible with nearby commercial or residential districts. Residential uses are excluded, except for overnight facilities for watchman and/or caretaker employed on the premises | The purpose of this district is to provide for industrial operations of all types except that certain potentially hazardous or obnoxious industries are prohibited. Residential uses are excluded, except for overnight facilities for watchman and/or caretaker employed on the premises. |
| Permitted Uses | Upon council approval as per section 23.02, any use permitted in a C-2 District, except that cocktail lounges shall be located at least two hundred (200) feet from any residential property. Adult Bookstores upon city council approval. | Any use permitted in a S-I Special Industrial District. Truck Stop. Adult Bookstore. Boots, Looseleaf paper, macaroni on city council approval, watches, thermometers, wire brushes, etc. | Any use permitted in a L-I Light Industrial District except for residential dwellings. Adult Bookstores, blacksmiths, cigar manufacturer, macaroni manufacturer, junk yards, barge terminals. |
| Special Requirements | Landscaped front yard. | Hazardous or obnoxious uses and must be approved by the city council. | |
| No storage of materials in front yard. | |||
| Signs | Nonilluminated accessory signs as permitted in the RR-3 District except maximum height shall be thirty (30) feet above ground. | Signs max 35' high, as permitted in the C-2 District, except adult book/video stores and massage parlors which are not allowed to have descriptive art. | Signs max 35' high, as permitted in the C-2 District, except adult book/video stores and massage parlors which are not allowed to have descriptive art. |
| Height Restrictions | Maximum of 75'. | Maximum of 75'. | Maximum of 100'. |
| Yard Restrictions | |||
| Front | 20' | 20' | 30' |
| Side | None required unless abuts residential, then 10'. | None required unless abuts residential, then 10'. | None required unless abuts residential, then 10'. |
| Rear | None required unless abuts residential, then 20'. | None required unless abuts residential, then 20'. | None required unless abuts residential, then 20'. |
| Lot Area | 5,000sf | 5,000sf | 5,000sf |
| Loading Zone Requirements | Provided in Article XVIII. Warehouses require 1 space for each employee on the largest work shift plus 1 space for each company vehicle operating from the premises, 3 spaces minimum total | Provided in Article XVIII. Warehouses require 1 space for each employee on the largest work shift plus 1 space for each company vehicle operating from the premises, 3 spaces minimum total | Provided in Article XVIII. Warehouses require 1 space for each employee on the largest work shift plus 1 space for each company vehicle operating from the premises, 3 spaces minimum total |
| Off-Street Loading | 2,000sf-10,000sf requires one loading space, 10,000sf-20,000sf requires two, 20,000sf-40,000sf requires 3, 40,000sf-60,000sf requires 4, one additional for every 50,000sf over | 2,000sf-10,000sf requires one loading space, 10,000sf-20,000sf requires two, 20,000sf-40,000sf requires 3, 40,000sf-60,000sf requires 4, one additional for every 50,000sf over | 2,000sf-10,000sf requires one loading space, 10,000sf-20,000sf requires two, 20,000sf-40,000sf requires 3, 40,000sf-60,000sf requires 4, one additional for every 50,000sf over |
| Article 3, Appendix A-Zoning, Kenner Code of Ordinances | |||
| Yard: An open space other than a court at existing ground level between a buildable area and the adjoining lot lines, unoccupied and unobstructed by any portion of a structure from the ground upward except as otherwise provided herein. For the purposes of determining yard measurements, the least horizontal distance between a lot line and the buildable area shall be used. | |||
| Yard, front: A yard extending across the front of a lot between the side yard lines, and being the required minimum horizontal distance between the street line and the maximum permissible main building. On corner lots the front yard shall be considered as parallel to the street upon which the lot has its least dimension. | |||
copyright 2013, Louisiana Commercial Realty, LLC

pie chart revenue source
“A large part of the decrease in the federal grants revenue was due to the temporary nature of funding provided through federal stimulus money beginning in mid-2009,” said Lisa Blumerman, chief of the Census Bureau’s Governments Division. “The 2012 Census of Governments captures the third fiscal year since the beginning of the infusion of stimulus money.”
General revenues for state governments were $1.6 trillion in 2012, a 1.8 percent decrease from $1.7 trillion in 2011, according to the latest findings on state government finances from the U.S. Census Bureau. General expenditures by state governments fell 0.5 percent in 2012 to $1.6 trillion, down from $1.7 trillion in 2011. This is third time in the last four years that general expenditures have exceeded revenues.
A major contributor to the fall in general revenue was declining funding from federal grants. Federal grants to states totaled $514.2 billion, down 10.7 percent from $575.8 billion in 2011. (Federal grants make up 31.6 percent of states’ general revenue.)

states taxes and federal funding
Total revenue, which includes general revenues and social insurance trust revenue such as unemployment compensation funds, fell 15.6 percent to $1.9 trillion in 2012 (down from $2.3 trillion in 2011).
The findings are from the 2012 Census of Governments: Finance – Survey of State Government Finances, which shows revenues, expenditures, debt, and cash and security holdings for each state as well as a national summary of state government finances.

state unemployment expense and revenue
The decline in total revenue in 2012 was mainly due to the $323.0 billion decrease in social insurance trust revenue. Social insurance trust systems showed revenues of $263.7 billion in 2012, a drop of 55.1 percent from $586.7 billion in 2011. These systems are mainly composed of state employee retirement systems and state social insurance trust systems, including those for unemployment compensation and workers’ compensation.
SGF001: Louisiana vs. United States Government Finances: 2012 |
||||||
| 2012 Annual Survey of State Government Finances | ||||||
| State Government Finances: 2012 (Amounts in thousands) |
||||||
| Item | United States | Louisiana | ||||
| Total Revenue | 1,912,253,172 | 26,942,887 | ||||
| General Revenue | 1,627,804,381 | 25,336,717 | ||||
| Intergovernmental Revenue | 533,699,688 | 11,213,427 | ||||
| From Federal | 514,181,193 | 11,136,334 | ||||
| From Local | 19,518,495 | 77,093 | ||||
| Total Taxes | 798,221,675 | 8,994,053 | ||||
| General Sales and Gross Receipts Taxes | 245,316,442 | 2,815,919 | ||||
| Selective Sales and Gross Receipts Taxes | 132,225,287 | 2,072,935 | ||||
| License Taxes | 54,090,961 | 402,212 | ||||
| Individual Income Taxes | 280,672,114 | 2,474,606 | ||||
| Corporation Net Income Taxes | 41,982,048 | 290,389 | ||||
| All Other Taxes | 43,934,823 | 937,992 | ||||
| Current Charges | 172,925,777 | 2,705,838 | ||||
| Miscellaneous General Revenue | 122,957,241 | 2,423,399 | ||||
| Utility Revenue | 13,616,484 | 7,269 | ||||
| Liquor Stores Revenue | 7,114,248 | 0 | ||||
| Insurance Trust Revenue (1) | 263,718,059 | 1,598,901 | ||||
| Unemployment Compensation Systems | 80,109,746 | 273,116 | ||||
| State-Administered Pension Systems | 160,510,446 | 1,021,648 | ||||
| Workers' Compensation Systems | 15,526,364 | 65,446 | ||||
| Other Insurance Trust Systems | 7,571,503 | 238,691 | ||||
| Total Expenditure | 1,976,789,593 | 31,685,604 | ||||
| Intergovernmental Expenditure | 481,204,347 | 6,387,767 | ||||
| Direct Expenditure | 1,495,585,246 | 25,297,837 | ||||
| Current Operations | 986,417,347 | 17,541,289 | ||||
| Capital Outlay | 117,741,012 | 2,435,093 | ||||
| Insurance Benefits and Repayments | 301,460,223 | 3,920,302 | ||||
| Assistance and Subsidies | 40,079,600 | 497,590 | ||||
| Interest on Debt | 49,887,064 | 903,563 | ||||
| Exhibit: Salaries and Wages | 250,994,694 | 4,230,457 | ||||
| General Expenditure | 1,645,819,643 | 27,760,070 | ||||
| Intergovernmental General Expenditure | 481,204,347 | 6,387,767 | ||||
| Direct General Expenditure | 1,164,615,296 | 21,372,303 | ||||
| General Expenditure, by Function: | ||||||
| Education | 588,708,137 | 8,998,450 | ||||
| Public Welfare | 489,201,919 | 6,300,387 | ||||
| Hospitals | 68,547,769 | 1,949,705 | ||||
| Health | 61,243,727 | 567,016 | ||||
| Highways | 113,552,361 | 1,922,374 | ||||
| Police Protection | 14,251,739 | 368,657 | ||||
| Correction | 48,438,866 | 729,887 | ||||
| Natural Resources | 21,933,708 | 705,161 | ||||
| Parks and Recreation | 5,640,062 | 336,734 | ||||
| Governmental Administration | 52,826,730 | 895,022 | ||||
| Interest on General Debt | 47,326,011 | 903,563 | ||||
| Other and Unallocable | 134,148,614 | 4,083,114 | ||||
| Utility Expenditure | 23,902,016 | 5,232 | ||||
| Liquor Stores Expenditure | 5,607,711 | 0 | ||||
| Insurance Trust Expenditure | 301,460,223 | 3,920,302 | ||||
| Unemployment Compensation Systems | 95,317,830 | 524,806 | ||||
| State-Administered Pension Systems | 188,413,250 | 3,218,454 | ||||
| Workers' Compensation Systems | 10,923,109 | 44,558 | ||||
| Other Insurance Trust Systems | 6,806,034 | 132,484 | ||||
| Debt Outstanding, Long Term and Short Term | 1,147,933,947 | 15,415,488 | ||||
| Cash and Security Holdings | 3,682,741,156 | 54,756,719 | ||||
Source: U.S. Census Bureau, 2012 Census of Governments: Finance - Survey of State Government Finances.
Yes there is a National Research Center. They partnered with Ohio State to study how analysts' earnings changes affected stock performance. Bottom line is if market is in the dumps, poor earnings estimates by analysts don't affect stocks as much as when in a up market.
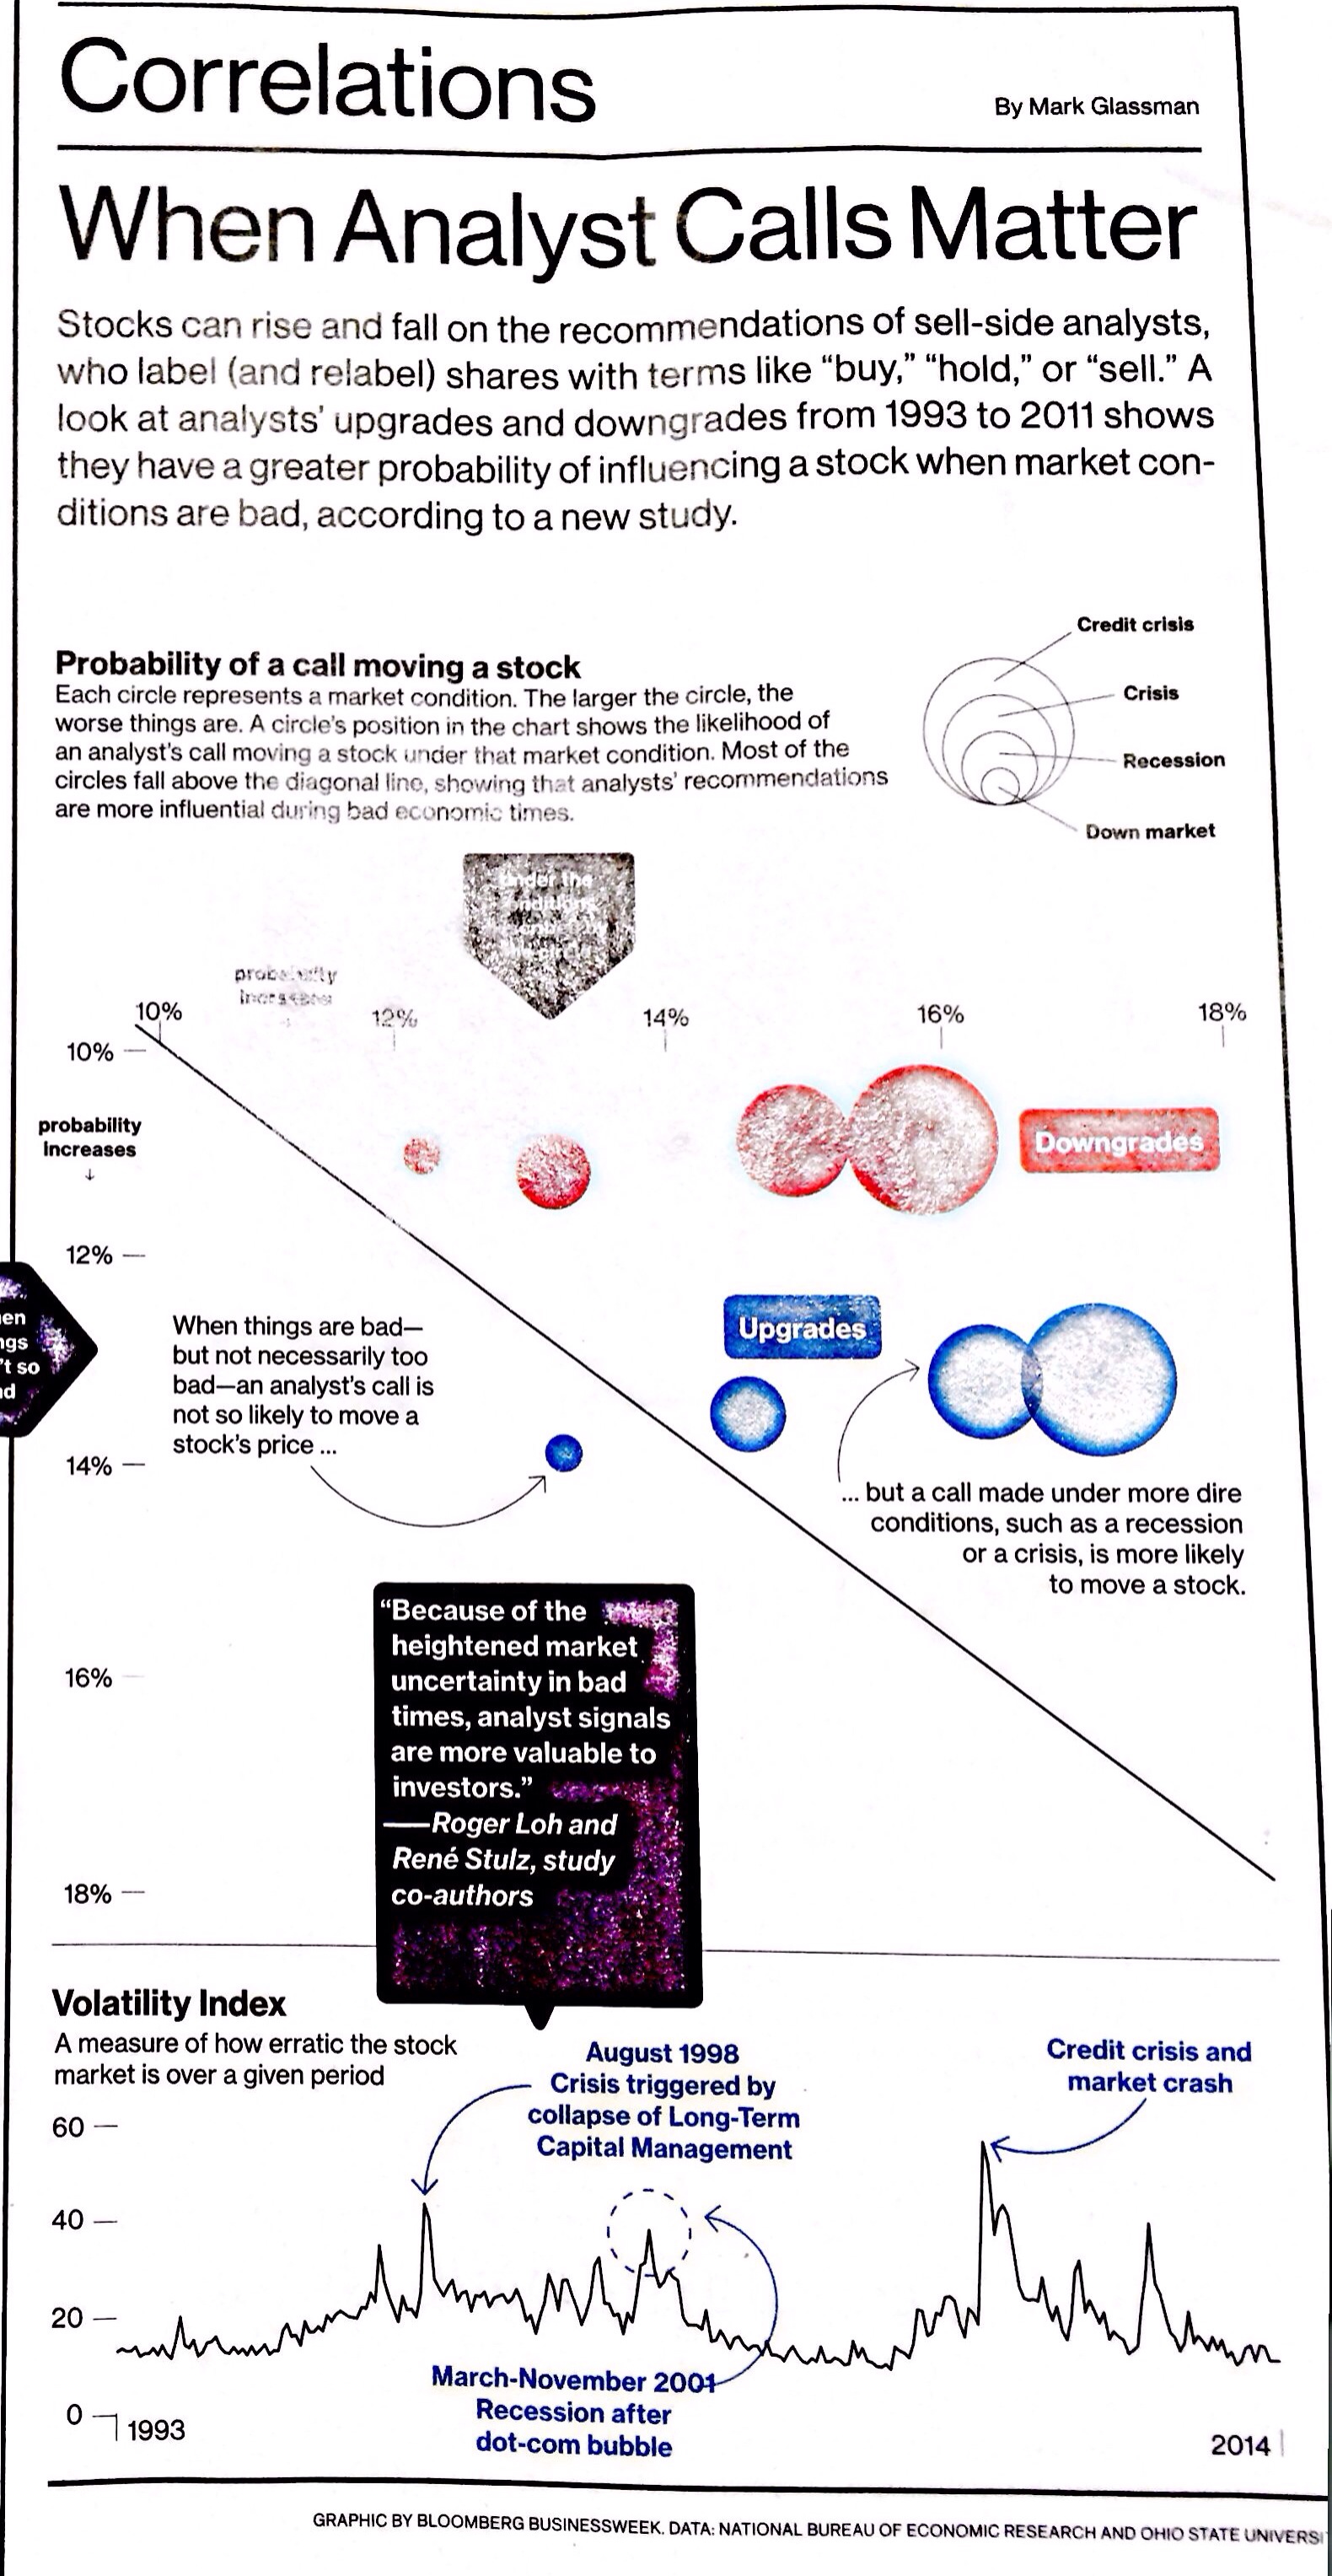
METAIRIE – Bedico Creek, a golf and country club development in Madisonville, is back on the market because of foreclosure, said Robert Hand, president of Louisiana Commercial Realty who was marketing the property.

Robert Hand, president of Louisiana Commercial Realty
Sealed bids are due Nov. 28. The 938-acre site south of Interstate 12 on Highway 1085 was in the middle of development when it went into foreclosure. The property includes a 211-acre partially completed golf course, 45 improved lots on 63 acres, 10.8 acres for commercial development, 317 undeveloped residential acres with 823 additional lots approved, 1.6-acre sewer treatment plant and water well and 334 acres wetland conservation easement. Nine holes of the golf course, constructed by SEMA Golf, are completed.
Residential lots were completed in two phases. Phase 1-A includes 59 lots, of which 42 were sold to developers who constructed homes in the $400,000 to $800,000 price range. Phase 1-B includes 50 lots, of which 22 were sold to developers. The phases have public utilities, natural gas and telephone service. Water and sewage are provided by a private well and sewage treatment facility.

Bedico Creek November 2009

931 Canal Street
A former condo project along the Canal Street corridor is being converted into what the developer calls an “upscale boutique” hotel. The eight-story structure at the corner of Burgundy Street next to the Ritz Carlton will become the 180-room Hotel Indigo.
Louisiana Commercial Realty president Robert Hand, announced the finalized sale of 931 Canal St. to Mark Wyant for an undisclosed amount today. According to an online flier published in July, the property was appraised and listed for sale at $7.85 million. Published reports indicate it sold for $5.5 million.
Originally built in 1909 and known as the Audubon Building, the 131,000-square-foot layout will include a fitness center, Phi Bar & Bistro, and an on-site casual gourmet restaurant. Previous plans to turn the property into a Hilton hotel never materialized.
According to a release from Louisiana Commercial Realty, the foreclosed property had been vacant for more than three years when the company began marketing the property in last July. Wyant reportedly qualified for between $3 million and $5 million in state and federal credits to complete the purchase as a result of the building’s historic status.
Grocer Charles Ciaccio says he has signed a lease to open a store at the defunct Lake Terrace Center, a key commercial intersection in Gentilly. Residents who live near the site at Robert E. Lee Boulevard and Paris Avenue have been frustrated with its dilapidated state, but the deal is notable even if Ciaccio’s store never opens.
It shows that, in at least one circumstance, a landlord and grocer can agree to terms in an underserved area of New Orleans. That’s notable in a city where 53 percent of the neighborhoods contain “food deserts,” according to a 2010 study by Social Compact, a national nonprofit business coalition. The study is the most recent to analyze food barriers for New Orleans residents.
Diagnosing New Orleans’ food barriers is impossible in certain terms, but speaking with grocers and developers suggests a fundamental disagreement over property values.
David Smith, director of merchandising and marketing for Associated Wholesale Grocers, said members are complaining that prices are detached from reality, whether negotiations pertain to lease or purchase deals. That’s especially true in eastern New Orleans, where landowners are consistently demanding pre-Hurricane Katrina prices and more, Smith said.
“I don’t know if they in their right mind have just convinced themselves their property is worth more,” Smith said. “If nothing has actually sold or nothing has actually leased in many, many years and everybody else is asking a high price, you might likewise set your asking price very high.”
Wade Verges, a developer in eastern New Orleans, said he’s aware of the complaints, but that proprietors are undervaluing the area’s potential. People are looking for steals, he said.
“When they realize the East is a viable market and they can’t steal, then they say everybody wants too much money,” Verges said.
A Lake Terrace store would serve multiple food deserts the Social Compact study identified, but Gentilly doesn’t suffer the same dearth of grocery stores as eastern New Orleans, where one major store serves 64,310 people. Demand for a grocery store in eastern New Orleans outpaces supply by 64.2 percent when measured in retail potential versus sales, according to a retail feasibility study conducted by Robert Hand with New Orleans based Louisiana Commercial Realty.
Market values in eastern New Orleans are hard to determine, Hand said, because of the array of available land, which comes with and without structures in all kinds of conditions. Hand knows sellers who are asking pre-Katrina prices, but he also points to data showing that land sales in the area are occurring at about 84 percent of their list price, which he said is reasonable.
“Are prices in New Orleans East too high? That depends,” Hand said. “It’s not answerable, because compared to what?”
Much more needs to happen before a store opens at Lake Terrace Center. Ciaccio said lease payments won’t begin until property owner Kenneth Charity completes interior and exterior improvements, after which time Ciaccio would build 14,000 square feet of grocery space.
Charity received scrutiny in January 2010 when local news organization The Lens reported he had not made any progress at Lake Terrace after receiving $162,500 in economic development grants from former Mayor Ray Nagin’s administration.
Charity did not return calls for comment.
Ciaccio is not the only grocer who says he has worked with Charity on opening a grocery store. Carlo Coniglio, who operated Meme’s Market at Canal Boulevard and Robert E. Lee for 20 years before Katrina, said Charity reached out to him about three years ago, shortly after Charity paid $1.35 million for Lake Terrace. Coniglio said Charity asked for $25 a square foot, which he regarded as outlandish.
Ciaccio declined to discuss dollar amounts in his lease with Charity.
Ciaccio said he is seeking assistance from the city’s new Fresh Food Retail Initiative, a public-private partnership that offers low-interest and forgivable loans to grocers who open in underserved areas. Ciaccio said he has been watching the program for about a year but could have fashioned a deal at Lake Terrace without it.
Karen Parsons, president of the Oak Park Civic Association, credits the new incentive program for making it economically feasible to redevelop Lake Terrace, which is within her association’s boundaries. Charity “overpaid for the property in the post-Katrina market,” an error that, combined with the costs of rebuilding, has prevented an anchor tenant such as Ciaccio from signing on, she said.
“It’s very difficult to make all of that work from a business profit model,” Parsons said.
CityBusiness has announced its 2012 Money Makers honorees, recognizing 50 financial professionals whose fiscal work, accomplishments and achievements have not only set the pace for their company but the regions as a whole.
INVESTMENT
Leonard Alsfeld
Mary Margaret Brewer
David Capo
Don Celestin Jr.
Jack Dardis
Emmett Dupas
Octave Francis
Robert Hand
Ralph Leopold
Geary Mason
Cham Mehaffey
Tom Meyer
John Morgan
Rudy Revuelta
Howard Rodgers
Lain St. Paul
Jonathan Stewart
Diana Stieffel
Randy Waesche
George Young
BANKING
Brad Calloway
Judy DeLucca
Marlene Laboureur
Christopher Maurer
Alton McRee
Mignhon Tourne
Mark Rosa
Donald Washington
Stephen Wessel
CORPORATE
Alita Caparotta
Lew Derbes
David Fried
James Harp
Beth Johnson
Mark Joslin
Mary Lavalla
Christian Stuart
Steven Toups
PROFESSIONAL
Gary Bell
Scott Dessens
Gus Flattmann
Fred Johnson Jr.
Robert Kimbro
Shasta Leininger
Sandy Marlbrough
Ted Mason
Philip Rebowe
Allen Villarrubia
Ellen Yellin
Honorees will be recognized at an Oct. 10 luncheon at noon at the Ritz-Carlton New Orleans and in a special insert in the Oct. 12 issue of CityBusiness.
At least one broker believes the owner of the Canal Street Plaza Hotel is asking far too much to sell the property.
Robert Hand said multiple clients have submitted offers, most recently last month, but the offers have not been entertained. Suites at New Orleans LLC is asking $8 million after lowering its price twice since October, when it was listed at $10.5 million. Hand said his clients have since moved on.
Hand did not disclose his clients’ identities or offers, but he said the property is worth about $4.5 million based on potential operating revenue.
U.S. Hotel Appraisals valued the property at $9.8 million in March 2011, although the appraisal assumed the building is fully compliant with public safety laws. Hand said the building needs a new sprinkler system to meet fire codes, violations of which resulted in the city closing the hotel three years ago.
The sprinkler system would cost between $500,000 and $1 million, Hand said, adding that the building needs roughly $3.5 million in overall investment to open as a $75-per-night hotel. The appraisal calls for capital investment of $232,000 in minor renovations.
Listing agent Matt Galafaro acknowledged the building needs work to become code compliant but said the current asking price reflects the needs.
Hand’s estimation of the market value is naturally skewed in his client’s favor, Galafaro said, adding that an assumption of $75 per night does not factor the nearby LSU/VA hospital developments. Rates will “skyrocket” after 2015 when the hospitals are complete, he said.
“The buyer is obviously trying to acquire the property for as little as possible,” Galafaro said.
More than $900,000 in back taxes are owed on the property, though Galafaro said this would be cleared prior to closing.
NOTE: After this article appeared online, city spokesman Ryan Berni explained that the hotel was closed for delinquent property taxes, and a subsequent multi-agency inspection turned up a list of code violations that would need to be addressed before it could reopen. Nola.com reported at the time that a Orleans Civil Court judge permitted the city to proceed with turning off utilities as a result of code violations. Former Mayor Ray Nagin’s administration issued a statement one day before the nola.com report urging the owners to close voluntarily because of unsafe conditions, and threatening to pursue “all legal remedies” if they did not comply.
Office and retail space in the New Orleans region is moving with increased frequency, and many of the properties changing hands through sales and leases have lingered on the market for greater-than-normal periods of time, according to data provided by Louisiana Commercial Realty.
It suggests deep-pocketed speculators and other investors are diving into the distressed property market, which is a healthy sign for the local economy, Louisiana Commercial Realty owner Robert Hand said.
“These properties are not loved,” Hand said. “They are blighted properties that require lots of attention, maybe they are in a tough neighborhood. But somebody recently has come along and decided to speculate. Normally the banks won’t loan money for speculation. This tells us you probably have people with deeper pockets that have more equity.”
The average commercial property sold or leased in the New Orleans area in October had been on the market for more than 516 days, 50 percent longer than the average over the prior 12 months. The number of listings in the commercial sector also increased in October from 359 to 404.
Office listings also spiked last month, from 839 to 958. There were 23 office leases and sales, and they had been on the market an average of 637.4 days – nearly tripling the number of days of the previous month’s sales and leases. The asking lease and sales prices for office space were 3.7 and 4.5 percent below the 12-month average, respectively.
That suggests deep-pocketed speculators and other investors are diving into the distressed property market, which Louisiana Commercial Realty owner Robert Hand considers a healthy sign for the local economy.
He dissected the data in a November 16 conversation with CityBusiness.
Can speculation be a problem if it’s just speculation only? It’s a healthy sign. What I am deducing is that these properties that have been on the market almost twice as long as normal is that these properties are not loved. They are blighted properties that require lots of attention. Maybe they are in a tough neighborhood.
But somebody recently has come along and decided to speculate and buy these things that previously were difficult properties. If they weren’t difficult properties, they wouldn’t have been on the market for very long. If we can rule out whether they were overpriced — and none of these that were transacted were overpriced compared to the last 12 months — that shows a healthy commercial market. It shows a healthier economy.
The asking office lease rate is dropping. Are lease rates simply dropping enough that they are stimulating movement? The properties that sold or leased were transacted at 15 percent below the list price, which is about average of what we’ve seen the last 12 months. The only unusual thing is the
properties that were sold recently were on the market a lot longer than normal.
If you look at the asking lease price, it was $16.74 versus the last 12 months at $17.39. So of the properties that were leased or sold, it doesn’t appear they were overpriced. The lease and the asking price were both under the average.
Retail listings are up, as are days on the market for those sold or leased. Does this mean that space not previously in demand is moving because retail is expanding? People want the low-hanging fruit first. When property on the market for a long time finally starts being leased or sold, it means that speculators are coming into the market. That’s really a healthy sign.
People are willing to take risks. Normally the banks won’t loan money for speculation. This tells us you probably have people with deeper pockets that have more equity. They are willing to buy those blighted properties that up until now they weren’t.
Industrial property listings are increasing. Is it a buyer’s or seller’s market in the industrial sector? I still think it’s a buyer’s market in the industrial sector because you still have a lot of what I call elasticity. Of the additional supply that comes on the market, how does that affect price? What we are seeing people looking to buy and lease is still pretty price sensitive.
The average property leased in the industrial sector leased for $4.59 a square foot, which is down almost 50 percent from the 12-month average, which was $6.18 a square foot. Some of that depends on the area. Elmwood is $6, Mid-City is $4.50 and New Orleans East is $2.50. But on average what we saw recently was industrial properties that were leased at prices below the last 12 months.
There’s more vacant land available, both in the number of listings and millions of square feet. The days on the market are much fewer. What does that tell us? It’s not really a seller’s market because the prices are not higher than normal. Of the properties that were sold, they were sold 24 percent below the list price. Sometimes it’s just because land is hard to value.
It really depends on what you are going to use it for. You can have somebody that is going to put it in the gas station that makes it highly profitable, and they are willing to pay more for it than someone who is going to put in a parking lot.
Business owners along Tulane Avenue are optimistic that the 2-mile stretch between Carrollton and Loyola avenues is primed for redevelopment, with two billion-dollar hospital complexes on the rise and a $10 million streetscape project set to begin early next year.

2424 Tulane Avenue
Some Mid-City business owners are pushing for stronger code enforcement targeting motels along Tulane Avenue as construction of the University Medical Center and Veterans Affairs Hospital is expected to enhance development. But commercial real estate professionals say progress will be slow in coming.
Robert Hand, owner of Louisiana Commercial Realty, a brokerage firm that has been involved in several major real estate deals along Tulane Avenue, said limited inventory and an increase in demand have sent property values soaring along the corridor. Prices per square foot have jumped from $8 to $10 in 2007 to more than $40 in some areas today.
“There are property values on Tulane Avenue that are higher than parts of Veterans Boulevard in Metairie,” Hand said. “There was a time where no one wanted to buy anything out there. Now we have speculators coming in looking for places for new retail and multifamily complexes, which will be the biggest need.”
While demand for property is still high, Hand said higher prices will likely whittle out weak developments.
“It is going to take someone with a vision and a healthy bank account,” he said. “But that’s not to say people aren’t looking.”
Commercial real estate agents in the New Orleans area say the Metairie and Central Business District office markets will strengthen in 2014 as occupancy rates and average rents continue to increase in both areas.
Robert Hand, broker and owner of Louisiana Commercial Realty, said CBD office space remains a coveted commodity and available property is leaving the market at an increasingly quick pace.
“Toward the end of 2013, office space in Orleans Parish leased and sold faster than ever before,” said Hand. “Average days on the market plummeted from 274 days at the end of 2012 to 35 days at the end of 2013.”
Hand’s figures also noted a 54 percent increase in office property for sale in the CBD from 600,000 square feet available in 2012 to 922,000 available at the end of 2013. The additional space could start to pull tenants from Jefferson Parish, where occupancy rates and average rents are much higher, he said.
“Over the next couple of years, there is going to be much more demand for office space in Orleans Parish than there already is,” Hand said. “The CBD market is becoming a living community with residences and other amenities opening at a growing pace.”
Hand spent the closing months of 2013 analyzing the Orleans and Jefferson office sectors as part of his efforts to market a 75,000-square-foot space available for sublease at 1250 Poydras St. The space, which covers four floors in the building, has been available since 2010 after oil and gas company ENI left the city for Houston.
“It’s the largest block of space currently available in the city, and it is located right in the middle of the CBD,” Hand said. “My goal is to get a digital media or tech company into the space.”
According to Hand’s research, 1250 Poydras is one of only seven class A properties in the CBD with available office space exceeding 17,000 contiguous square feet. Lease rates range from $16.50 to $18.50 per square foot.
“Rates are on the rise in the CBD, but you are still getting somewhat of a bargain when you compare it to the more than $23 per square foot rate in Metairie,” Hand said.
Bruce Sossaman, leasing director for Corporate Realty, compiles his own office trends data. His information shows class A occupancy in the CBD grew from 85 percent in 2012 to 88 percent at the end of 2013, with a pair of major leases buoying those figures.
“In the fall, Shell Offshore, one of the city’s largest tenants, renewed its 10-year lease of more than 600,000 square feet of office space in One Shell Square two years early,” Sossaman said. “The company’s Gulf Coast headquarters will remain in the city through 2026.”
Also in 2013, the engineering firm URS moved from its headquarters at 600 Carondelet St., a class C building, into a space exceeding 42,000 square feet on the top two floors of 1515 Poydras St.
Sossaman said the URS upgrade is part of a trend he expects the city will see more of in 2014, with local and national companies starting to look for higher-quality properties.
“The last high-rise offices were built in the late 1980s, and the stock is starting to get old,” Sossaman said. “In the coming years, building owners are going to start improving what they have to attract new tenants. Available land remains a barrier of entry, and rents are not nearly high enough to spur any new office development. Residential conversions will continue to be the highest and best use for vacant property.”
One property ahead of the renovation trend is Lakeway Center in Metairie, where the ownership group recently renovated offices and installed new elevator systems in all three buildings. Sossaman said tenants are willing to pay more to have those types of amenities.
Sossaman said that although average rents in the CBD continue to be lower than those in Metairie, it is too early to say whether the city is pulling demand away from Jefferson Parish. He said the great equalizer will always be parking.
“That is a premium tenants will get in Metairie that they won’t always get in the CBD,” Sossaman said. “When you factor in the parking spots needed per 1,000 square feet leased in the CBD, price per square foot can increase by as much as $7.”
Reporter Robin Shannon can be reached at robin.shannon@nopg.com or @LSURob504
A Realtor trying to sell the largest apartment-zoned property in the metropolitan area said a new housing complex is just what eastern New Orleans needs to help bring businesses back to the area.
The only problem is those already living in the area are more concerned with apartment buildings that are still unoccupied and in disrepair since Hurricane Katrina.
Tangee Wall of the Eastern New Orleans Neighborhood Advisory Commission said residents want more businesses and less multifamily housing in the area.
“A desire for our community would be to have businesses and community gardens (at the site),” Wall said.
The area already has an ample stock of apartment buildings, many of which are blighted.
“There are some that are in imminent danger of collapse and … those need to be demolished,” she said.
Robert Hand, an agent with Louisiana Commercial Realty, is listing the 10.2-acre site at Interstate 10 and Read Boulevard for $1.42 million. An empty concrete field is all that’s left of what used to be the Bern-Mas Apartments, which was destroyed during Katrina.
Hand insists eastern New Orleans residents are not necessarily against his project but the continued presence of blight, which consists mostly of abandoned apartment buildings in the area.
“The people in New Orleans East are not proponents of apartments because they don’t want to see dilapidated buildings,” Hand said. “So the real question that residents need to ask themselves, is do they want a vacant piece of land with tall grass where people will go and dump their trash, or do they want sparkling apartments that will bring people back?”
According to Hand’s analysis, there are 10 other apartment complexes ranging in size from 200 to 350 units within a five-minute drive of his property. Many of the apartments are Section 8 housing designated for low-income tenants receiving government subsidies.
Just west of the Bern-Mas site are the Worthy Place Apartments, a group of light-colored and nondescript rectangular structures. It and several other apartment buildings throughout eastern New Orleans have signs advertising vacancies. On nearby Cindy Place Drive, the streets are lined with empty and boarded-up apartment buildings, some of which are being gutted and many of which are in ill repair.
Coldwell Bankers Realtor Graham Little lists two of the properties. The 60-unit buildings, listed for $499,000, are fixable and will not be torn down, he said.
“We’re working with a number of developers now that can renovate the property,” Little said.
Apartment occupancy in eastern New Orleans was 80 percent according to the spring Greater New Orleans Multi-Family Housing Report from Madderra and Cazalot, Larry G. Schedler and Associates Inc. and the MultiFamily Advisory Group.
With available inventory and more construction proposed, the potential for an apartment glut has caught the attention of District E City Councilman Jon Johnson, who says multifamily housing in the area is not a priority.
“I think the push now is more toward single-family housing more than anything else,” he said.
Estimating the area’s population now at 65 percent to 75 percent of pre-Katrina levels, Johnson said his district still faces “basic family needs” such as schools, libraries, parks and grocery stores.
Hand said similar deals he has brokered in the past have spurred commercial development around them. He points to The Preserve and Crescent Club in Mid-City and the Marquis Apartments on Poydras Street. All three were built on the site of vacant commercial properties.
“These are developments that worked,” he said.
He said businesses are starting to come back to the area, and more will follow as new and renovated apartment projects are built. He points to the former Lake Forest Shopping Center and the redevelopment of Methodist Hospital.
In July, Mayor Mitch Landrieu announced plans to buy the Methodist Hospital site for $16.25 million and to have a medical facility open its doors there within three years.
Hand also noted current construction of the $39.7 million Village de Jardin project. The 224-unit mixed-use senior housing center between Lake Forest Boulevard and Interstate 10 is expected to be complete in about six months.•
The commercial real estate market in Orleans Parish is currently 3.1 million square feet for lease and 3.7 million square feet for sale with a sale price of 266 million. The office category comprises the largest sector at approximately 50% of the space for sale or lease, followed by retail, shopping centers, industrial, land and multi-family with the smallest supply on the market.
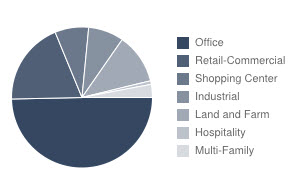
orleans market pie
The statistic that sticks out is the Days On The Market, which is a leading indicator of the strength of the market. The office sector which normally averages 274 days on the market shows a dramatic shift to 35 days an the market. The latest office sector sale averaged $65PSF, a 15% discount from the 12 month average, and the latest lease averaged $12.90 PSF, a 20% discount from the $15.98 PSF average the last 12 months. The table below shows the data for the Orleans Parish market.

orleans parish market
Average asking sale prices range from a low for industrial sector property at $33 PSF to a high of $107 for shopping center property, which follows the premise of Cap Rate, in that a property is valued at a multiple of the income, and more specifically should be the present value of future income streams, adjusted for risk. Lease rates range from a low on industrial property of $3.84 PSF to a high of $15.90 PSF on office property. The retail sale price is a higher multiple of lease rates than office space since retail sometimes includes a percentage of sales and office space often includes free rent and tenant improvement expenses.
Sources: wwwlouisianacommercialrealty.com, LACDB
![]() The best way a business can stay competitive is to utilize incentives offered by state and local governments. Louisiana offered tax credits to the movie industry several years ago and the result was a subsequent explosion in movies made here and a boost to the economy from payroll and visibility driving demand toward our tourism industry.
The best way a business can stay competitive is to utilize incentives offered by state and local governments. Louisiana offered tax credits to the movie industry several years ago and the result was a subsequent explosion in movies made here and a boost to the economy from payroll and visibility driving demand toward our tourism industry.
In Louisiana, tax credits were targeted to filmmakers, and by the end of the 2000's, the incentives helped establish Louisiana as the #3 U.S. movie production market. In 2005, Louisiana extended tax credits to video game developers in the state. State leaders recognized that digital entertainment held the potential to create even more permanent jobs than movies, and a 2009 law extended the reach to software development in general, with a 35 percent refundable tax credit in Louisiana-based payroll and a 25 percent refundable tax credit on software product costs.
Louisiana offers the highest incentives for digital media in the country, and the tax rebate of 35% of expenses means that if a software company employs engineers at a salary of $100,000 annually, the company will receive a rebate check for $35,000 from the state of Louisiana.
In February of 2012, Brackett Denniston, GE senior vice president and general counsel, joined state and local leaders to announce the creation of the GE Capital IT Center of Excellence in New Orleans. “We took our time to select a location for this important center,” said Denniston. “We looked all over the country but, after much consideration, New Orleans rose to the top of our list.” The center will be home to 300 high-quality technology jobs and serve as a major resource for GE Capital employees across the nation. Executives announced GE Capital will occupy 60,000 square feet of office space in the New Orleans Central Business District.


On August 15, 2011, Gameloft announced it would open a game development studio in New Orleans and deliver at least one new game title developed entirely at the studio in its first year. Employment will grow to nearly 150 jobs at the New Orleans studio in the next few years, with pay averaging more than $60,000, plus benefits.
In 2012, the Electronic Arts moved into the newly-constructed 94,000-square-foot Louisiana Digital Media Center on the LSU main campus. EA now employs nearly 500 workers during the school year. In addition to the LSU students who serve in part-time positions at the center, EA has had success recruiting others in the Baton Rouge area to test children's games and casual games more popular with adult women. Game testers at the center in Baton Rouge coordinate work on a daily basis with studios across the globe, including facilities in Stockholm, London and Bucharest.
"This public-private partnership with LED, IBM and LSU is a powerful example of the triangulation between industry, government and academia that elevates the state's role as a national leader in economic development," said LSU College of Engineering Dean Richard Koubek. "LSU's College of Engineering is committed to developing a mutually beneficial partnership with IBM and LED that stimulates economic growth and helps to meet the workforce development needs of the state."
In addition to long-term workforce solutions, LED offered the company a $17 million grant to reimburse relocation, recruitment and internal training costs; a $5.5 million incentive equivalent to the state's Quality Jobs program for a portion of the IBM center's employment over 10 years; a $5 million grant to offset facility operating costs over 10 years; and the recruitment, screening and training services of LED FastStart®.
LED offered a $30.5 million performance-based grant consisting of state, local and federal funding to build an eight-floor office building as part of a new, mixed-use urban development on Baton Rouge's riverfront. In addition to new Class A office space and 600 dedicated parking spaces, the development would include an 11-floor residential tower and a private recreational terrace joining the buildings above a multilevel parking garage. Leveraging resources of the Baton Rouge Area Foundation, Louisiana secured BRAF’s commitment to build and manage the $55 million total project through its affiliates, the Wilbur Marvin Foundation and Commercial Properties Realty Trust.
Gigaom, with 5.5 million readers, researches and publishes a list of the top ranked digital media companies:
Google
Yahoo
Apple
Microsoft
Netflix
IAC
AOL
News Corp
AT&T
Facebook
Sony
Walt Disney
NBC Universal
CBS
Gannett
Zynga
Cox Enterprises
Activision Blizzard
Universal Music Group
Viacom
CareerBuilder
WebMD
Monster Worldwide
National Football League
Time Warner
Groupon
Major League Baseball
Warner Music
Electronic Arts
New York Times
Hearst
Classified Ventures
Advance Publications
ValueClick
Yell Group
QuinStreet
Adknowledge
GameStop
ReachLocal
eHarmony
SuperMedia
Hulu
Demand Media
Tribune
Ancestry.com
FriendFinder Networks
McClatchy
LinkedIn
United Online
Digital companies can be identified by the NAICS codes 511210 for software, 512191 for video post-production, and 519130 for Internet publishing. The North American Industry Classification System (NAICS) is the standard used by federal statistical agencies in classifying business establishments for the purpose of collecting, analyzing, and publishing statistical data related to the U.S. business economy. NAICS was developed under the auspices of the Office of Management and Budget (OMB), and adopted in 1997 to replace the Standard Industrial Classification (SIC) system.
Sources: www.louisianacommercialrealty.com, Census Bureau, Gigaom
Three trends emerged in the commercial real estate office market in the New Orleans area in 2013.
The available supply of office space for lease in Orleans Parish is 2.7 million square feet, with 1.8 million square feet for lease and 922,000 square feet for sale. There are 366 active properties with an average asking lease rate of $15.90 per square foot and actual lease rate average of $12.90 per square foot and average sale price of $65 per square foot. The amount of office space in Orleans Parish currently for lease is the same as the average the last 12 months at 1.8 million square feet, down from 1.7 million square feet on average the last 24 months. The amount for sale has increased 54% to 922,000 square feet, from an average 597,000 square feet the last 12 months and 662,000 square feet the last 24 months. The strength in demand is most visible in the days on the market, which averaged 35 days the last months, compared to 274 days the last 12 months and 296 days over the last 24 months.
With 1.8 million square feet supply in leasing space about the same as the average the last 12 months, and leased prices shrinking almost 20%, the shortened days on the market tells us that there is price elasticity in the leasing market, meaning as prices drop, there is an increase in demand, assuming supply is constant. Some markets are not as elastic, such as in Kenner or New Orleans East, meaning that a reduction in price does not bring increased demand. These markets are more inelastic.
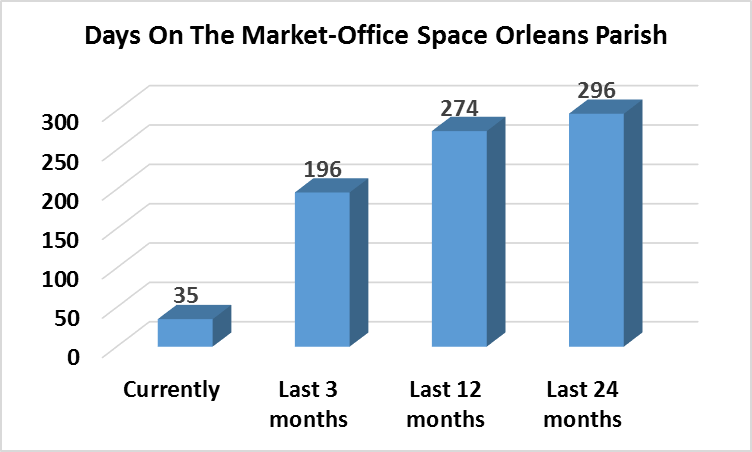
days on the market -office space Orleans Parish
There is currently 1.4 million square feet of available office space in Jefferson Parish, with 891,000 square feet for lease at an average asking price of $17.25 per square foot and actual lease rate of $15.07 per square foot, and 539,000 square feet for sale at an average asking price of $101 per square foot and actual sale price of $91 per square foot. The supply of office space for lease has plummeted 41% to 891,000 square feet from 1.5 million square feet on average the last 12 months. The supply of office space for sale has increased 26% to 538,000 square feet from 425,000 square feet on average the last 12 months. The trend toward more properties for sale is due to the strengthening of prices, which causes property values to rise and owners selling to take advantage of the increased prices, with the resulting increase in square footage of office space for sale. Another trend is a result of the 41% decline in leasing square footage available, causing lease asking prices of $17.25 per square foot, higher than the 12 month average of $17 per square foot and the $16.93 per square foot on average the last 24 months.
Office leasing in Orleans Parish is pulling demand from Jefferson Parish, as a result of competitive pricing averaging actual lease rates of $12.90 per square foot, compared to $15.07 per square foot. Demand is high in Orleans Parish for lease and sale of office space, as evidenced by the 90% drop in days on the market over the last 12 months.
Sources: www.louisianacommercialrealt.com, LACDB
Employment in Louisiana for the 12 months ending October 2013 grew from 1,935,700 to 1,966,500. The table below shows the states with statistically significant employment changes, seasonally adjusted.
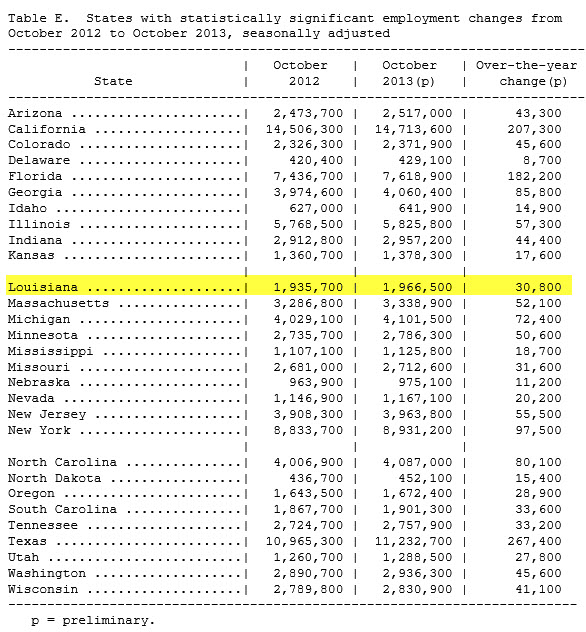
employment october 2013 LA
In October, the West continued to have the highest regional unemployment rate, 7.8 percent, while the South had the lowest rate, 6.9 percent. Over the month, only the South had a statistically significant unemployment rate change (-0.1 percentage point). Significant over-the-year rate changes occurred in three regions: the West (-1.1 percentage points) and Northeast and South (-0.6 point each).
Among the nine geographic divisions, the Pacific had the highest jobless rate, 8.2 percent in October. The West North Central again had the lowest rate, 5.1 percent. Two divisions had statistically significant over-the-month unemployment rate changes:
the West North Central (-0.3 percentage point) and South Atlantic (-0.2 point). Three divisions had significant rate changes from a year earlier: the Pacific (-1.3 percentage points), South Atlantic (-1.0 point), and Middle Atlantic (-0.7 point).
Nevada had the highest unemployment rate among the states in October, 9.3 percent. The next highest rates were in Rhode Island, 9.2 percent, and Michigan, 9.0 percent. North Dakota continued to have the lowest jobless rate, 2.7 percent. In total, 17 states had jobless rates significantly lower than the U.S. figure of 7.3 percent, 9 states and the District of Columbia had measurably higher rates, and 24 states had rates that were not
appreciably different from that of the nation.
Eleven states had statistically significant over-the-month unemployment rate decreases in October, the largest of which occurred in Missouri and South Carolina (-0.4 percentage point each). The District of Columbia had the only significant unemployment rate increase over the month (+0.3 percentage point). The remaining 39 states had jobless rates that were not measurably different from those of a month earlier, though some had changes that were at least as large numerically as the significant changes.
Thirteen states had statistically significant unemployment rate changes from October 2012, all of which were declines. The largest of these occurred in Florida (-1.5 percentage points), followed by California and North Carolina (-1.4 points each).
The table below shows the states with seasonally adjusted unemployment significantly different from the US for the period ending October 2013. The highest is Nevada at 9.3%, and the lowest is Wyoming at 4.3%, compared to the US average unemployment at 7.3%.

states table of unemployment
States with momentum the last 12 months are Missouri and South Carolina, both reducing unemployment by 0.4%, as shown in the table below.
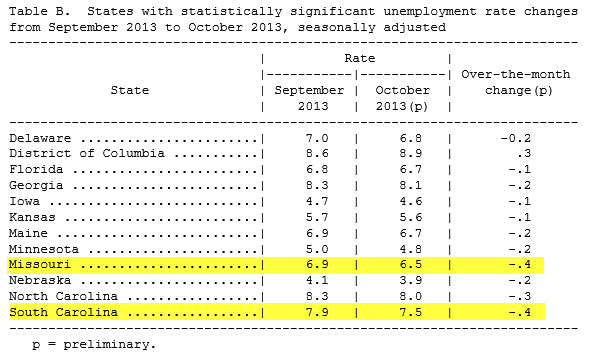
state changes
The preliminary not seasonally adjusted numbers for the October 2013 period show Louisiana has 2,090,700 people in the civilian labor force, and 128,200 unemployed for an unemployment rate of 6.1%, as shown in the table below. The labor force numbers include employed and unemployed people.
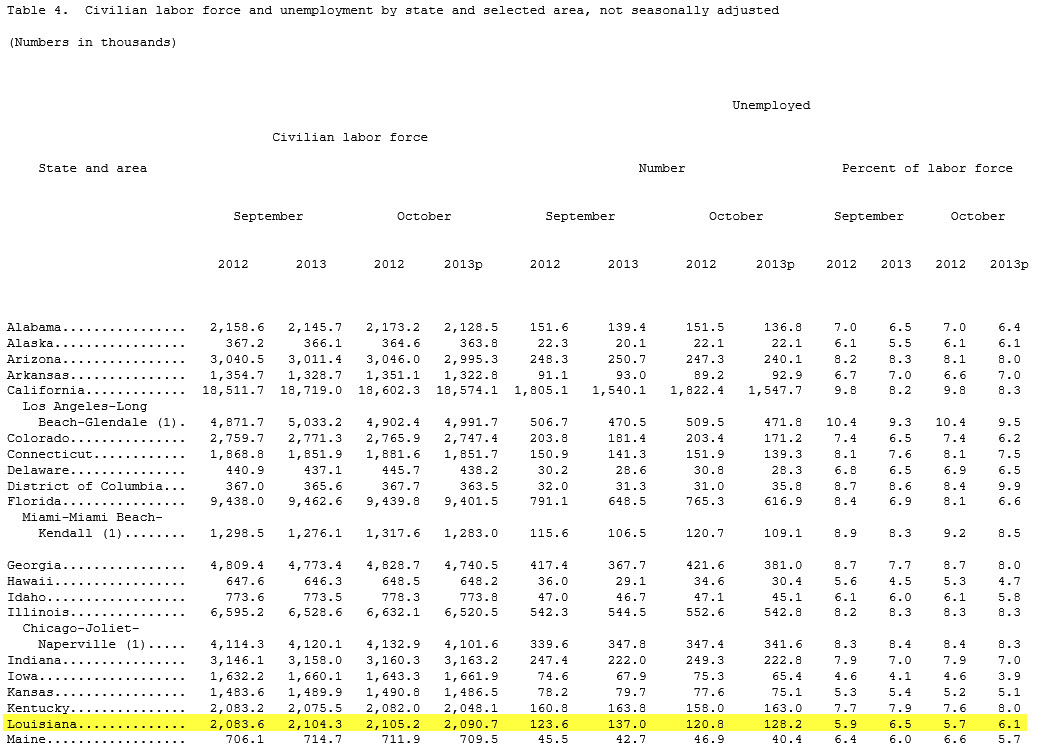
table 4 labor force
Make sure you don't compare crawfish with lobsters, since the Bureau of Labor also reports seasonally adjusted rates. Louisiana has seasonally adjusted 2,085,300 people in the civilian labor force, and 136,400 unemployed for an unemployment rate of 6.5%, as shown in the table below.
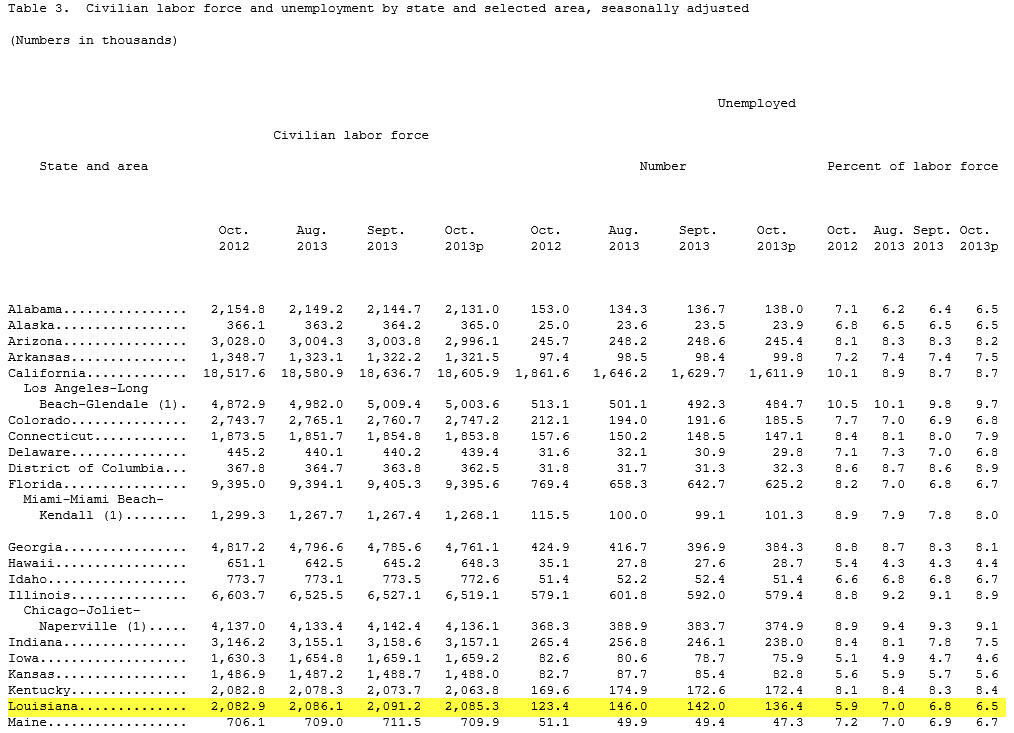
table 3 seasonally adjusted
In summary, over the last 12 months ending October 2013, even though 13,000 more people lost their job, there were 30,800 more people who found jobs. How can that be? Table E shows the October 2013 employment seasonally adjusted number at 1,966,500 which pulls data from a survey of total non-farm payroll by place of work. Table 3 which shows the unemployment rate changing from 5.9% to 6.5% is data from the local area unemployment statistics program which counts people by place of residence, not jobs. The labor force in Table 3 counts agricultural workers and self-employed, whereas Table E does not count them.
So what is the trend? For the period ending October 2013, the Louisiana seasonally adjusted unemployment rate has risen from October 2012 of 5.9% to 6.5%, or an increase in 13,000 unemployed over the last year from 123,400 unemployed to 136,400 unemployed, as shown in Table 3 above.
One of the most important indicators of how the U.S. economy is doing is personal income because it shows the potential spending power of the consumer which drives 2/3 of the economy with manufacturing now driving only 1/3 of the economy. Today the Bureau of Economic Analysis released data on how personal income changed for the most recent period, July 2013 to August 2013.
Personal income increased $57.2 billion, or 0.4 percent, and disposable personal income (DPI) increased $56.2 billion, or 0.5 percent, in August, according to the Bureau of Economic Analysis. In July, personal income increased $21.2 billion, or 0.2 percent, DPI increased $32.7 billion, or 0.3 percent, based on revised estimates. Of the 169 monthly periods since 2000, Personal Income growth has been 0.4 percent or more only 42% of the time, and has averaged 0.33%, making this month's change better than average.

Personal Income 2000 to 2013
A look at the more recent personal income change since 2012 shows severe ups and downs at the end of the year, with a declining trendline average around 0.20%. Since February 2013, the average monthly change is 0.41%, making this latest month of August change of 0.40% about average. The conclusion is that the personal income is not getting better since the trendline is declining and the latest month is only average.
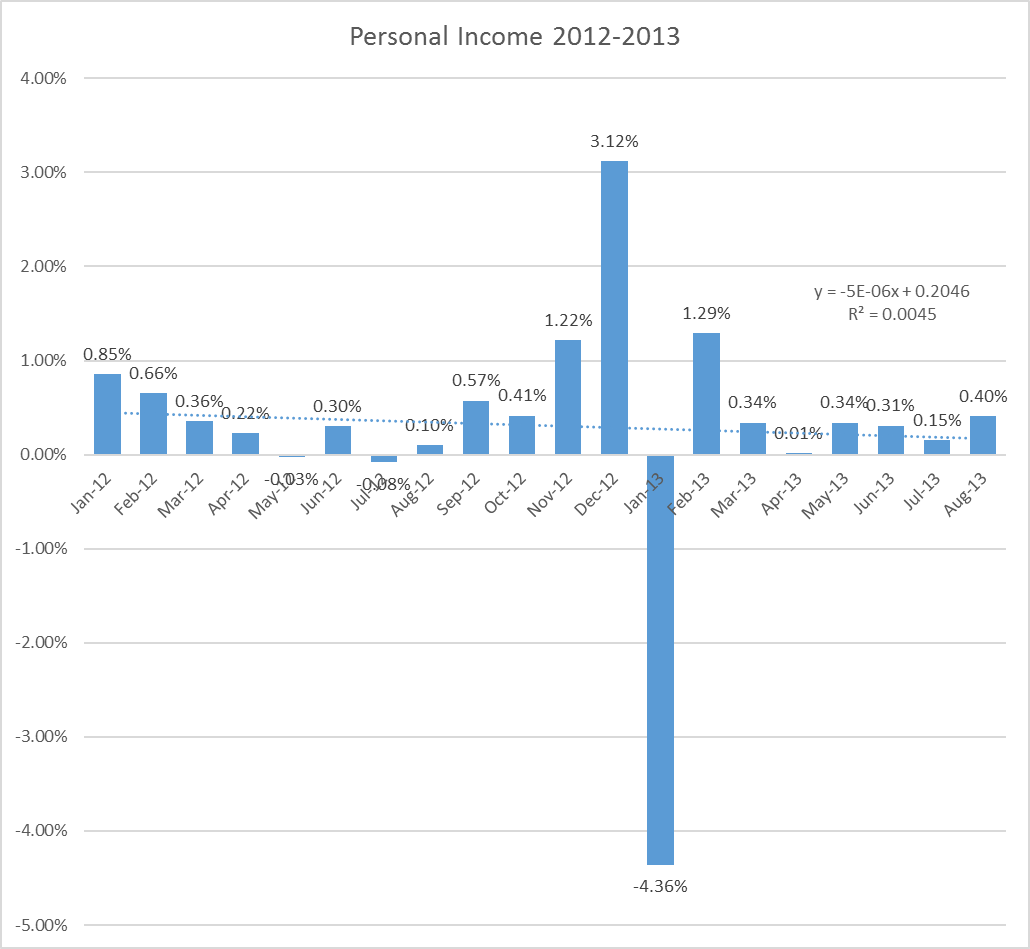
Personal Income Since 2012, Monthly
Personal Income is defined as Income received by persons from all sources. It includes income received from participation in production as well as from government and business transfer payments. It is the sum of compensation of employees (received), supplements to wages and salaries, proprietors' income with inventory valuation adjustment (IVA) and capital consumption adjustment, rental income of persons with capital consumption adjustment, personal income receipts on assets, and personal current transfer receipts, less contributions for government social insurance.
Disposable Personal Income is defined as total after-tax income received by persons; it is the income available to persons for spending or saving. Personal consumption expenditures (PCE) are the goods and services purchased by persons.
Last Thursday, data on Real Gross Domestic Product, GDP, was released. This was the third GDP estimate and was based on more complete data than was available for the second estimate last month. Real gross domestic product -- the output of goods and services produced by labor and property located in the United States -- increased at an annual rate of 2.5 percent in the second quarter of 2013 (that is, from the first quarter to the second quarter), according to the "third" estimate released by the Bureau of Economic Analysis, compared to the first quarter, when real GDP increased 1.1 percent.

GDP BY QUARTER CHART
The next release for GDP is October 30, 2013, which will be the advance estimate for the 3rd quarter 2013 period. For more info on GDP including the formula and the New Orleans economy, see our article at https://louisianacommercialrealty.com/2013/09/how-is-the-new-orleans-economy-doing/ .
Sources:
Guide To National Income: http://www.bea.gov/national/pdf/nipaguid.pdf
Bureau of Economic Analysis
www.louisianacommercialrealty.com
![]() Just out today is the Bureau of Economic Analysis report on GDP by MSA, showing last year the New Orleans-Metairie economy grew almost twice the average pace at 8.0% compared to the U.S. at 4.09%.
Just out today is the Bureau of Economic Analysis report on GDP by MSA, showing last year the New Orleans-Metairie economy grew almost twice the average pace at 8.0% compared to the U.S. at 4.09%.
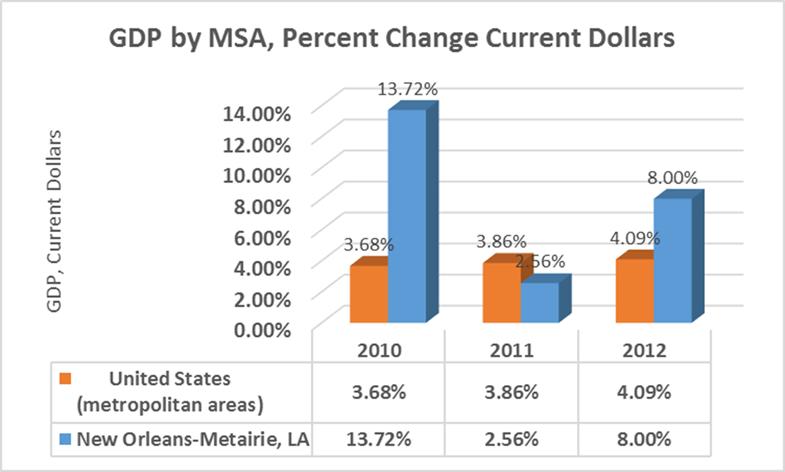
The New Orleans MSA was one of 305 Metropolitan Statistical Areas that experienced positive real growth in Gross Domestic Product in 2012, out of 381 MSA's.
Of the ten largest metropolitan areas, the three with the fastest real GDP growth in 2012 were San Francisco-Oakland-Hayward, CA (7.4 percent), Houston-The Woodlands-Sugar Land, TX (5.3 percent), and Dallas-Fort Worth-Arlington, TX (4.3 percent).The ten largest metropolitan areas, accounting for 34 percent of national GDP, averaged 3.1 percent growth in 2012 after growing 1.9 percent in 2011.
In 2012, the financial activities industry was a strong contributor to growth in many metropolitan areas. Notable contributions to growth from this industry occurred in Missoula, MT (3.4 percentage points); Eau Claire, WI (2.3 percentage points); Bloomington, IL (2.3 percentage points); Minneapolis-St. Paul-Bloomington, MN-WI (2.0 percentage points); and Ocean City, NJ (2.0 percentage points).
Durable-goods manufacturing continued to spur growth in many of the nation’s metropolitan areas in 2012. Strong contributions from this industry fueled growth in many small metropolitan areas where it constitutes a large portion of the area’s economy.4 This is especially true in the Great Lakes region where durable-goods manufacturing contributed 8.5 percentage points to growth in Elkhart-Goshen, IN, 8.3 percentage points to growth in Columbus, IN, and 7.2 percentage points in Kokomo, IN. Elkhart-Goshen, IN and Columbus, IN were two of the fastest growing metropolitan areas in 2012, with overall real GDP growth of 11.4 percent and 9.6 percent, respectively.

US GDP by MSAUS GDP by MSA
Real GDP expanded in 86 of the 114 MSAs wholly contained in the southeast region. Durable-goods manufacturing contributed the most to growth in real GDP for the region. This region accounts for 18.7 percent of the nation’s current-dollar GDP in durable-goods manufacturing. By contrast, government restrained growth in the region’s GDP.
? New Orleans-Metairie, LA and Lake Charles, LA experienced the largest upturns in real GDP growth due to a concentration in mining and nondurable-goods manufacturing, respectively. New Orleans-Metairie, LA growth improved to 7.6 percent in 2012 from –5.6 percent in 2011 (13.2 percentage points), while Lake Charles, LA growth improved to 2.5 percent in 2012 from –7.1 percent in 2011 (9.6 percentage points).
? Growth in real GDP ranged from –11.1 percent to 7.6 percent with the fastest growth occurring in New Orleans-Metairie, LA and Greenville, NC. Growth in each of these metropolitan areas was spurred by mining and nondurable-goods manufacturing, respectively.
? Atlanta-Sandy Springs-Roswell, GA and Miami-Fort Lauderdale-West Palm Beach, FL—the two largest metropolitan areas in the region, and the 10th and 11th largest in the nation—experienced growth (2.6 percent and 3.5 percent, respectively), due to growth in information and real estate, rental, and leasing, respectively.
Map of GDP in Southeast Region

Southeast Region GDP
GDP is the Gross Domestic Product, or the sum of goods and services produced inside the Unites States. It differs from GNP, Gross National Product which allocates production based on ownership. GDP by metropolitan area is the sub-state counterpart of the Nation's gross domestic product (GDP), the Bureau's featured and most comprehensive measure of U.S. economic activity. GDP by metropolitan area is derived as the sum of the GDP originating in all the industries in the metropolitan area.
GDP can be determined in three ways, all of which should, in principle, give the same result. They are the product (or output) approach, the income approach, and the expenditure approach.
The most direct of the three is the product approach, which sums the outputs of every class of enterprise to arrive at the total. The expenditure approach works on the principle that all of the product must be bought by somebody, therefore the value of the total product must be equal to people's total expenditures in buying things. The income approach works on the principle that the incomes of the productive factors ("producers," colloquially) must be equal to the value of their product, and determines GDP by finding the sum of all producers' incomes.
Example: the expenditure method:
Note: "Gross" means that GDP measures production regardless of the various uses to which that production can be put. Production can be used for immediate consumption, for investment in new fixed assets or inventories, or for replacing depreciated fixed assets. "Domestic" means that GDP measures production that takes place within the country's borders. In the expenditure-method equation given above, the exports-minus-imports term is necessary in order to null out expenditures on things not produced in the country (imports) and add in things produced but not sold in the country (exports).
Current dollar GDP is the actual number, quoted here in millions, and the Real Dollar GDP is adjusted for inflation. The statistics of real GDP by metropolitan area are prepared in chained (2005) dollars. Real GDP by metropolitan area is an inflation-adjusted measure of each area’s gross product that is based on national prices for the goods and services produced within the metropolitan area. The statistics of real GDP by metropolitan area and of quantity indexes with a base year of 2005 were derived by applying national chain-type price indexes to the current-dollar GDP-by-metropolitan-area values for the 61 detailed NAICS-based industries.
The metropolitan (statistical) areas used by BEA for its entire series of GDP statistics are the county-based definitions developed by the Office of Management and Budget (OMB) for federal statistical purposes and last updated in February 2013. OMB's general concept of a metropolitan area is that of a geographic area consisting of a large population nucleus together with adjacent communities having a high degree of economic and social integration with the nucleus.
New Orleans–Metairie-Kenner Metropolitan Statistical Area, or the Greater New Orleans Region (as it is often called by the Louisiana Tourism Commission) is a metropolitan area designated by the United States Census encompassing eight parishes (the Louisiana equivalent of other states' counties) in the state of Louisiana, centering on the city of New Orleans. As of the April 1, 2012 estimate, the metropolitan statistical area (MSA) had a population of 1,227,096. The New Orleans-Metairie-Hammond combined statistical area (CSA), a ten-parish area, had a population of 1,452,502.
Source: Bureau of Economic Analysis, www.louisiancommercialrealty.com
![]() Just out today are the numbers on how many people are employed in the U.S., but if you drill deeper, you can find out current employment data on Louisiana and also the New Orleans MSA. Looking at employment growth provides a snapshot of consumer spending driving economic growth and can help you plan a wide variety of business decisions such as: commercial real investment, inventory size, payroll expansion or contraction and new location demand.
Just out today are the numbers on how many people are employed in the U.S., but if you drill deeper, you can find out current employment data on Louisiana and also the New Orleans MSA. Looking at employment growth provides a snapshot of consumer spending driving economic growth and can help you plan a wide variety of business decisions such as: commercial real investment, inventory size, payroll expansion or contraction and new location demand.
The chart and table below shows the U.S. employment growth in 3 month increments which evens out the peeks and valleys . It is seasonally adjusted and starts in 2003. The most recent period shows 0.4 percent growth for the period ending July 2013.
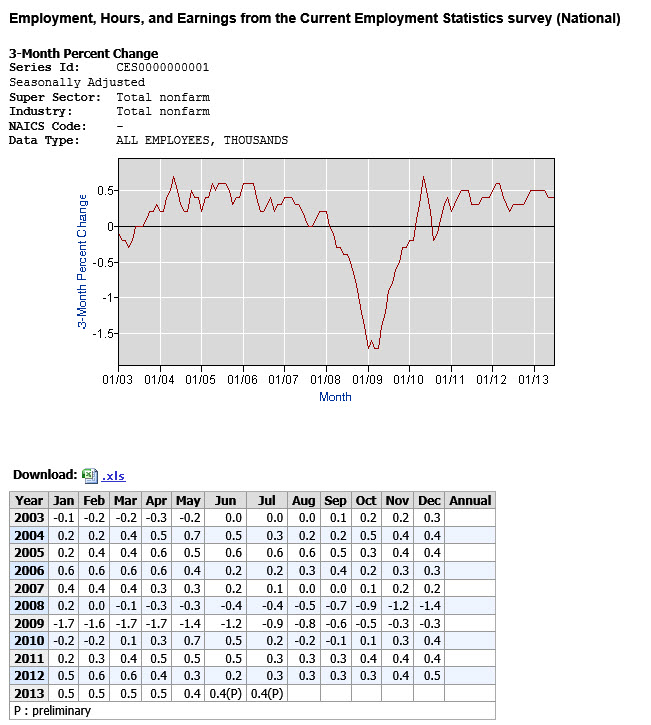
employment chart national 3 mo percent change
The chart below shows the same 3 month percent change in non-farm employment, seasonally adjusted, but since it must take into account the large decline in 2005 due to Katrina, the subsequent data is difficult to analyze.

employment chart new orleans msa
The chart below compares the New Orleans employment market growth to the Houston market for the same time period, seasonally adjusted. Current employment growth is still positive whereas the New Orleans employment growth is negative.
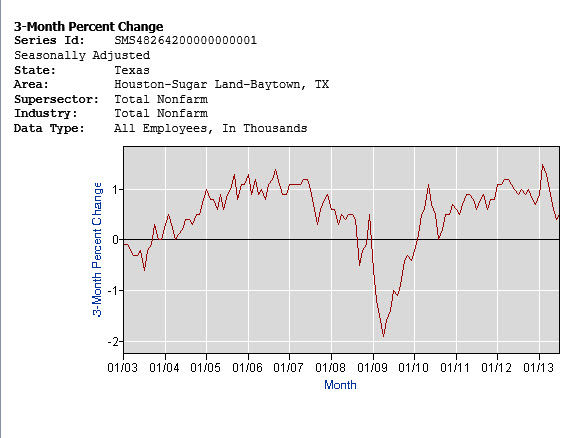
employment chart houston 3 mo percent
The chart below starts the time period in 2007, after Hurricane Katrina and shows 2013 employment declines similar to 2009.
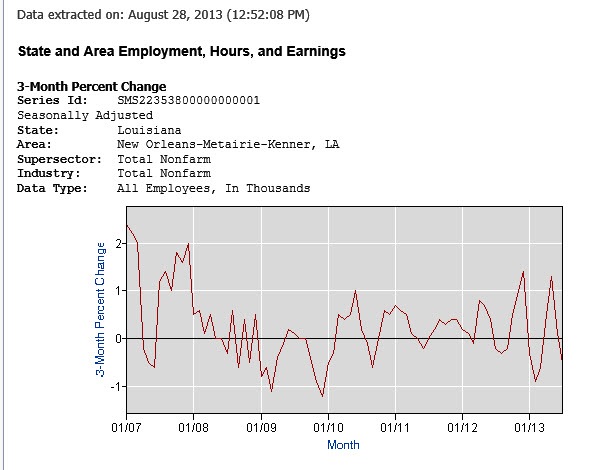
employment percent 2007 to 2013 new orleans msa
In summary, the New Orleans employment growth rate and therefore the economy is declining and unable to enjoy the employment growth occurring in both the national arena and nearby Houston market. Both Houston and the U.S. economy are growing their employment, although not as fast as previous periods.
For table data, email Robert hand at roberthand@cox.net.
![]() Today the Bureau of Labor Statistics announced the unemployment numbers for the period ending July 2013 broken down into the 372 metropolitan areas. Jobless rates were lower in July than a year earlier in 320 of the 372 metropolitan areas, higher in 38, and unchanged in 14.
Today the Bureau of Labor Statistics announced the unemployment numbers for the period ending July 2013 broken down into the 372 metropolitan areas. Jobless rates were lower in July than a year earlier in 320 of the 372 metropolitan areas, higher in 38, and unchanged in 14.
Forty-one areas had jobless rates of at least 10.0 percent, and 34 areas had rates of less than 5.0 percent. Over the year, 319 areas had increases in nonfarm payroll employment, 48 had decreases, and 5 had no change. The national unemployment rate in July was 7.7 percent, not seasonally adjusted, down from 8.6 percent a year earlier. It helps to compare the U.S. employment growth to the Louisiana employment growth and examine a long term view.
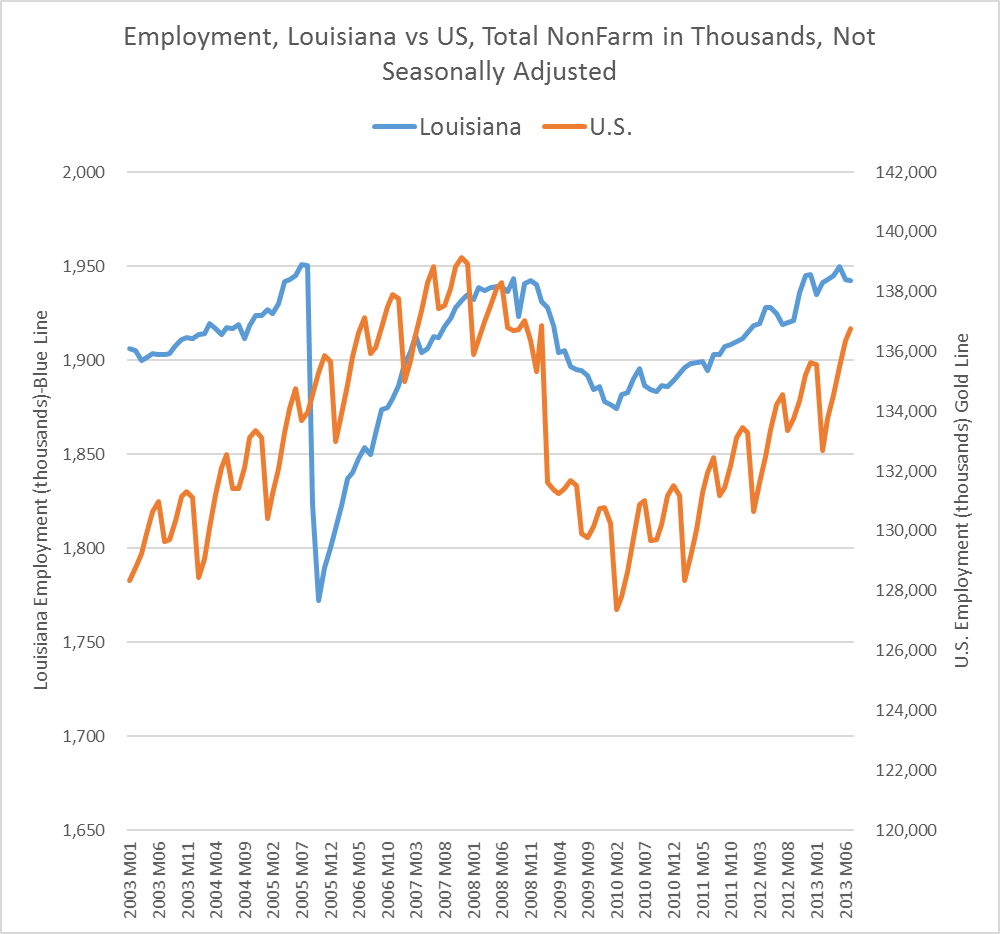
employment chart
For additional information, including excel tables and charts, contact Robert Hand at roberthand@cox.net.
![]() Tulane Avenue is transitioning from a mixture of businesses operating out of shotgun houses, outdated hotels, bars, auto repair shops and bail bondsmen to a neighborhood of new multi-million dollar apartments and retail centers. This process is technically called "gentrification", where commercial real estate undergoes a change to a higher and better use.
Tulane Avenue is transitioning from a mixture of businesses operating out of shotgun houses, outdated hotels, bars, auto repair shops and bail bondsmen to a neighborhood of new multi-million dollar apartments and retail centers. This process is technically called "gentrification", where commercial real estate undergoes a change to a higher and better use.
Recently, the Time-Picayune newspaper discussed the changes in commercial real estate on Tulane Avenue with Louisiana Commercial Realty's president, Robert Hand.

Times Picayune Interviews Louisiana Commercial Realty On Tulane Avenue Commercial Property
The last few years have been good to New Orleans, with lower unemployment than the rest of the U.S. and the focus on tourism resulting in jam-packed restaurants and hotels. But it hasn't always been this way. What is really interesting is, how does the New Orleans' economy compare to the rest of the U.S.? This article looks at the New Orleans economy and compares it to the U.S. economy and explains not only the driving forces the last few years but also goes back to the 1970's to examine the big picture of how living in New Orleans is like an invisible tax that results in lower personal income growth than the rest of the U.S.
Yesterday the Bureau of Economic Analysis released the estimates for personal income growth, which reflects the health of the economy because it measures the total income earned by U.S. residents. Snowden would be proud of the way personal income estimates include all compensation including self-employment, rental income, Social Security and Medicare and pension benefits. The statistics are released one month after the period it analyzes and there are two revisions in each of the following months. Yesterday's release for June 2013 reported personal income was up 0.3%. This is the percent change from the preceding month. The bureau also releases the data in current dollars and chained dollars, but that's another story. The reason you need to know the trend in personal income is because it is the driving force behind the consumer, and it is a growing percentage every time one of our industries moves overseas. The total economy is about 2/3 consumer driven and 1/3 industrial driven.
In addition to knowing how the U.S. personal income is performing, it is important to know how the New Orleans personal income is doing. The government keeps track of that also. The more interesting information is, how does the personal income in New Orleans compare to the U.S.? The chart below shows the New Orleans personal income growth compared to the U.S.; the New Orleans Metropolitan Statistical Area is used because it is a standard way of measuring population and is used by the Census Bureau. There are 381 MSA's in the U.S.

chart personal income
The blue line in the chart is the New Orleans MSA annual percent change in personal income and the first spike is 1981 when New Orleans annual personal income was 7.9% better than the US. That was the year Jimmy Carter was out and Ronald Reagan was in. MTV was born, the hostages were released from Iran, an OPEC agreed to sell oil at $32/ barrel. The largest decline in New Orleans personal income growth was in 1987 when personal income was 6.97% worse than the U.S.; Reagan was still president, Gary Hart and Jimmy Bakker stumbled, and oil prices fell by 50% but OPEC targeted oil at $18/barrel. The next counter-move was in 1999 when New Orleans personal income growth underperformed the U.S. by 6.47%, but in 2001 it reversed course and outperformed by 5.23%. The next big spike is after hurricane Katrina, when in 2007 New Orleans annual personal income growth outperformed the U.S. by 10.08%, followed by 6.39% in 2008. The chart below explains it better by looking at just the difference between the annual change in New Orleans personal income and U.S. personal income.
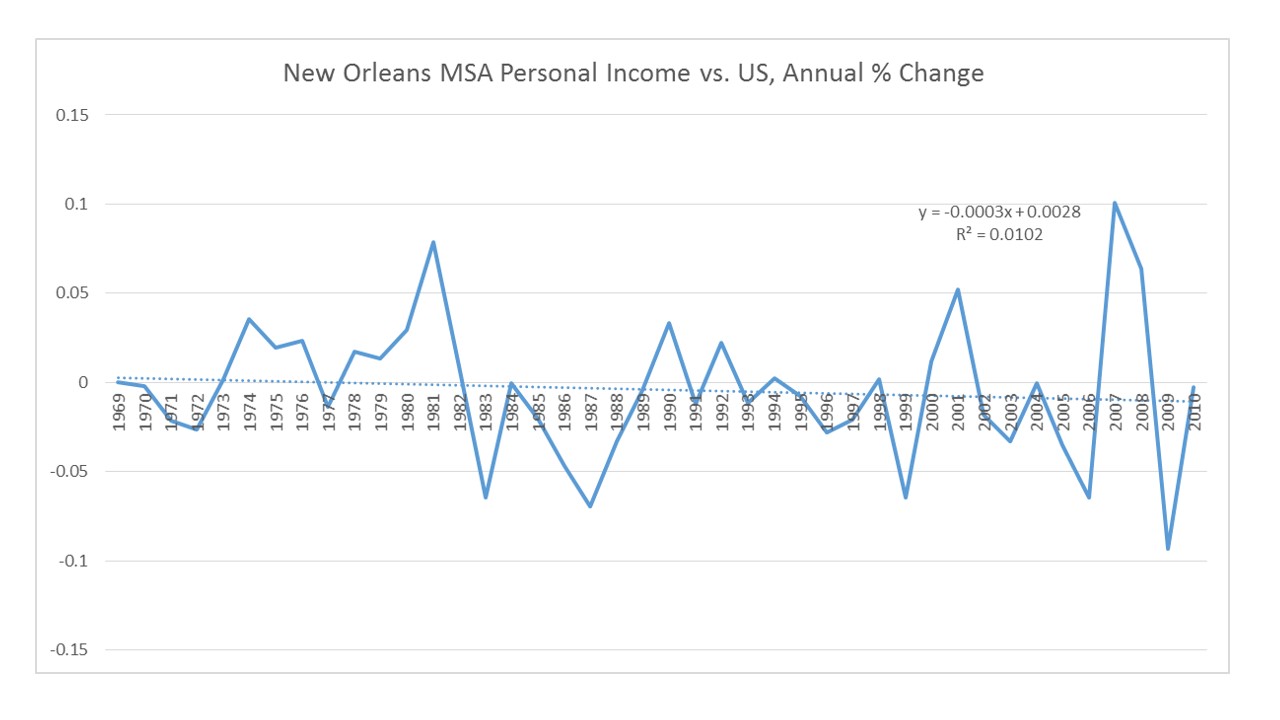
personal income variance
Notice how many years the variance is above zero and how many years below. The numbers show personal income growth in New Orleans outperformed the U.S. in 17 of 41 periods since 1970, or 41% of the time. The cumulative difference in personal income growth is negative 17%. It's better that we know what we have gotten into, but just don't dwell on it. Frame it positively as a tax on living in New Orleans and the right to enjoy the culture and rich history of New Orleans.
For the math oriented, the chart shows a formula of the trend line (dotted) of the data points in the blue line. The slope is negative and the coefficient is 0.0003. Using the past to predict the future means New Orleans personal income growth underperforms the U.S. by a factor of 0.0003. Annually.
Sources: Bureau of Economic Analysis, www.louisianacommercialrealty.com
For more information on how the New Orleans economy affects New Orleans commercial real estate, click on https://louisianacommercialrealty.com/2013/05/08b/
![]() The latest apartment to be developed near the new Tulane Avenue hospital is announced. Despite the fact that everyone knows about the billion dollar VA/LSU hospital complex, which is the largest new hospital development in the US-being built on Tulane Avenue-only now has a developer stepped forward to convert a nearby vacant building into apartments. The building is the 17 story, 130,000 square foot building at 144 Elk Place, previously thought to be in a poor location: not close enough to Poydras and too far from the French Quarter, making a transition to a different use more than a businessman's risk.
The latest apartment to be developed near the new Tulane Avenue hospital is announced. Despite the fact that everyone knows about the billion dollar VA/LSU hospital complex, which is the largest new hospital development in the US-being built on Tulane Avenue-only now has a developer stepped forward to convert a nearby vacant building into apartments. The building is the 17 story, 130,000 square foot building at 144 Elk Place, previously thought to be in a poor location: not close enough to Poydras and too far from the French Quarter, making a transition to a different use more than a businessman's risk.
Wampold, a Baton Rouge developer plans to convert a vacant 17-story downtown office tower into luxury apartments for medical district employees and downtown office workers. Plans for the 130,000-square-foot Elks Building at 144 Elks Place include 8,000-square-feet of ground floor retail, seven levels of parking comprising 200 spaces and nine floors of one-, two- and three-bedroom apartments, building owner Mike Wampold said. A $16 million building permit was issued July 16, and interior demolition has already begun. Lemoine Construction of Grosse Tete is the general contractor for the project, Coleman and Partners Architects of Baton Rouge designed. Wampold said construction would take about 10 months and units would be ready by May. Wampold said the building, which was built in 1975, is not historic and that he did not use tax credits to purchase the property or fund its conversion.

144 elk place
“This allows us to make renovations how we want on the interior and exterior,” Wampold said. “We had considered carving out condos, but we made the decision to own it out right and rent units out.” Apartment rents will be set at market rate, which ranges from $794 to $1,200 per month for all of metro New Orleans according to the most recent multi-family housing report from Larry G. Schedler and Associates. Wampold said amenities will include a rooftop pool and fitness center. He hopes the building’s location will attract the incoming work force at University Medical Center and the Veterans Affairs Hospital, along with current Central Business District and French Quarter workers.
![]() The numbers are out, but the numbers behind the published numbers will startle you. Yesterday the Bureau of Labor Statistics released the latest numbers on national unemployment rate; but the government also released numbers on Metropolitan Statistical Areas which include New Orleans and is included in this analysis.
The numbers are out, but the numbers behind the published numbers will startle you. Yesterday the Bureau of Labor Statistics released the latest numbers on national unemployment rate; but the government also released numbers on Metropolitan Statistical Areas which include New Orleans and is included in this analysis.
The Office of Management and Budget defines statistical areas for the metropolitan and micropolitan areas of the United States and Puerto Rico. Most recently, the OMB defined 1098 statistical areas, of which, 388 are Metropolitan Statistical Areas, 381 for the U.S. and 7 for Puerto Rico.
A Metropolitan Statistical Area is one or more adjacent counties or county equivalents that have at least one urban core area of at least 50,000 population, plus adjacent territory that has a high degree of social and economic integration with the core as measured by commuting ties.

map msa
Unemployment rates were lower in August than a year earlier in 311 of
the 372 metropolitan areas, higher in 47 areas, and unchanged in 14
areas, the U.S. Bureau of Labor Statistics reported. Not all areas were similar, with 28 areas having jobless rates of at least 10.0 percent, and 41 areas
having rates of less than 5.0 percent. Two hundred and eighty-eight
metropolitan areas had over-the-year increases in nonfarm payroll
employment, 72 had decreases, and 12 had no change. A total of 207 areas had
August unemployment rates below the U.S. figure of 7.3 percent, 158
areas had rates above it, and 7 areas had rates equal to that of the
nation.
The other side of the story is that there has been a massive withdrawal in the number of people looking for jobs, which affects how the unemployment rate is calculated. The chart below shows the labor force participation rate is at its lowest level in ten years.

chart labor force participation rate
The numbers for the people employed compared to the population show we are still near a ten year low, as shown in the chart below.

chart population ratio
The labor force since 2010 has grown from 153 million to 155.5 million. That is a growth rate of 1.6 percent over 33 months, or 0.58 percent annual growth, as shown in the chart below.

chart labor force since 2010
Unemployment for the New Orleans-Metairie-Kenner MSA was worse, at 7.2 percent for August 2013, compared to 6.9 percent in August 2012, and was the opposite of a positive trend witnessed by the State of Louisiana which experienced unemployment of 6.7 percent for August 2013, compared to 7.9 percent in August 2012. The New Orleans MSA recorded 547.3 thousand workers in the civilian labor force, which, as shown in the chart below, has recovered some since Hurricane Katrina.

chart new orleans employment
Since 2011, New Orleans MSA employment has increased from 520 thousand to 533 thousand, a growth rate of 2.50 percent total, or approximately 1 percent annual growth in employment, as shown in the chart below.
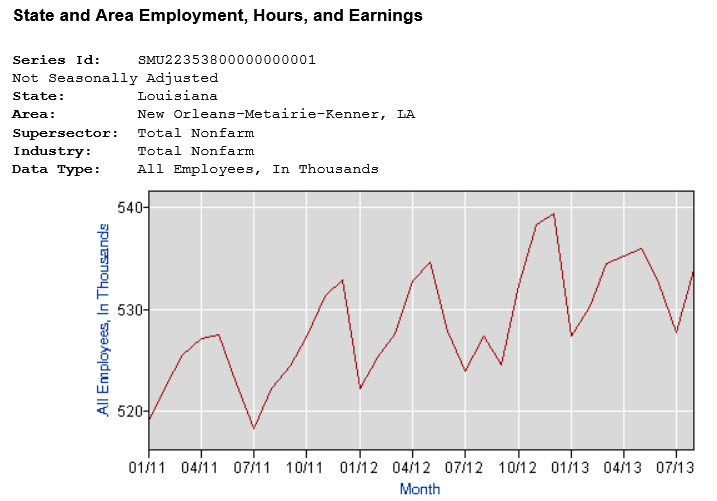
chart new orleans since 2011
The reason we look at these numbers is to try to figure out if there are more people getting jobs which drives the economy in the future. The answer is yes, there are people getting jobs but there are also more people leaving the labor pool because they giving up or unable to find jobs. This makes sense in an economy where GDP was 2.5 percent growth in the 2nd quarter 2013 compared to the 1st quarter 2013, and 1.1 percent for the 1st quarter compared to the previous quarter, as shown in the chart below. The number that makes the most sense is not a rate or ratio but how many people are in the labor force and how has that grown. The answer is the above chart on labor force growth is 155.5 million with a growth rate of 0.58% annually since 2010. The prudent and logical conclusion is that, even though interest rates are at their lowest levels in decades, we will continue to have a slow economy for several years, maybe even a decade. In a slow growth environment, cash flow from assets should do very well, and the conclusion is that New Orleans commercial real estate producing income from 5 percent to 10 percent can easily be found today, generating a real return over inflation of between 3 percent and 8 percent which historically beats any other asset class over the last decade.

chart gdp
For more information about MSA's, including maps, see our article at:
https://louisianacommercialrealty.com/2013/09/how-is-the-new-orleans-economy-doing/
For more information about labor force participation, including charts and tables, see our article at:
Sources: www.louisianacommercialrealty.com, Bureau of Labor Statistics
![]() The past few months have witnessed several large commercial real estate transactions in New Orleans, including hotels, retailers and warehouses, emphasizing that New Orleans is a diverse market with buyers who have confidence in the future of commercial real estate and are willing to invest millions. Recently there were 14 big money transactions in New Orleans commercial real estate, and here are the specifics:
The past few months have witnessed several large commercial real estate transactions in New Orleans, including hotels, retailers and warehouses, emphasizing that New Orleans is a diverse market with buyers who have confidence in the future of commercial real estate and are willing to invest millions. Recently there were 14 big money transactions in New Orleans commercial real estate, and here are the specifics:
When he is not spending time taking First NBC public, Ashton Ryan, works on developing Lake Forest Plaza in New Orleans East, which has been a multi-year challenge. He sold 104,000 square feet of the vast land area for $2,250,000 to CVS in December 2012, which is $21.50 per square foot.

3601 camp sells for $1.2mm
In February 2013, the Orleans Parish School Board sold the three story, 20,000 square foot, Free School at 3601 Camp for $1,200,000, or $39 per square foot. The building is on 31,000 square feet of land and was appraised at $1,400,000, but sold at auction to the highest and best bidder that wasn't afraid of environmental problems and investing $5 to $10 million more to bring the property back into commerce. The site is zoned RM-2, Multi-family.
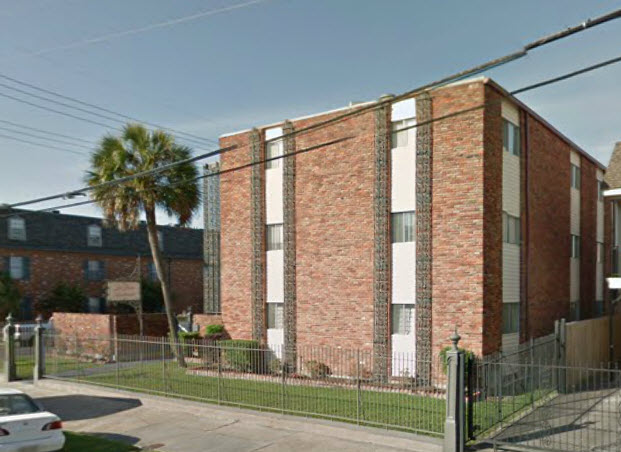
1139 jackson avenue sells for $1,015,000
1139 Jackson Avenue, an unrenovated, 18 unit apartment complex sold in February for $1,015,000. In the Rosalie Pinke family since 1978, the apartment complex is in operation on the corner of Jackson Avenue and Camp Street. It was purchased by Haddad Ventures.
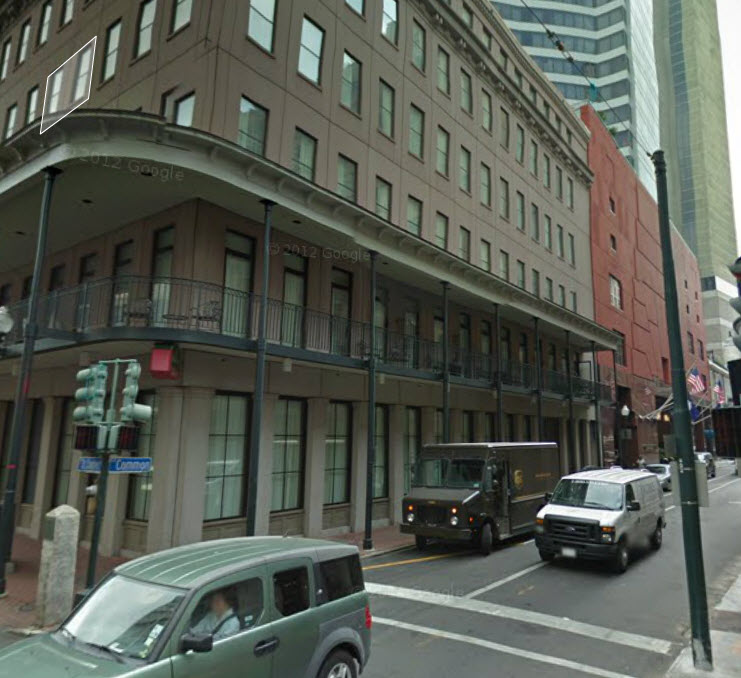
124 st charles avenue sold for $26 million
124 Saint Charles Avenue, the 140 room Marriott on the corner of Common and Saint Charles Avenue, sold last month for $26 million, or $185,000 per room, by Adam and Thad Ackel to Summit Hotel,LP.

300 julia street sold for $31.5mm
300 Julia Street, the 202 room Courtyard by Marriott sold last month for $31,500,000, $155,000 per room, to Summit Hotel. LP, a real estate investment trust based in Austin, Texas.
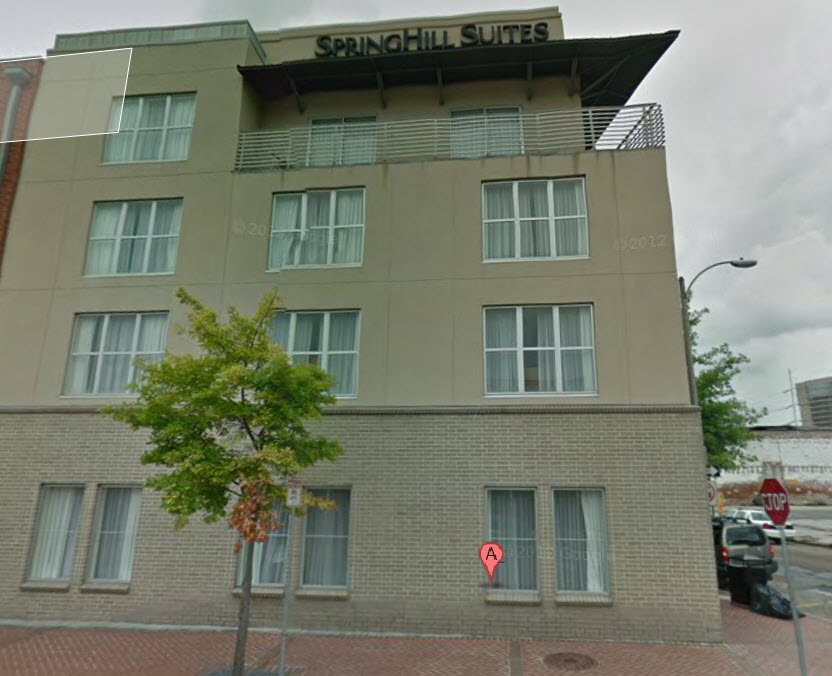
301 st joseph sells for $33.5 million
The 208 room Marriott at Julia and St. Joseph also sold last month to Summit Hotel, LP for $161,000 per room.
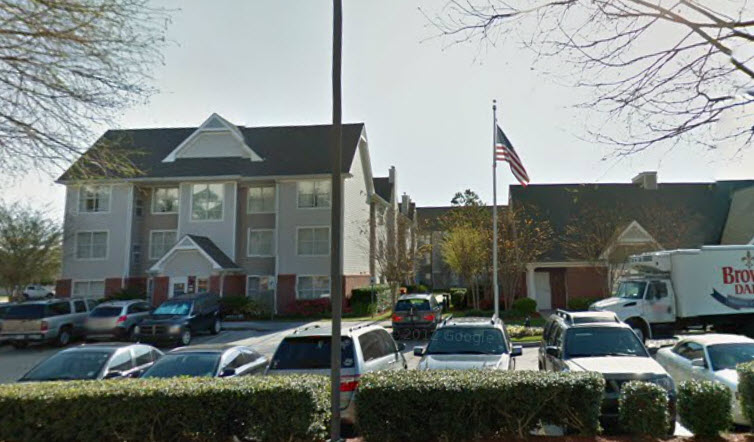
3 galleria sold for $20 million
The 120 room Residence Inn near the Galleria Office Building at Causeway and I-10 sold last month by Galleria Inn, Henry O'Conner, to Summit Hotel, LP at $166,000 per room.

2 galleria marriott sold for 24 million
Last month the 153 room Courtyard by Marriott sold for $24 million, or $156,000 per room, by Galleria Court, Henry O'Conner, to Summit Hotel, LP.

140 carondelet sold for $660,000
140 Carondelet Realty, Michael Kirby, sold the 11,000 square foot building to St. Peter Group, Richard Williams, for $660,000, or $59 per square foot. The 3-story, elevator-serviced office building formerly housed Commonwealth Savings Bank.
The first floor former bank branch has been gutted and the other two floors are built out as offices. There is a common alley in the rear of the building with access to Common Street.
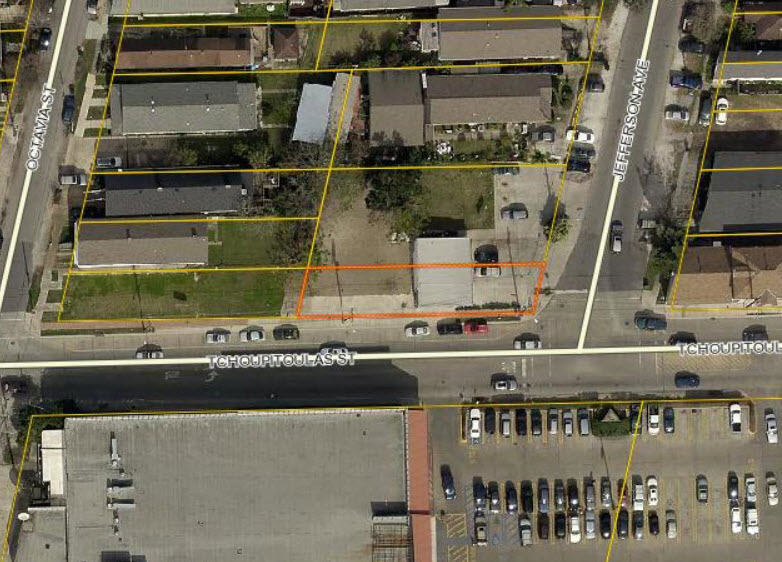
5405 tchoupitoulas sells for $858,000
The 16,000 square foot lot at Tchoupitoulas and Jefferson Avenue, home of the Roly-Poly restaurant, sold for $858,000, or $52 per square foot, by Shamus, LLC, Ben Butler to BCH NOLA, Ben Butler. Shamus purchased the lots in March 2012, for $830,000 from Claude Zerinque, who purchased the lots in March 2006, for $160,000.

2127 prytania sold for $1.6mm
Near Jackson Avenue, the 13 room hotel sold for $1.6mm, or $123,000 per room.
This vacant land site was acquired for a mixed-use development of apartments and retail at $37 per square foot, one of the highest prices paid for vacant land on Tchoupitoulas Street. The zoning is B-1A, Neighborhood Business District and the flood zone is A1. This property is on the corner of Richard Street and Magazine Street in the Lower Garden District. The buyer is the original owner of the swampland he sold to the City of New Orleans to house Dorothy Mae Taylor's ill-fated Jazzland.
In the Industrial sector, 321 Time Saver Avenue, 115,000 square feet of land, sold last month for $2,850,000.
In Retail, the old K-Mart at 5990 Lapalco Boulevard, a 72,000 square foot building on 6.8 acres, sold last month for $1.5 million.
In the Office sector, the old CNA building at 3350 Ridgelake Drive, sold for $2.3 million by Joe Jaeger from Craig Guidry at Vatocan Ventures who purchased the building in 1997 for $1.8 million.
These recent big money transactions are a result of strength in several markets: hotel, industrial, office and retail, since the buyer has confidence that the million dollar prices will return a reasonable rate of their investment. While one side of the coin says a sale of the Marriott Hotels means they are getting out of the market, the other side of the coin says because the properties did not sit on the market for years or sell at fire sale prices, that the New Orleans commercial real estate market is vibrant and a worthy investment.
Sources: www.louisianacommercialrealty.com, DeedFax, Clerk of Court records.
Of those that own commercial real estate, there are more assets in rental property than in IRA's, 401(k)'s and the median net worth of Americans. In the 2010 census, Americans were asked where they invested their money. Of the 118.554 households , the largest category of asset was the Interest Earning Account at a Financial Institution, with 69.8% of the households investing in that category. The second highest category was asset was a home at 65.9% of the households, as seen in the table below:
TOTAL |
|
Number of Households (thousands) |
118,554 |
| Interest Earning Assets at Financial Institutions | 69.8 |
| Other Interest- Earning Assets | 3.0 |
| Regular Checking Accounts | 28.4 |
| Stocks and Mutual Fund Shares | 20.4 |
| Own Business or Profession | 13.9 |
| Motor Vehicles | 83.9 |
| Own Home | 65.9 |
| Rental Property | 5.2 |
| Other Real Estate | 5.0 |
| Mortgages | 0.7 |
| U.S. Saving Bonds | 10.3 |
| IRA or KEOGH Accounts | 29.4 |
| 401K & Thrift Savings Plan | 42.0 |
| Other Assets | 3.7 |
The bar chart below shows what percent of households own various assets, using the data from the table:
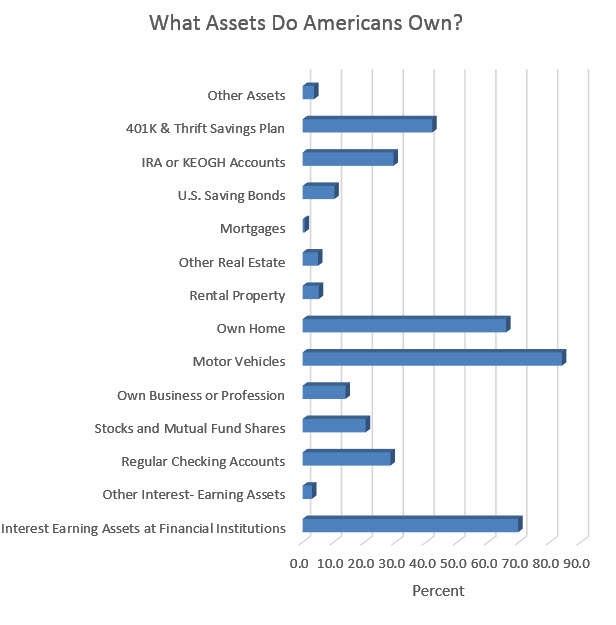
chart of assets
The value of the assets tell a different story, with the median value of assets in 2010 for the average American resulting in a net worth of $66,740, but only $15,000 if you exclude the equity in the home, as shown in the table below. The interesting number is the median value of commercial real estate, that is, rental property is $170,000 and other than home real estate equity is $75,000. So how can the rental property equity be higher than the net worth? Both numbers are after debt is subtracted. The answer is that not everyone owns rental property, but when all the values are calculated the values of rental property are higher than other categories. There is more than 5 times the equity in commercial real estate than in the average household's IRA or 401(k).
TOTAL |
|
| Net Worth | 66,740 |
| Net Worth (Excluding Equity in Own Home) | 15,000 |
| Interest Earning Assets at Financial Institutions | 2,463 |
| Other Interest- Earning Assets | 16,528 |
| Regular Checking Accounts | 600 |
| Stocks and Mutual Fund Shares | 18,300 |
| Equity in Business or Profession | 5,000 |
| Equity in Motor Vehicles | 6,237 |
| Equity in Own Home | 80,000 |
| Rental Property Equity | 170,000 |
| Other Real Estate Equity | 75,000 |
| U.S. Saving Bonds | 800 |
| IRA or KEOGH Accounts | 30,000 |
| 401K & Thrift Savings Plan | 27,000 |
| Other Assets | 24,000 |
Americans may have been created equal, but a vast difference exists between the races, as shown in the table below. Hispanics have less than 10% of the average net worth and blacks have 5% of the average net worth, compared to Americans as a whole. The economically disadvantages the two fastest growing populations, who have realized they control their destiny by voting the Democratic Party into office since the Republican Party has ignored their needs.
Net Worth |
|
| TOTAL | 66,740 |
RACE OF HOUSEHOLDER |
|
| White Alone | 87,906 |
| White Alone (Not of Hispanic Origin) | 110,729 |
| Black Alone | 4,955 |
| Asian Alone | 69,590 |
| Other (residual) | 15,795 |
| Hispanic Origin | 7,424 |
| Not of Hispanic Origin | 82,730 |
Another conclusion from the 2010 census was the median net worth of households according to education, with the median high school drop out having a net worth of 5% of the household with a bachelor's degree. This is why we will continue to experience crime in New Orleans until we find a way to get more students through high school and into trade schools. The assets New Orleans commits to higher graduation rates will easily pay for itself.
EDUCATION OF HOUSEHOLDER |
|
| No High School Diploma | 7,270 |
| High School Graduate Only | 42,223 |
| Some College, No Degree | 43,580 |
| Associate's Degree | 58,861 |
| Bachelor's Degree | 142,518 |
| Graduate or Professional Degree | 245,763 |
NOTE: In dollars. Excludes group quarters. (B) - Base is less than 200,000 households. Individual outliers that highly influenced the mean value for asset categories were excluded. "Other Assets" includes mortgages held for sale of real estate, amount due from sale of business or property, and other financial assets. Federal surveys now give respondents the option of reporting more than one race. There are two basic ways of defining a race group. A group such as Black may be defined as those who reported Black and no other race (the race-alone or single-race concept) or as those who reported Black regardless of whether they also reported another race (the race alone-or-in-combination concept). This table shows data using the first approach (race-alone). The use of the single race population does not imply that it is the preferred method of presenting or analyzing data. The U.S. Census Bureau uses a variety of approaches. Because Hispanics may be any race, data in this table for Hispanics overlap slightly with data for the Black population. Data for American Indians and Alaska Natives are not shown because of their small sample size. The race or Hispanic origin of the householder designates the race or Hispanic origin of the household. The estimates in this table are based on responses from a sample of the population and may differ from the actual values because of sampling variability and other factors. As a result, apparent differences between the estimates for two or more groups may not be statistically significant. For information on sampling and nonsampling error see: http://www.census.gov/sipp/source.html
Source: U.S. Census Bureau, Survey of Income and Program Participation, 2008 Panel, Wave 7; www.louisianacommercialrealty.com
![]() The West Bank was not affected by Hurricane Katrina, except that the population increased dramatically there and apartment occupancy skyrocketed. One beneficiary was 94 percent occupied Baywood Apartments, previously Carlyle Apartments, which was sold last month for $18,000,000. The buyer was not local, a real estate investment company in California called Delta Alliance, founded by Robert Warren with a typical started at the bottom pedigree:
The West Bank was not affected by Hurricane Katrina, except that the population increased dramatically there and apartment occupancy skyrocketed. One beneficiary was 94 percent occupied Baywood Apartments, previously Carlyle Apartments, which was sold last month for $18,000,000. The buyer was not local, a real estate investment company in California called Delta Alliance, founded by Robert Warren with a typical started at the bottom pedigree:
President of Investor Property Services (IPS), a 30 year old property management firm based in Orange County California. Through IPS, Warren has personally supervised a multi-million dollar property portfolio including such diversified assets as multifamily, office complex, shopping center, condominium association, medical office, assisted living and hotel/motel businesses with an emphasis on non-performing assets owned or controlled by financial institutions, state court receiverships, and bankruptcy court authorities. Warren has acted a superior court receiver for income property in a variety of states and possesses a proven ability to analyze, operate and turnaround underperforming assets. Mr. Warren is a Certified Property Manager (CPM®) through the prominent and renowned industry organization, the Institute of Real Estate Management. Warren has taught property management at California State Polytechnic University was the 2005 co-chair of the Los Angeles/Orange County chapter of the California Receiver’s Forum and is the 2003 past president of the Institute of Real Estate Management Orange County Chapter #91.Mr. Warren holds a BA in Economics and a Master’s in Business Administration.
Delta has 20,000 units under management and 2.5 million square feet of commercial space in nine states.

Baywood Apartments Sell For $18 Million
The site, shown above in red outline, is 288 units on 12 acres with 242,000 net rentable area, with rents on one bedrooms at $730 per month and $930 on two bedrooms. Built in 1984 with 535 parking spaces and 26 separate buildings, the gated community has pools, exercise rooms, central A/C and poor reviews on Google from tenants. Estimated rental income is $2.5 million with 50% expenses resulting in a forecasted $1.25 million NOI, which means the cap rate was 6.94%. For a detailed description of how New Orleans commercial real estate is value based on cash flow, see our article at https://louisianacommercialrealty.com/2012/04/how-to-value-commercial-real-estate/.
Baywood-288 units
Copyright, wwwlouisianacommercialrealty.com.
Sources: deedfax, court records, http://www.deltaacmllc.com/pressreleases.aspx
Drugs are a big money business. Especially legal drug stores like Walgreens. Who else could justify paying $94 per square foot for land and a beautiful building only to demolish the building? That's New Orleans commercial real estate at work utilizing the principal of highest and best use. The result is the most profitable businesses can make it feasible to acquire the best locations, driving the price to new market levels. Here is a secret to successful commercial real estate investing in New Orleans: the market value is based on the value of the business operating at that location, not on the previous sales of nearby property which is how most banks loan money-based on appraisal values.
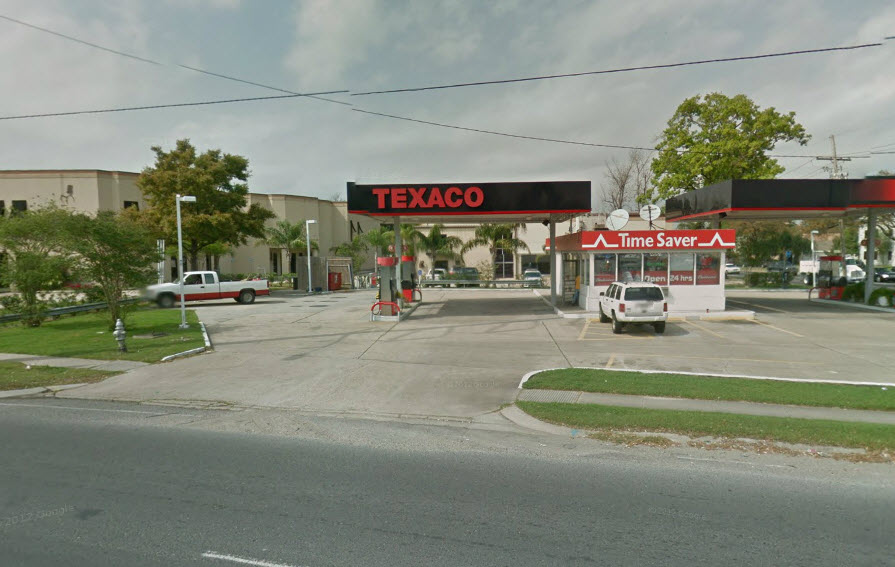
scandinavia site sells for $6.975mm
Walgreens Louisiana purchased the 63,000 square foot L-shaped site for $6 million from Hans Thomsen and Patsy Monk last month and didn't even get the corner 15,000 square foot Texaco site with it, which was purchased separately for $975,000. For other big money New Orleans commercial real estate transactions, see the latest report at https://louisianacommercialrealty.com/2013/03/big-money-new-orleans-commercial-real-estate-transactions-2013/.
The demographics are that good and the population count within a 5 minute drive time is not extraordinary, but the traffic count is between 40,000 and 60,000 cars per day at the intersection, shown below with the site outlined in red.

4513 Airline Highway-Future Walgreens
To find the traffic count for strategic locations in the state, go to http://www.dotd.la.gov/highways/tatv/default.asp. You can select the parish and a list of locations for a traffic count by year, updated to 2011. It is the most accurate database.
Copyright, www.louisanacommercialrealty.com; LOTD
For Immediate Release
New Orleans — March 29, 2013 — Robert Hand, CCIM, president of New Orleans based Louisiana Commercial Realty, discusses commercial real estate activity in tourist-oriented markets in the March/April issue of Commercial Investment Real Estate, the magazine of the CCIM Institute. Robert explains the challenges of commercial real estate development for local a vacant 8-story building on Canal Street, which is now called The Saint Hotel. The article is published at https://louisianacommercialrealty.com/2013/03/new-orleans-commercial-real-estate-expert-discusses-tourist-based-markets/.
###
![]() About the Louisiana Commercial Realty, LLC
About the Louisiana Commercial Realty, LLC
Based in New Orleans, Louisiana, Louisiana Commercial Realty, LLC is a top rated full service commercial real estate broker, licensed in Louisiana and Mississippi. We specialize in marketing large complex commercial real estate properties, and representing buyers of industrial, hospitality and retail sites. The president, Robert Hand, is the only commercial real estate broker in Louisiana with the CCIM and SIOR designations as well as an MBA.
