Putting a billboard on your commercial property might be the easiest $50,000 you ever made, but, first, don't let the billboard laws surprise you. Billboards located near a highway are highly regulated and competition is cutthroat among advertising companies because billboards are still a growing advertising medium, even with the decline of brick and mortar and the rise of social media ads through Facebook, Google, Snapchat, Instagram and Pinterest. The best thing about having a billboard on your property is that you don't have to do any of the work. The billboard company pays for the cost of the sign and maintenance and pays the property owner a monthly fee or a lump sum. Fees depend on traffic counts, but can start at $500 monthly in rural areas and $1,500 monthly in the city, or a lump sum from $50,000 to over $1,000,000. If you own vacant land with no income but high property taxes, getting the extra monthly income from a billboard can allow you to hold the land forever, or until development flows to your area and WalMart makes you an offer you can't refuse.
What You Would Never Expect When Getting A Billboard
Billboards near a highway are highly regulated by each state's department of transportation. The law controls billboards within 660 feet of the right-of-way of a highway. Cities, counties, and states are allowed to write their own billboard regulations which tie in with the Act, and each jurisdiction has their own zoning codes. A couple of states, Alaska and Hawaii, ban billboards altogether.
Spacing is usually the killer for the wannabe billboard developer. A city or county might allow billboards on land which fronts an interstate highway running through it or a couple of its busiest roads, but in Mississippi, for example, digital billboards require spacing at least 1,000 feet and regular billboards must be spaced 500 feet apart. The billboard permit, which usually takes one week to obtain, is issued usually by a state's Department of Transportation, but the surprise is that whoever makes the application gets the permit. This could be the landowner or the billboard company. Common practice is for billboard companies to send landowners a form giving the billboard company to apply for a permit without disclosing to the landowner that they can own the permit directly. Like most commercial real estate, those that have the most knowledge about a property always make the most money. Robert Hand, president of Louisiana Commercial Realty explains what is wrong about the billboard process:
Since a billboard permit prevents any other billboard from being erected within a certain space, billboard companies have an incentive to get several adjacent landowners to agree to give them permission to file a permit. The result could be that a billboard company can obtain control of a span of property, despite being owned by several different landowners, and have up to one year to decide to construct a billboard before the permit expires. This effectively "blocks out" any competing billboard company from getting a permit and erecting a billboard for that time.
Highway Beautification Act of 1965
It all started in 1965 with President Johnson. The cornerstone of the initiative would be the Highway Beautification Act of 1965, which called for control of outdoor advertising, including removal of certain types of signs, along the nation's growing highways. It also required certain junkyards along primary highways to be removed or screened and encouraged scenic enhancement and roadside development. The act also encouraged “scenic enhancement” by funding local efforts to clean up and landscape the green spaces on either side of the roadways. “This bill will enrich our spirits and restore a small measure of our national greatness,” Johnson said at the bill’s signing ceremony. “Beauty belongs to all the people. And so long as I am President, what has been divinely given to nature will not be taken recklessly away by man.” The Highway Beautification Act was actually the pet project of the first lady, Lady Bird Johnson. Beauty, she believed, had real social utility in that cleaning up city parks, getting rid of ugly advertisements, planting flowers and screening junkyards from view would make the nation a better place not only to look at but to live.
Federal Aid Highway Act of 1956 Created In Case Of Atomic Attack
President Dwight D. Eisenhower, paved the way for the 1965 act by spearheaded the Federal Aid Highway Act, which built a network of toll superhighways as a way of providing more jobs for people out of work. With an original authorization of $25 billion for the construction of 41,000 miles of the Interstate Highway System over a 10-year period, it was the largest public works project in American history through that time, and promoted using fear of a nuclear attack. On June 29, 1956, President Dwight Eisenhower signed the Federal-Aid Highway Act of 1956. The bill created a 41,000-mile “National System of Interstate and Defense Highways” that would, according to Eisenhower, eliminate unsafe roads, inefficient routes, traffic jams and all of the other things that got in the way of “speedy, safe transcontinental travel.” At the same time, highway advocates argued, “in case of atomic attack on our key cities, the road net would permit quick evacuation of target areas.” For all of these reasons, the 1956 law declared that the construction of an elaborate expressway system was “essential to the national interest.”
by Robert Hand, MBA, SIOR, CCIM
Lease prices for office space in the New Orleans/Metairie Metropolitan Statistical Area averaged $17.68 per square foot as of April 1, down 1.12% from last month but exactly the same price as one year ago, despite the fact that supply increased 1.53% with 3,749,980 square feet for lease compared to 3,693,478 square feet one year ago. There are 1,101 office properties for sale or lease and, of those, 961 are for lease and 140 for sale. Last month 20 office spaces were leased, which is below the average of 25 monthly for the last 2 years; however, there has been a wide range in the number of transactions over the last 2 years, from 12 to 49 office properties leased each month. The average office property is on the market for 291 days.
Market Prices For Sale Of Office Property
Sale prices for office space in the New Orleans/Metairie MSA averaged $105 per square foot as of April 1, down 3.5% from last month, despite the supply of office property for sale decreasing 40,788 square feet last month. Over the last year, office sale prices increased 2.8% while supply increased 183,296 square feet.
There are 140 office properties for sale, compared to 154 one year ago, resulting in a change in the market to larger office properties offered for sale, increasing the average to 11,259 SF from 9,045 SF one year ago.
For more information on prices, read our articles:
Louisiana Commercial Realty uses the latest technology to help clients uncover opportunities in commercial real estate, and we are constantly analyzing prices so our clients can be ahead of changes in trends. This article is the first in a series to provide an overview of average prices of commercial real estate.
We will drill down into prices and trends in New Orleans, Metairie and Baton Rouge, and review the top 7 sectors of commercial property, including:
Retail
Office
Shopping Center
Hotels
Land
Apartments
Warehouses
Prices of Retail Property - New Orleans
Chart: Prices of Retail Sector In New Orleans
Lease prices in New Orleans averaged $19.04 per square foot as of April 1, up 2.4% from last month but up 15% from one year ago, despite the fact that supply increased 37% with 766,000 square feet for lease compared to 558,000 square feet one year ago. There are 160 commercial properties for lease and 6 properties were leased last month, which is the average for the last 7 years; however, there has been a wide range of transactions, ranging from 2 to 18 properties leased each month. The average property is on the market for 355 days.
Sale prices in New Orleans averaged $144 per square foot as of April 1, down 2% from last month, but up 3% from 2 months ago. Despite the supply of property for sale increasing 37% to 388,000 square feet from one year ago, sale prices fell 1.5% during the sale period. There are 41 retail properties for sale, about the same as one year ago, resulting in a change in the market to larger retail properties offered or sale, increasing the average to 9,500 SF from 7,500 SF one year ago.
For more information on prices, read our articles:
Louisiana Commercial Realty has authored more real estate articles than any broker in the state, published by the top commercial real estate and financial organizations, including CCIM, SIOR, Chief Executive Officer, and Personal Financial Planning who distribute articles to thousands of their members.
This week, Louisiana Commercial Realty published another article, "8 Things To Do When You Get Code Violations", helping commercial real estate brokers advise their clients when properties encounter city code violations, and President Robert Hand explains:
"Code violations can be a costly problem for even the best looking commercial property and, if not handled properly, can not only result in expensive fines, but properties can be deemed blighted and can have liens placed on them. We have helped owners successfully navigate the maze at city hall, so we published an article using ur experience which will help other brokers be of more value to their clients because they will know what to look out for and how to handle these problems. We believe brokers can be of tremendous value to clients in providing knowledge and expertise when real estate problems arise, and this article is the latest in over 150 other articles where we use our experience to help other brokers and commercial property owners."
SIOR Is The Society of Industrial and Office Realtors
The publication was distributed to 3,200 members in 685 cities and 36 countries by SIOR (Society of Industrial and Office Realtors) , a prestigious, invitation-only, select group of the world's top performing commercial real estate brokers.
Louisiana Commercial Realty recently helped Dr. Rashonda Dean, Tulane University graduate and OB-GYN, open a new office in New Orleans East to provide badly needed women's health care services to the 60,000 people in the area. Dr. Dean has admitting privileges at Touro University and is one of 49 doctors there who specialize in Obstetrics and Gynecology, but she is the only Touro doctor to have an office in New Orleans East.
New $130 Million Hospital Can't Deliver Babies
Health care is improving in New Orleans East. Recently, the 60 bed New Orleans East Hospital, at a cost of $130 million opened to provide services in cardiology, colonoscopy, and orthopedics; however, the only women's services offered are mammography, ultrasound, bone density and general surgery. Where do women go when they need to deliver a baby?
Robert Hand, president of Louisiana Commercial Realty, explains how his company helped: As a commercial real estate broker, we have been working to revitalize New Orleans East for a decade now, and every day we fight the misperception that New Orleans East is not a good place to open up new businesses. The reality is that existing businesses are adding locations and new businesses are opening up, taking advantage of lowest rent rates and lowest prices on commercial property for sale. We helped Dr. Dean purchased a 4,000 square foot building at 5437 Crowder Boulevard, in great condition and ready to open as a doctor's office, for $175,000 and the same building in Metairie which averages $100 to $160 per square foot for office property, would have cost at least $400,000. New businesses are doing very well on Crowder, Read and Bullard, including a new Wal-Mart, Planet Fitness, Pizza Hut, Family Dollar, Dollar General, and CVS. As part of our marketing campaign, we reached out to professionals in the insurance, financial and medical industries. Since The New Orleans East Hospital does not provide services to deliver babies, we like the idea of OB-GYN Dr. Dean providing women's health care to the area. New Orleans East has a population of 60,00 people with 28,000 households averaging $42,000 annual income, and these are the workers in retail stores, restaurants and hotels that drive New Orleans' economy. Louisiana Commercial Realty is proud to do our part is improving women's health in New Orleans East.
by Robert Hand, MBA, CCIM, SIOR
In business school we are taught when the supply of any good or service increases, it will cause prices to fall, but even if you haven't studied economics you know when there is more of something, prices eventually drop. This is a basic law of economics, introduced in 1691 by philosopher John Locke and refined by Adam Smith in 1776 ; however, somebody forgot to tell New Orleans because for the last 4 years, despite the increase in supply of office space for lease, prices have actually gone up. This is bad news for entrepreneurs looking to move their home-based business out of the guest bedroom and into professional-looking offices so they can grow their business; and it is bad news for expanding businesses with lots of employees looking to add a New Orleans' location.
Office Market For Lease In New Orleans-2014 to 2018
New Orleans/Metairie Office For Lease Snapshot February 2018
There are 912 office properties with vacant available space for lease in New Orleans including Metairie, and in February 2018, 23 of those were leased at rates from $15 to $18 per square foot. But that is just a snapshot, and much like an income statement it does not really tell you the trend in price. So we researched 1,109 reported office lease transactions from 2014 to February 2018, and discovered supply, as measured by square feet listed of lease, increased from 1.6 million to 4.6 million square feet, but prices also increased from an average of $12 per square foot to $18 per square foot. The chart compares office square feet for lease in the X-axis with price per square foot in the Y-axis. The blue trendline in the chart above shows the formula for the data comparing change in supply in square feet to lease price:
Y=8E-07x+14.11
or
Y=(8/10,000,000)x+14.11
Using the slope of the trendline to determine the relationship between increasing square feet and price, we conclude that 8E-07x means for every 1,000,000 square feet of new office space available for lease that prices increased 80 cents per square foot.
How Can Prices Increase When Supply Also Increases?
Business Start-Ups In New Orleans Increase After Katrina
The increase in prices despite the increase in supply can only be attributed to a corresponding increase in demand to lease office space. This could be explained by demographics of more businesses starting in the New Orleans' area which drives the demand for leasing office space, or an increase in office lease prices in Metairie, which can compete with the New Orleans' market. In August 2015, The Data Center researched the trend in business start-ups in New Orleans and discovered new business start-ups doubled in the seven years post Katrina, flooding the city with entrepreneurs needing office space for their employees.
There are a few additional reasons why entrepreneurs are migrating to New Orleans, including a desirable low-cost of living, especially compared to San Francisco, a diverse culture, and hip events with a vibrant night life to keep millennials entertained. New Orleans offers a 25 percent tax credit for qualified digital media expenditures and 35 percent tax credit for qualified angel investors, which was capped by a senator in Lafayette but in 2017 revitalized interest from movie producers and software companies.
For more information on the office sale market in New Orleans, go here for our article: Office Lease Rate Trend vs. Sale Prices In New Orleans and Metairie
Prices for sales of office property have increased almost 20 percent per year the last few years while the office lease rate trend has stagnated, according to the latest research from the commercial property database Catylist. That's good news for new companies looking to get started with an address and lease office space and for existing companies who are outgrowing their current space. It is great news for office property owners who purchased just a few years ago and bad news for office property buyers today.
Chart of Office Sale Prices In New Orleans and Metairie MSA Since 2014-2018
The data show that sale prices have risen from $100 per square foot to $180 per square foot from 2014 to 2018, as measured by the orange line. Despite wide fluctuations from $50 per square foot to $350 per square foot, the average sale price has increased despite the supply also increasing from 500,000 square feet to 1,500,000 square feet. The data can also be used to calculate a trendline, shown in green, which determines the effect that the supply (measured in square feet) has on price.
Using X and Y Intercept and Slope To Look For Opportunities
The price data points in the above chart can be used to calculate a trendline which determines the slope or the rate of change in office sale prices. We use the formula:
Y=MX+B
where Y=Price Per Square Foot
M=Slope, or rate of change of X
X= Time
The trendline equation, Y=1.98X + 85.287, in the above graph shows that slope is 1.98, meaning each month that sale prices, on average, have increased $1.98 per square foot, so over the course of a year office sale prices increased approximately 24 percent and increased approximately 85 percent since July 2014. The bad news is that the other equation, called R Squared, shows how well the data fit the trendline, and only equal 15 percent. Normally you like to see 85 percent to have confidence that one set of data explains the second set of data. What this does help with is comparing prices of office sales to prices of office leases, which is explained below.
Office Lease Rate Trend
Prices for leasing office space in New Orleans and Metairie currently average $16 per square foot and have been at that level since 2014, except for a few months during that summer when both supply and price plummeted. There has been approximately 3,500,000 square feet of office space for lease (1,000,000 of this is downtown New Orleans Class A office space and 75% of that is full floor office space which is much more difficult to lease). Notice the green lease price trendline is almost flat and the R Squared value is only 3%.
Conclusion
The data gives us price points to help determine the current market for lease rates which is approximately $16 per square foot and the current market prices for office sales is $180 per square foot. These are snapshots at one moment in time. The trendlines tell us more valuable information, showing sale prices increasing 24 percent annually and lease prices flat. What we can conclude is that now is a great time to lease office space in New Orleans and Metairie since prices have not increased much, and the past few years have been a better time to own office property but purchasing office property now is more expensive, despite the fact that lease rates are flat. The reason sale prices are increasing is because cap rates have dropped. This is due to rising demand for income investments which is due to low treasury bond rates. Stay tuned for the next article on how to use convergent/divergent moving averages to know when the market peaks.
Recently the heavy rains caused high water in the streets of New Orleans which seemed to take forever to drain away, and since businesses were impacted by the lack of access by customers and also water damage to their equipment and inventor, TV station WWL interviewed Louisiana Commercial Realty for their expert opinion.
"Third time's the charm" is the saying, used usually after the first two failures, but Louisiana Commercial Realty has been successful three times in a row at helping engineering companies find the perfect home for their growing company.
Recently, Infinity Engineering, a highly successful and growing expert in marine construction with projects including a $25 million mooring dock and a $25 million bio-diesel plant, found a home at 4001 Division Street in a $1.48 million purchase of the 16,000 square foot Metairie warehouse and office space.
Louisiana Commercial Realty president Robert Hand explains,
"After Hurricane Katrina when FEMA funded rebuilding schools, libraries and hospitals, many local engineering firms were hired to work on the construction, causing them to rapidly outgrow their space. After the rebuilding died down, engineering firms needed to continue to grow and bid on larger projects, which resulted in firms needing more employees and thus more office space. Louisiana Commercial has been selected by several engineering firms to help. For example, we helped Landis Construction, who rebuilt most of the schools in New Orleans, find a corporate headquarters. They were tired of leasing and needed triple the size they previously occupied, and wanted it uptown. Well, large office buildings uptown are hard to find, but we found it. We also negotiated the sale of 16,000 square foot, two-story, 739 South Clark for $1.6 million to Pontchartrain Partners, one of the largest engineering firms in Louisiana with over 40 employees and 5 branches from Mobile to Dallas. More recently, we negotiated the sale of 4001 Division to Infinity Engineering for their corporate headquarters, bringing a vibrant growing company to Jefferson Parish."
Every Building Has A History
The building is believed to have been constructed in the 1970's by Dentsply, the world's largest manufacturer of dental products, including braces, root canal and teeth cleaning devices. The large warehouse space worked for Dentsply, but made the specialized building a difficult fit for most companies. On top of that, the zoning was recently changed from Business Commercial to Fat City, in an effort by city council to reduce the number of bars in what is normally a residential neighborhood and retail area close to Lakeside Shopping Center. The new zoning does not allow warehouses as a permitted use, but the property is allowed to continue use as a warehouse as long as it does not go vacant for over 6 months, which would require a new user to comply with the new permitted uses.
Overcoming Obstacles
Louisiana Commercial Realty had to overcome several obstacles in brokering the sale, from an unusual building to a zoning change that did not allow warehouses. The 16,000 square foot building was a hybrid 8,500 square foot warehouse and 7,500 square foot office. Normal warehouses that size have, at most, 500 square feet of office space and normal office buildings don't have any warehouse space. In addition, the warehouse was air-conditioned, which sounds great until you have to pay for the electricity bill. In addition, after presenting the seller with an offer to purchase the property, broker Robert Hand was told that seller had just leased the building to a movie company for $9,000 per month. Hand says, "Most sellers tell you ahead of time when they lease a building they want to sell, but we are professionals, so we worked through the issues and found a solution. That's what we do better than most."
For information on lease and sale prices of New Orleans warehouses and offices, read Market Trends.
For info on the movie industry read Are Movies An Economic Driver For New Orleans?
Recently Louisiana Commercial Realty teamed with Orleans Parish Assistant District attorney Michael Danon to get one more criminal off the streets of New Orleans. The crime occurred in 2014, and it took 3 years to get the criminal arrested and to court which culminated this month in a trial before Judge Camille Buras in Orleans Parish Criminal Court where criminal Christopher Karl Stephan pleaded guilty to felony theft and fraud, waiving his right to a trial and agreeing to be classified as a multiple offender. Under article 893, the criminal was sentenced to 2 years' suspended time and 2 years' probation but must register with the Department of Corrections. The defendant's attorney, Thomas Myers, also delivered a money order for compensation to the victim.
Why Spend 3 Years And 3 Times The Fraud To Get The Criminal Arrested
Robert Hand, president of Louisiana Commercial Realty, was prepared to testify as an expert witness, but since the criminal pleaded guilty, the judge proceeded directly to sentencing. Hand explained,
"Today we moved one small step closer to reducing crime in New Orleans. The assistant district attorney asked me: 'why would anyone spend 3 years and 100 hours and 3 times the amount of the fraud to get the case before a judge?' The answer is because it’s the right thing to do. My company is all about high ethical standards in real estate and this crime was real estate fraud. There is no end to how far I will go to do what is right and make sure others do the right thing also. It’s about values and what you stand for. I believe crimes for $100,000 start with crimes of $1,000 and even small crimes have to be stopped and have to be stopped today. But it was a team effort. The assistant district attorney did his part in not letting it fall through the cracks and 2nd district commander Paul Noel did his part in pushing it forward and Judge Cantrell did his part in issuing the arrest warrant and Judge Camille Buras did her part in sentencing. All we needed was a quarterback to keep the team together."
Hand was responsible for providing details of the real estate crime, and working the case through the criminal system. Here are the shocking details of a little crime that easily could have been forgotten but is a classic example of why crime in New Orleans has been high for decades.
June 2014-The Shocking Details
Hand reported the crime in June 2014, to the 2nd District police station for the uptown area where the crime occurred and also tried to file with police chief Gary Marshall in Pass https://www.cialissansordonnancefr24.com/ Christian, Mississippi, where the criminal lived, but the police would not accept a police report, saying it was a civil matter.
October 2014
Hand contacted the Mississippi Attorney General who said they did not have jurisdiction, but Hand was able to file in Harrison County Justice Court, which is similar to small claims court; however, the clerk of court was unable to serve the criminal a subpoena to command him to appear in court. The clerk said, “Apparently the defendant has moved and the sheriff serving the subpoena only has to make an attempt to serve. There is fee each time the sheriff even attempts to serve a subpoena.”
October 2014-Private Detective
Hand hired a private detective, who was able find the criminal by placing a real estate craigslist ad, and served the subpoena when the criminal responded to the ad. In October 2014, Judge Ladner issued an arrest warrant when the criminal did not show up for the court date as instructed in the subpoena.
About the same time, the New Orleans 2nd district police Detective Honore processed the report and asked Hand to come to the station to identify the perp. After showing Hand several old photos from what the officer thought were driver's license photos, Hand was unable to pick out the criminal from the old photos, leading Officer Honore to say she could not process an arrest warrant unless the criminal could be picked out. Hand provided a photo from the criminal's Facebook page and offered that photo for positive identification, but Officer Honore said the criminal had to be selected from the photographs provided by police.
November 2014-This Case Is A No-Brainer
Hand followed up with dozens of calls to the 2nd district captain and detectives, but was always transferred to a number with an answering machine. Hand was able to connect with another 2nd district policeman, Officer Rigamer, who said after seeing the evidence that the "case is a no-brainer", but Hand was never able to get phone calls answered or move the case along to get an arrest warrant issued until a new 2nd district commander was appointed, Paul Noel, who asked Detective James and Sargent Keller to review the file. By then, Hand had prepared a spreadsheet timeline, describing the situation and police inactivity which he sent to the district commander. In November 2014, assistant district attorney Andre Gaudin agreed to pursue the case as felony theft and contractor fraud, and was able to get Judge Cantrell to sign an arrest warrant.
3 Years Later-All Because Of A Traffic Stop
Three years passed without a word. In 2017, the perp was picked up in a traffic stop and when the arrest warrant popped up in his file, he was taken into custody. Assistant District Attorney Brian Ebard contacted Hand in July 2017, to say if the case goes to trial that the jury will be sympathetic, and suggested he let the criminal plead guilty to a misdemeanor and pay money. Hand staunchly refuted allowing a pleading to a lesser charge and demanded the assistant district attorney accept only a felony pleading.
September 2017-Finally In Court
In September 2017, Ebarb was out and assistant district attorney Michael Danon was in, and he reminded Hand of the same likely outcome of a jury letting the criminal go free. Hand asked to only allow a pleading to a felony not a misdemeanor.
Once the case got before criminal court Judge Camille Buras in October 2017, the perp saw the evidence against him and noticed Hand showed up in court to testify with documents. The 2nd district police officer did not show up to testify even though the assistant district attorney requested it. The criminal waived trial by jury and pleaded guilty to not only one felony, but two, and after sentencing was arrested again by sheriffs waiting in the courtroom for a different crime exceeding $100,000.
CCIM, the Certified Commercial Investment Member Institute, recently interviewed Louisiana Commercial Realty for their publication on entrepreneurs in commercial estate. Founded over 50 years ago, the CCIM Institute is commercial real estate’s most influential professional organization, with members closing $200 billion annually in commercial real estate deals. The CCIM designation represents the highest achievement in commercial real estate because it usually takes members 3 years to earn due to its rigorous education and testing requirements.
The CCIM Institute's award-winning magazine isCommercial Investment Real Estate which covers the latest analysis and insight into all facets of the commercial real estate industry. Recently their executive editor interviewed Louisiana Commercial Realty president Robert Hand on topics ranging from how entrepreneurs think differently to how they utilize technology to help clients make better decisions. Here are a few insights:
CIRE magazine executive editor Sara Patterson: Why did you decide to become an entrepreneur rather than join a large firm or franchise?
Hand:I worked in large commercial real estate firms for several years and always felt I could do a better job. The large commercial real estate platform added no value to me or for my clients and stifled my creativity. By owning my own firm, I can make immediate decisions and respond more quickly to market opportunities, providing a higher level of service to my clients.
CIRE: In what ways have you been able to set your business apart from your competitors?
Hand: I call it my competitive advantage. It is what I do differently than my competitors, and it is simply working harder but also smarter. I use the CCIM designation to give me access to resources so I can provide a higher level of services to clients. I rarely lose even in a competitive presentation for a listing because I put more thought into the highest and best use for the property and I use all the tools available through the CCIM Site To Do Business to really make an impact.
CIRE: Does your business have a specific niche? If so, what have you focused on?
Hand: Our specialty is that we generalize. Louisiana Commercial Realty is based in New Orleans which is a small market, so we work in all sectors of commercial real estate. The only sector we don't operate in is residential single family homes, and we refer that business to residential agents we trust. We specialize in large, complicated properties and have brokered the sale of the largest land disposition in the area, one of the largest industrial sales, assembled property for most of the new apartment developments, and negotiated the largest Class A office lease. I also own Mississippi Commercial Realty which is based in Hattiesburg, an even smaller market but with a thriving retail sector.
CIRE: How have you developed your team to support and to advance your business?
Hand: When I started my business, I wanted to keep my costs low so I did all the marketing research, advertising, web design, graphic design and presentations, contract drafting, and accounting. I even put up the for sale signs myself. I wanted control to produce the highest quality product, down to the smallest details. Now I have a support staff that works for me on a project basis as needed, and I handle all the sales. But I needed that early experience in each job function to be able to delegate and train support staff how to provide the same quality product.
CIRE: Has your business evolved into other sectors of commercial real estate? And have you expanded the type of clients beyond the local marketplace for your business?
Hand: We look for interesting projects where we can make an impact and are constantly working in new areas with new clients. There is a real need for the services we offer, and I am often told by clients that our advice and services are far beyond what other brokers are offering. We like to think we are good for the industry and try to help other agents even when they compete against us. I opened an office in Hattiesburg, Mississippi, because there is a growing retail sector there that is underserved. I look for markets where I can add value, and even though there is a "good ol' boy mentality" I usually find clients will do business with you over their high school buddy when you put more thought into their situation.
CIRE: How has your CCIM training helped you launch and expand your business?
Hand: It is the first thing I tell people I am considering working with. I explain what the CCIM designation is, and how it benefits clients. Hopefully, the CCIM Institute can get the word out so clients will start asking for the designation. The residential agents have a national lobby group, state lobbyists, and even city lobbyists, so the commercial real estate trade associations need to get on board.
CIRE: Do you use CCIM technology in your business? If so, how does it help you compete for clients with larger firms?
Hand: Yes, technology is a tool we always use to add value. The CCIM designation gives me access to technology through the Site-To-Do-Business database. I am able to create reports including the latest lifestyle demographics, pictometry satellite photographs, flood maps, consumer spending spreadsheets, infographics and market prices that we use in every presentation. It takes time to learn the technology and deep thought as to how to organize it, but it makes a commanding marketing plan and helps clients understand they are hiring a professional. But the secret is not just gathering information. I spent time in the appraisal industry, writing 100 page appraisals that required opinions and judgements in addition to data, and clients need that same honest judgement and somebody with real expertise putting serious thought into their situation and sometimes having difficult conversations but providing real insight because they have worked hard to add value to the relationship.
For published articles on commercial real estate by Robert Hand, read:
Louisiana Commercial Realty and its sister company Mississippi Commercial Realty recently talked with the University of Southern Mississippi to explore helping new medical research companies get a fast start with office space in the only Class A medical office building available in the Hattiesburg, Mississippi area. Mississippi Commercial Realty is exclusive leasing agent for the One Lincoln Parkway Medical Center and is holding talks with dialysis companies, laboratory research groups, cialis 5mg prix en pharmacie physicians and medical institutions who need to expand or start new businesses.
Mississippi Commercial Realty president Robert Hand explains,
"There is a real need for Class A medical office space in the Hattiesburg area to serve as incubator space and help new medical software and biotechnology prosper. Our vision as commercial leasing agent is to offer a physical space and resources that facilitate new developments in the medical industry. For example, we would like to offer research companies access to a state-of-the-art equipment library including leading edge microscopes and testing equipment. What this means is that start-up companies can utilize their resources on people rather than on assets."
Hand believes start-up companies need a high-end medical facility to attract the smartest employees who are at the core of creating new medical breakthroughs.
Recently, Chase Kasper, Assistant Vice President for Research and Technology Transfer at the University of Southern Mississippi toured the building and discussed the need for laboratory space when the university is awarded research grants, such as the recent $3 million award from the Department of Defense to encourage entrepreneurs toward innovation and creating commercial opportunities. Rather than using the grant funds to build a building, Kasper said there is a need to utilize existing medical space which allows research to start immediately. There may even be a need to utilize the medical office space as a classroom where students can intern with existing tenants Hattiesburg Clinic and Forrest Health, who are the largest medical providers in south Mississippi.
Hand says, "We are trying to think ahead and offer a medical facility where bright and creative tenants can have everything they need to make a real impact on the medical industry. We hope they create things that change the world and make the Hattiesburg area a leader in medical research."
Civil District Court Judge Bruno listened to both attorneys then made some notes and concluded "I find Louisiana Commercial Realty testimony credible and find the defendant, James Ramsey, tried to conceal the sale of property from the listing agent." The controversy occurred after seller Ramsey hired the listing agent but then secretly sold the 10 acre property on Read Road without disclosing it to the listing broker they hired.
The lawsuit is compounded by the fact that the sale was hidden for years so a hearing was required to first address how much time a person has to file a lawsuit and whether or not anyone knew about the wrongdoing. Normally 10 years is the time period allowed to file a lawsuit but if it concerns lost commissions the time period is shortened to 3 years. It's called prescription but not the kind a doctor gives you. It's the process of making claim to something. In this case, the seller hid the sale for longer than 3 years and claims the time allowed to file suit had expired.
The problem arises in commercial real estate when a buyer and seller collude to avoid paying an agent's commission. Since property sale information doesn't always find its way into the city assessor website, it can be years before a property sale can be discovered-if the buyer and seller hide the transaction. After hearing all the testimony, Judge Bruno ruled that seller Ramsey did conceal the sale of the 10 acre property for $1,500,000 during the listing period. The judge also ruled that Louisiana Commercial Realty exercised reasonable efforts and had discussions with Ramsey during the listing period. Judge Bruno ruled that the 3 year deadline to bring suit did not apply since the seller misled the listing agent.
The listing broker at the time, Robert Hand, explains:
"This is a victory for the commercial real estate industry which is vastly different from residential and also different in New Orleans than other cities because often the listing agent will spend years marketing a property before it sells. The commercial real estate industry depends on sellers being honest with us because we invest our time and pay for all the advertising up front and take the risk of working on property for years before something happens. I felt it the right thing to do to bring this case before the court and stand up for the commercial real estate industry in New Orleans and the entrepreneurial commercial property agents trying to put properties back into commerce and make this city a better place to live."
A plunging Louisiana unemployment rate to 5.2 percent means good times are back, right? Not so fast.
Even through the low unemployment rate was promoted not only by Governor Edwards, but also the Louisiana Workforce Commission, CNN Money, and US News & World Report, the fact is: things actually have gotten worse. If you work through the math and look at the facts, you will see why Louisiana has millions of disgruntled workers and why Trump got elected president.
It’s all in the math. True, the unemployment rate has dropped the last few years. Three years ago the rate unemployment rate was 6.80% and now it is 5.20%.
The deception is that we assume if the unemployment rate has decreased, then the number of unemployed has also decreased, and the number of employed has increased. The tweets and press releases boast how low the unemployment rate has fallen but we hear nothing about the actual numbers. And it’s not like we can’t track the data. The Bureau of Labor Statistics tracks the number of people in the labor force, number not working, working, and the hours and turnover, for the nation, each state, county or parish and city metropolitan statistical area, and does so by industry NAICS code. Be smart about where you get your news and this article will help. The data is there but you have to dig through it.
The data show the last 3 years that Louisiana employment decreased 55,468 during the same period when the unemployment rate fell. So how can the unemployment rate decline but the number of people working also decline? It’s all in the math, but you don’t hear about that. The unemployment rate is calculated as the number unemployed divided by the number in the work force. If the numerator (unemployed) declines, but the denominator (labor force) declines more, then the unemployment rate will fall.
The last 3 years saw the Louisiana labor force decline by 96,231, which explains how employment can decline by 55,468 but allow the unemployment rate to decline from 6.80% to 5.20%.
So what are the reasons for decline in the labor force? One could be a declining population. In the 2010 census, the population of Louisiana was 4,533,479 and estimates for last year were 4,681,666, an increase of 148,187 people or .53% annual growth. Estimates of population increase for the last three years have been around 75,000, so that can’t explain the labor force decline. Another explanation is how the labor force calculation excludes those who have "given up looking for work". They are called discouraged workers and are excluded for these reasons:
They believe no job is available to them in their line of work or area.
They had previously been unable to find work.
They lack the necessary schooling, training, skills, or experience.
Employers think they are too young or too old.
They face some other type of discrimination.
In summary, the last 3 years the Louisiana population increased approximately 75,000 and labor force declined 96,231. What would cause the labor force to decline during a period of increasing population? The best guess is the inability of baby boomers to keep up with a changing economy fueled by growth in technology. Add Louisiana’s 96,231 declining labor force workers to Michigan, Pennsylvania and Wisconsin to get the discouraged worker total high enough to generate 304 electoral votes that put Trump in office, and you'll start to understand what is happening to the US economy too. This technological change leaving millions of workers behind explains why GDP growth will never get back to the 4% Federal Reserve target and why banks are proud to say they can offer a whopping 1.6% interest rate on 4 year CD's. Until we retrain discouraged workers and put them back into the labor force, the US will never have more than a meager economy and soon will be left in the dust by stronger economies of China and India.
For more information on how the misleading unemployment rate defines our lethargic economy, read our articles:
The state of Georgia is one of the most efficient managers of its 2,000 office leases, with only a staff of 10 people each managing a portfolio up to 300 properties including renewals and expansions, plus new lease transactions.
Solutions To The Challenges of Managing Thousands Of Leases
Today, Louisiana Commercial Realty met with the State Properties Commission to discuss challenges and solutions to managing the multitude of lease contracts with such a small staff. Since the Properties Commission has most of the government agencies as clients, there are always state budget restrictions that sometimes conflict with the needs of the client so a strict process and procedure is followed which is not usually found with non-government office tenants. There are similarities however, such as competing stakeholders with different objectives, which often leads to conflict.
Robert Hand, president of Louisiana Commercial Realty, discussed solutions to conflict that arises from managing so many leases, and described several scenarios detailing how methods of communicating between the many parties involved can build trust. One technique discussed is when all parties, including the agent, landlord, future tenant, and attorney are first interviewed to discuss needs and then involved in developing a timeline and benchmarks.
Hand summarized, "First you meet with your client, who in this case is a state agency, to determine their needs, then you educate them on what works in the existing marketplace and within budget. You build trust by telling people what you are going to do, then doing it, then reminding them what you did."
Hand discussed how negotiating lease contracts can be simplified by categorizing the various lease terms and weighting their importance. In any lease agreement there are variables, such as the base lease rate, rent escalators, hours of access, after hours air conditioning costs, janitorial costs, tenant improvement allowances, renewal options and cancellation language. Identifying known and unknown risks among these variables can help a tenant determine where they are most vulnerable and negotiate in the lease to transfer that risk to the landlord.
How To Stay Organized To Be More Productive
Since each staffer manages up to approximately 300 leases, staying organized is a must. Hand shared technological strategies the staffers could use to stay organized, such as implementing a software system to track lease expiration and terms, recording discussions with vendors and clients, storing documents and each stakeholder's contact information. Staffers in the field can also use old school Microsoft Outlook to sync notes and appointments between iPhone and a laptop so being out of the office doesn't mean being out of touch.
For more information on managing office leases, read these articles:
The hotel and restaurant industries are the driving forces of the New Orleans non-government economy, employing over 75,000 people according to the latest numbers from GNO Inc. and Economic Modeling Specialists International. These hotel workers are an integral part New Orleans' ability to satisfy current tourism and while future growth requires even more hotels, that doesn't mean any old carpet bagger can build a hotel just anywhere in this city.
According to the National Travel and Tourism Office, the number of international tourists traveling to New Orleans grew by more than one-third last year, the largest one-year increase of any major U.S. city. One reason is the popularity of the WWII Museum, which is now the 4th most popular attraction in the United States. Tourism growth makes hotel development less risky which has attracted hotel buyers to consider New Orleans as a serious market. Sale prices in New Orleans are commanding up to $300,000 per room, nearly double their value prior to Hurricane Katrina in 2005. Although monthly RevPAR has slowed due to a lack of space for new hotel developments, annual figures show strong year-over-year growth, with $103 RevPAR in the Central Business District and the French Quarter experiencing a 67% increase over the last 5 years. Hotel occupancy rates are averaging 80% in New Orleans, exceeding the national average.
Table 1: Hotels In Progress Or Under Construction
Hotel Acquisition Process
Due to the lack of approved zoning for hotel use in the most popular tourism areas, developing hotels has become more complex. The French Quarter is not zoned for hotel use and only currently operating hotels are allowed. In addition, there are no hotels for sale that meet our criteria of at least 100 rooms.
Market Overview
Neighborhoods
The French Quarter is approximately 14 miles east of the airport and is the epicenter of tourism, holding 75% of all hotels in the city. The French Quarter neighborhood is no longer zoned for hotel development, so most new hotels are located in the Warehouse District, a 10 square block area, which is closer to the 1.1 million square foot New Orleans Convention Center.
Warehouse District and French Quarter
Canal Street separates the French Quarter and the Warehouse District, and properties fronting Canal Street are zoned for hotel use because technically they are outside the French Quarter. Starting in the 1980’s, Canal Street lost its attraction and Poydras Street, just three blocks away, became the new main street due to development of several class A office tower buildings.
Zoning Required
Hotels are only permitted in these zoning districts:
Hotels are a conditional use in HMC-2, HUMU, HI, CBD-5 and HMMU. No new hotels are permitted in the French Quarter which has various VCC zoning.
We Have Already Done The Research On The Best Potential Locations
Taking into account zoning permitted uses, demographics, traffic patterns, forecasted room rates, proximity to the Convention Center and the French Quarter, these locations are our best picks. Some sites are listed for sale and some unlisted. The best sites are usually purchased before they become listed. Some sites are privately owned and some are public property which can complicate the development.
1315 Gravier
Zoned CBD-7. 172 rooms, 120,000 SF, 12 story, on 27,000 SF lot, built in 1952 and renovated in 2000, and again in 2006 with a $6,000,000 project, but has been vacant since then. The existing building was certified as a historic structure in October 2006 by the National Park Service, qualifying it for Federal and State Tax Credits. Not listed for sale.
City Owned Parking Lot Near Jackson Square
The city of New Orleans owns and leases to the public approximately 50 retail spaces and parking lots in the French Quarter surrounding Jackson Square, the epicenter of tourism and a premier hotel location. There is a 5 block 100’ wide strip used as parking which would make the best hotel location in the city but it is not listed for sale and the city would have to put the property out for bid and make changes to zoning and obtain approval by the mayor and city council.
Fulton Place Garage
Zoned CBD-2. Purchased in 2011 for $6,500,000, eight stories with 36,000 SF footprint. Opposite the New Orleans Convention Center. Not listed for sale.
842 Magazine Street
Zoned CBD-5. 27,000 SF parking lot. Not listed for sale.
1000 Tchoupitoulas
Zoned CBD-6. High eave Boland Marine warehouse on 61,000 SF land. Not listed for sale.
902 St. Charles Avenue
Zoned CBD-3, 42,000 SF parking lot located one block from the World War II Museum, the newest attraction in New Orleans with almost 1,000,000 visitors annually, ranking it the 4th most popular museum in the US. Not listed for sale.
531 Poydras Street
25,000 SF parking lot. Zoned CBD-2. Previous site of planned Trump Hotel. Poydras Street is the main street in New Orleans, populated by the most Class A office towers. 531 Poydras is 3 blocks from Harrah’s Casino and the planned $364,000,000 Four Seasons development in the International Trade Mart at the foot of Poydras Street. Not listed for sale.
500 Poydras-Piazza D’Italia
Zoned CBD-1. Owned by the City of New Orleans but managed by the New Orleans Building Corporation, so the lease income can be donated to charities selected by the mayor. The 47,000 SF lot and public fountain was donated to the city in return for other land eventually developed into a hotel. The lot was once under contract to be developed as a Hard Rock Hotel but negotiations fell apart when the city was too restrictive.
222 Loyola
Zoned CBD-1, floors 6, 7 & 8, and part of lobby, totaling 52,000 SF. Listed for sale at $5,300,000.
Summary
The result is that most hotels are developed on the outskirts of the French Quarter where parking lots or warehouses can be acquired and re-purposed, but none are listed for sale; therefore, the best strategy is to identify unlisted sites and negotiate with the owner to sell the property. This requires identifying several potential sites with realistic expectations of being successful with only one or two. Developing a hotel in New Orleans requires creativity in adaptive re-use; for example, in one hotel development 4 vacant floors of Class A office tower were converted into Hyatt hotel space. Remember New Orleans is almost 300 years old and every inch has something built on it already.
Sources:
Downtown Development District
University of New Orleans
Bureau of Labor
https://www.bls.gov/regions/economic-summaries.htm#LA
Whether you rent office space, a warehouse, or a retail store, your lease probably has language that ties rent you pay to the Consumer Price Index. The idea is meant to benefit only the landlord, because the rental income retains its purchasing power. The problem is that there is more than one Consumer Price Index and there are different ways to calculate each, so make sure your lease agreement contains language that is very specific. One example of lease language referencing the CPI is:
The rental under this lease shall be four ($4.00) dollars per square foot for the first twelve (12) months, with annual adjustments tied to the Consumer Price Index (published by the Bureau of Labor Statistics, All Urban Consumers, Current Series, Index) for the previous calendar year period.
Five Things Every Lease Should Make Clear
It Is Clear Where The CPI Is Published-If rent is tied to an index, what index is used and where can you find it? The above lease language spells out that the rent is adjusted by the Consumer Price Index, and tells the information is published by the Bureau of Labor Statistics, which is found easily online.
It Is Clear What Type of Consumer Price Index Is Used-There are 4 methods used to calculate the Consumer Price Index:
All Urban Consumers (Current)-Consists of all urban households in Metropolitan Statistical Areas (MSAs) and in urban places of 2,500 inhabitants or more. Nonfarm consumers living in rural areas within MSAs are included, but the index excludes rural nonmetropolitan consumers and the military and the institutional population.
Urban Wage Earners and Clerical Workers (Current)-Consists of consumer units with clerical workers, sales workers, protective and other service workers, laborers, or construction workers. More than one-half of the consumer units income has to be earned from these occupations, and at least one of the members must be employed for 37 weeks or more in an eligible occupation.
All Urban Consumers (Chained)-The urban consumer population is deemed by many as a better representative measure of the general public because 90% of the country's population lives in urban areas. Using chained CPI means the rate at which Social Security benefits tick up would be slower, because it reflects substitutions consumers would make in response to rising prices of certain items. Therein lies the "chained" part of the name. The metric utilizes a basket of goods and services that are measured changes from month to month; much like a daisy chain. If the cost of a certain form of transportation goes up, for example, people might switch to another kind. This kind of "substitution" is part of what is factored into chained CPI.
Average Price Data- Calculated for specific items such as, household fuel, motor fuel, and food items from prices collected for the Consumer Price Index (CPI). Average prices are best used to measure the price level in a particular month, not to measure price change over time.
It Is Clear How The Adjustment Is Applied-The CPI adjustment can applied to a lease payment monthly, quarterly, or annually, but be clear about what period of CPI is used. It is best that landlord and tenant agree the CPI is for the previous 12 months and applied to the last rent payment.
It Is Clear Whether The CPI Is Adjusted For Seasonal Changes-The CPI can be adjusted for changing climatic conditions, production cycles, model changeovers, holidays, and holiday sales which can cause variation in prices. For example, oranges can be purchased year-round, but prices are significantly higher in the summer months when the major sources of supply are between harvests.
It Is Clear Whether The CPI Is National or Local-The CPI publishes unadjusted price indexes at the national, metropolitan area, and regional levels. So you could drill down and calculate your CPI based on your city's MSA. This would be more meaningful if your economy is an outlier, such as Houston, Detroit, or New Orleans.
How Is The CPI Calculated
In calculating the CPI, the urban portion of the United States is divided into 38 geographic areas called index areas, and the set of all goods and services purchased by consumers is divided into 211 categories called item strata. This results in 8,018 (38 × 211) combinations.
The CPI is calculated in two stages. The first stage is the calculation of basic indexes, which show the average price change of the items within each of the 8,018 CPI item-area combinations. At the second stage, aggregate indexes are produced by averaging across subsets of the 8,018 CPI item–area combinations.
Percent changes for periods other than 1 year often are expressed as annualized percentages. Annualized percent changes indicate what the change would be if the CPI continued to change at the same rate each month over a 12-month period. These are calculated using the standard formula for compound growth:
What Is Included In The CPI
The CPI represents all goods and services purchased for consumption by the reference population with all expenditure items divided into more than 200 categories, arranged into eight major groups. Major groups and examples of categories in each are as follows:
FOOD AND BEVERAGES (breakfast cereal, milk, coffee, chicken, wine, full service meals, snacks)
APPAREL (men's shirts and sweaters, women's dresses, jewelry)
TRANSPORTATION (new vehicles, airline fares, gasoline, motor vehicle insurance)
MEDICAL CARE (prescription drugs and medical supplies, physicians' services, eyeglasses and eye care, hospital services)
RECREATION (televisions, toys, pets and pet products, sports equipment, admissions);
EDUCATION AND COMMUNICATION (college tuition, postage, telephone services, computer software and accessories);
OTHER GOODS AND SERVICES (tobacco and smoking products, haircuts and other personal services, funeral expenses).
What Does Yesterday's Release Of The CPI Tell Us
The Bureau of Labor Statistics, under the Department of Labor, released the latest Consumer Price Index numbers yesterday, using the All Urban Consumers Index which increased 0.2 percent in August, but this was for only one month and it was not seasonally adjusted. The seasonally adjusted number increased 0.3 percent, the largest increase in 6 months, due to increases for shelter and medical care.
Some August prices increased while others decreased, which is why the CPI can be misleading. The indexes increased for motor vehicle insurance, apparel, communication, and tobacco; however, the indexes decreased for used cars and trucks, household furnishings and operations, recreation, and airline fares.
These numbers are only for the month of August, and leases should use the annual number. The all items index rose 1.1 percent for the 12 months ending August. The index for all items less food and energy rose 2.3 percent for the 12 months ending August. The food index was unchanged over the last year while the energy index declined 9.2 percent.
How Much Difference Can 1 Percent Make
Inflation is not what it used to be. In the 1980's the CPI approached 20% and the greatest economist alive said it was going to 25%. It went to 2%. Our economy today is driven by a different wage/price spiral and low inflation helps borrowers and hurts landlords and savers. Building in a CPI adjustment can still make a difference in a long term lease, as shown in the table below which compares a 1 percent CPI to a 2 percent CPI adjustment over a 25 year time frame. A 1 percent incremental rate increase annually results in $378,000 additional income over the 25 year span, and assuming a 10 percent Capitalization Rate, increases the market value of the property $338,000, or 33%.
Summary
In leasing any type of property, whether you are the landlord or the tenant, make sure your lease is clear about what the rent is, and what inflation adjustments apply to the rent. Any lease document can be revised, even though some parties say they use a standard lease. There is no such thing. A lease is an agreement between two parties, and you should revise it to include language that works for you. As always, consult an expert.
Free Lease Consultation: If you have questions about a lease document, Louisiana Commercial Realty offers a free lease review, which includes an analysis of nearby rental market prices.
Katrina, Harvey and Irma Increase Flood Insurance Awareness
Normally when people ask if an area floods they are talking about heavy rains causing water to pool in the streets until the city pumps can suck the water down the drains and into the Mississippi River, but since Hurricane Katrina caused the levees to fail and flood the city with water from Lake Pontchartrain, and Harvey soaked Houston with 50 inches for 4 days, and Irma storm-surged from Miami to Tampa, flood insurance has become more than a luxury. Forget about global warming and let's study the foundation of flood insurance called the FEMA flood map; this article discusses everything you need to know, but were afraid to ask, including step-by-step guidance on how to read a flood map and create your own for any location.
Protecting residents from the financial loss due to flooding, no matter whether it is from heavy rains or levee breaches, dates back to 1968 when Congress created the National Flood Insurance Program, giving the responsibility to the Federal Emergency Management Agency (FEMA) for producing Flood Insurance Rate Maps that show areas subject to flooding based on historic, meteorological, hydrologic, and hydraulic data.
What’s In a Flood Map?
The Flood Map provides information that allows you to identify not only Special Flood Hazard Areas but the Base Flood Elevation at a specific site, as well as areas of undeveloped coastal barriers where flood insurance is not available.
Flood Maps provide a wealth of information, including:
Common physical features, such as major highways, secondary roads, lakes, railroads, streams, and other waterways.
Special Flood Hazard Areas.
Base Flood Elevation.
Flood Insurance Risk Zones.
Areas subject to inundation by the 500-year flood.
100 Year Flood Zone Is Really a 26 % Chance
A 100-year flood is not a flood that occurs every 100 years, but one that has a 26 percent chance of occurring during a 30-year period, the length of many mortgages. The 100-year flood is a regulatory standard used by Federal agencies and most states, to administer floodplain management programs, and is used by the National Flood Insurance Program (NFIP) as the basis for insurance requirements nationwide. Special Flood Hazard Areas (SFHA) are those areas having at least a 1 percent chance of flooding during any one year. Flood Maps are easy to get and are found online at FEMA's Map Service Center, http://www.msc.fema.gov.
How to Read a Flood Map
Step 1: Finding the Parish/County.
To discover the flood risk in your vicinity and use the Interactive Web Mapping Portal, first start with the general area such as the target property's parish or county. For example, in New Orleans, choose a Parish from the list below by clicking the a link:
Jefferson Parish, Orleans Parish, Plaquemines Parish, St. Bernard Parish, St. Charles Parish
Step 2: Finding the Specific Location of the Property.
Let's say we want flood zoning information on the Mercedes Benz Superdome in New Orleans, so we click on Orleans Parish, and when the map opens up, type in the target address in the box at the top left. The address for our target property, the Superdome, is 1500 Sugar Bowl Dr, New Orleans, LA 70112.
Step 3: Check Interactive Map Choices
Since the map is interactive, you can select a variety of options including satellite view, preliminary or effective map and panel or address view. Uncheck any pre-checked boxes in the panel on the left, and check Address Search Result, Flood Hazard Areas and select the radio button Google Hybrid as shown below:
Step 4: Identify the Flood Insurance Risk Zone and Base Flood Elevation.
Click the Identify icon at the top of the screen. It looks like a white (i) in a blue circle. If you hover over it, the function will pop up.
Then click on your target site to generate a pop-up box showing the Base Flood Elevation, Flood Zone, Panel Number.
The box details the flood map panel number, the Special Flood Hazard Area (SFHA) chance of increase or decrease, the Preliminary and Effective Flood Hazard Area (AE) and the Effective Base Flood Elevation (2 Feet).
Explanation of Flood Zone Designations
Zone A: This zone has a low risk of erosion and can experience breaking waves less than 1.5 feet. No base flood elevations are calculated.
Coastal Zone A: This zone is subject to erosion, fast and strong water movement, and wave heights of 1.5 to 3 feet during storm events. Base flood elevations are calculated for these zones and displayed on flood maps. Communities have the option of adopting more stringent building codes (up to V Zone standards) in this zone, which would give them points in the Community Rating System. This zone is relatively new, so it may not be applicable to your community’s current flood maps. On the new maps, the landward edge of the zone is marked by the LiMWA line (Line of Moderate Wave Action). An elevation certificate is required to accurately calculate insurance rates in this zone.
High Risk (Special Flood Hazard Area)
These zones make up the Special Flood Hazard Area and are in the 100-year-flood zone. They have at least a 1% chance of flooding each year and at least a 26% chance of flooding over the lifetime of a 30-year mortgage. Structures located in these zones with a federally-backed mortgage are required to purchase flood insurance. On a flood map these zones are referred to as the letters below or, collectively, as the 1% annual chance or 100-year-flood zone.
Zone AE or Zone A1-30: This zone has a low risk of erosion and can experience breaking waves less than 1.5 feet. Base flood elevations are calculated and displayed on flood maps. AE zones are present on newer maps; zones A1-30 are present on older maps. An elevation certificate is required to accurately calculate insurance rates in these zones.
Zones AH, AO, AR, A99: See FEMA’s Map Service Center definitions. The flood insurance rate zone that corresponds to areas of the 100-year floodplains that will be protected by a Federal flood protection system where construction has reached specified statutory milestones. No Base Flood Elevations or depths are shown within this zone. Mandatory flood insurance purchase requirements apply.
Zone V: This zone faces an additional hazard from erosion, fast and strong water movement, and waves that may be 3 feet or greater during storm events.
Zone VE or V1-V30: These zones face an additional hazard from storm waves, and can experience waves greater than 3 feet. Base flood elevations are calculated for these zones and displayed on flood maps. VE zones are present on newer maps; zones V1-30 are present on older maps. An elevation certificate is required to accurately calculate insurance rates in these zones.
Moderate Risk
Zone X (shaded) and Zone B: The area between the extent of the 100-year-flood (1% annual chance flood) and the 500-year-flood (0.2% annual chance flood). There is no base flood elevation calculated for these zones, so elevation certificates are not necessary. Flood insurance could be much cheaper in these zones because of the lower risk. These areas are not subject to the mandatory purchase of flood insurance.
Minimal Risk
Zone X (unshaded) and Zone C: The area outside of the extent of the 500-year-flood with minimal flood risk. If a structure is located in this zone, however, it does not mean that it is out of harm’s way. The risk determination is based on probability, and the probability of a flood reaching this area is low, but it is not impossible. There is no base flood elevation calculated for these zones, so elevation certificates are not necessary. Flood insurance could be as much as 50% cheaper in these zones because of the lower risk. These areas are not subject to the mandatory purchase of flood insurance.
Undetermined Risk
Zone D: Areas classified as Zone D have not had a flood hazard analysis performed. These are often areas with very low population counts.
How To Make Your Own FIRMette, The FEMA Flood Map
If you need the actual Flood Map, one is available at the FEMA Flood Map Service Center, then enter the target property's address.
and click the View Map icon as shown below.
The actual FEMA flood map is not in color as shown below. Click Make A Firmette
Drag the green viewer box over your target area, and click Create FIRMette Adobe PDF.
The final product is a FEMA flood map. This map is panel number 225 203 0160E, dated March 1, 1984, showing the Superdome is in Zone A1 but close to Zone B. Zone A1 is on the older maps and is the same as Zone AE on the newer maps.
It’s a Government Product, So Two Maps Are Better Than One
FEMA updates flood maps on a community-by-community basis so all maps are not exactly the same, differing in both format and content. The two basic paper formats used for flood maps are a Flat Flood Map and a Z-Fold Flood Map, but every flood map has several basic elements:
Index
Panel
Title box
Legend
Standard symbols
Since the geographic coverage of a Flood Map may be quite large, FEMA divides an area into sections called panels and includes an index to indicate what areas are shown on each map. A Flat Flood Map consists of one or more 11"x17" pages and a cover sheet that includes an index and a legend. A Z-Fold Flood Map is a one or more panels that is folded like a highway map and have a legend and index. While panels that make up a geographic area are considered one flood map and can include all of these jurisdictions: parishes, towns, townships, cities, incorporated areas and unincorporated areas have separate flood maps.
In addition to the two basic formats, flood maps also have several basic elements:
Title Block: Found on each Panel (or page), the title box contains the community name, the panel number (page number), date, and other information necessary to identify the flood map panel.
The Legend: Found on Z-fold flood maps, the legend provides information for identifying the risk zones and/or floodway on the flood map.
The Body: The body of a flood map displays the map contents. On an index, the body will usually only display primary features like major roads, corporate limits and other general landmarks that help to identify location. On a panel, the body will show more detail than what is shown on the index, including secondary roads, bridges, and flood hazard information.
Community Name: The title block displays name of the mapped community, the town, city, parish, and state. When the mapped community is a parish, the words "Unincorporated Areas" often appear below the parish name. This indicates that the incorporated areas in the parish area not covered by the flood map. When the flood map covers the entire geographic area of the parish, the words “Incorporated Areas" appear after the parish name.
Community Number: The Community Number is a six-digit identification number assigned to the mapped community. This number is also referred to as the community identification number (CID). You need to use the community identification number when you ask FEMA staff questions about a Flat Flood Map or a Z-fold Flood Map for an individual community and when your order a flood map from the Map Service Center.
Corporate Limit or Parish Line: The Corporate Limit or Parish Line identifies the jurisdictional limits of the community's regulatory authority over land development and building construction. In some states, an incorporated community may exercise extraterritorial jurisdiction over land development and building construction in areas beyond its corporate limits. Where appropriate, these limits are shown and labeled on the index.
Panel Limit Line: This line reveals the extent of the area covered by each panel shown on the index.
Panel-not-Printed Notes: These notes identify the panels included in the flood map layout that are not printed and explain why they are not printed. For instance, when a panel covers an area of the community that falls entirely in one flood insurance risk zone, that panel may not be printed, and an explanatory note is added to the index. If all panels are printed this annotation is omitted.
Effective or Revised Date: This is the date the new or revised flood map becomes effective for flood insurance and floodplain management purposes. Partial revisions are common and the inside of the index will show the suffix of each panel to determine what has been revised. New parishwide indexes will have effective dates printed on each panel.
List of Printed Panels: This list identifies those panels that are printed, but not necessarily revised. Partial revisions are common and the inside of the index will show the suffix of each panel to determine what has been revised. New parishwide indexes will have effective dates printed on each panel.
Map Repository Address: This is the address of the official community office where reference copies of the flood map and Flood Insurance Study report are stored and made available.
In addition to these items, there are 14 more elements that may be found on flood map panels:
Area Not Included Label
Base Flood Elevation
Coastal Barrier Area
Elevation Reference Marks
Floodplain Boundary
Hazard Area Designation
Map Scale
Panel Number
River Mile Marker
Stream Line
Zone Designation
Zone Division Line
Flood Insurance Risk Zone Label
For more information on flood maps, read our article Flood Zoning For Dummies, and choose from over 150 articles on commercial real estate.
Glossary Terms
1-percent annual chance floodplain
This is the boundary of the flood that has a 1-percent chance of being equaled or exceeded in any given year. Also known as the 100-year floodplain.
1-percent annual chance water-surface elevation
The height, in relation to the National Geodetic Vertical Datum of 1929 (or other datum, where specified), of the flood having a 1-percent chance of being equaled or exceeded in any given flood year (also known as the 100-year flood or the base flood).
100-year flood
The flood having a 1-percent chance of being equaled or exceeded in any given year; also known as the base flood. The 1-percent annual chance flood, which is the standard used by most Federal and state agencies, is used by the National Flood Insurance Program (NFIP) as the standard for floodplain management and to determine the need for flood insurance. A structure located within a special flood hazard area shown on an NFIP map has a 26 percent chance of suffering flood damage during the term of a 30-year mortgage.
100-year floodplain
This is the boundary of the flood that has a 1-percent chance of being equaled or exceeded in any given year. Officially termed the 1-percent annual chance floodplain.
500-year floodplain
This is the boundary of the flood that has a 0.2-percent chance of being equaled or exceeded in any given year. Officially termed the 0.2-percent annual chance floodplain.
Backwater
The effect of downstream flow on the water-surface profile.
Base Flood Elevation (BFE)
The height of the base flood, usually in feet, in relation to the National Geodetic Vertical Datum of 1929, the North American Vertical Datum of 1988, or other datum referenced in the Flood Insurance Study report, or depth of the base flood, usually in feet, above the ground surface.
Channel Bank Stations
Points that identify the extreme limits of the natural stream channel. These stations are typically assigned at locations along a cross section where a relatively flat area exists outside of the channel.
Confluence
A location where two streams or rivers meet.
Contour
A line on a map joining points of equal altitude.
Critical Depth
The depth of flow at which, for a given discharge at a given location, the total energy is the minimum value possible for flow to occur.
Datum
A fixed starting point of a scale.
Federal Emergency Management Agency (FEMA)
An independent agency of the Federal government, founded in 1979, which reports directly to the President. FEMA is responsible for identifying and mitigating natural and man-made hazards. The agency's mission is: to reduce loss of life and property and protect our nation's critical infrastructure from all types of hazards through a comprehensive, risk- based, emergency management program of mitigation, preparedness, response and recovery.
Flood
A general and temporary condition of partial or complete inundation of normally dry land areas. For flood insurance claim purposes, two or more structures must be inundated before flood damage will be covered.
Flood Boundary Floodway Map (FBFM)
A pre-Map Initiatives floodplain management map that delineates the 100-year (1% annual chance) and 500-year (0.2% annual chance) floodplains, floodway, and cross sections.
Flood Insurance Rate Map (FIRM)
A map on which the 100-year (1% annual chance) and 500-year (0.2% annual chance) floodplains, Base Flood Elevations, and risk premium zones (and floodway information on Map Initiatives FIRMs) are delineated to enable insurance agents to issue accurate flood insurance policies to homeowners in communities participating in the National Flood Insurance Program.
Flood Insurance Study (FIS)
An examination, evaluation, and determination of flood hazards and, if appropriate corresponding water-surface elevations. The resulting reports are used to develop Flood Insurance Rate Maps. Also know as a flood elevation study.
Floodplain Management
The operation of a program of corrective and preventative measures for mitigating flood damage, including, but not limited to, emergency preparedness plans, flood-control works, and floodplain management regulations. Floodway Channel of a stream plus any adjacent floodplain areas that must be kept free of encroachment so that the 100-year flood discharge can be conveyed without increasing the elevation of the 100-year flood by more than a specified amount (1 foot in most states).
Special Flood Hazard Area (SFHA)
Area inundated by the base (1-percent annual chance) flood, identified on the Flood Insurance Rate Map as Zones A, AE, AH, AO, AR, V, VE, or A99.
Elevation
The height, in relation to the National Geodetic Vertical Datum of 1929 (or other datum, where specified) of floods of various magnitudes and frequencies in the identified floodplains of coastal or riverine areas.
Additional information can be found at:
Federal Emergency Management
Agency Map Service Center
P.O. Box 1038
Jessup, Maryland 20794-1038
Telephone: (800) 358-9616
Fax: (800) 358-9620
http://www.msc.fema.gov
In addition to the loss of life, jobs, savings, and disrupted families, the victims of Hurricane Harvey will have to deal with the loss of their property and the numbers are staggering. Satellite maps from Reuters show 30,000 properties flooded valued at 23 billion, with 26 percent land only but 74 percent are homes and commercial properties including shopping centers, office buildings and warehouses. The University of Colorado research shows flooding in Harris County over 231 square miles and 51 square miles in Galveston County.
Dartmouth, University of Colorado and Reuters Flood Map
Analysis of Affected Overall Commercial Property
There has not been any flooding in Houston in 16 years, and homeowners without mortgages or homeowners outside the 100 year flood zone do not have to carry flood insurance. Estimates of damage are starting to come in and, combining residential and commercial property damage, the total could exceed $100 billion. Previous flooding disasters according to the National Oceanic and Atmospheric Administration estimate Hurricane Katrina in 2005 caused $160 billion in damage, Hurricane Sandy in 2012 caused $70 billion, and Hurricane Ike in 2008 caused $34 billion.
Chart of Disaster Costs
Houston is the 6th largest Metropolitan Statistical Area in the United States and has 12,000 commercial properties in 433 million square feet inside the flood plain, including:
167,281 apartment units,
60 million SF of office space
73 million SF of retail space
11 hospital buildings, including a 1.1 million square foot building at the Texas Medical Center
FEMA estimates 225 million square feet of building area is Within the 500 year flood plain
map FEMA floodplain exposure
Analysis of Affected Apartment Market
Southwest Houston is where most of the commercial property is flooded, with 30 percent of the 66,000 apartment units impacted. Within Southwest Houston, the Braeburn, Greater Fondren and Sharpstown neighborhoods have the highest number of units that are in the 100-year floodplain. Each of these neighborhoods borders Brays Bayou which snakes through southwest Houston and has overflowed as a result of the 50 inches of rain. Of the $55 billion at risk, apartment assets account for $16 billion, including $6.8 billion in the 100-year floodplain. There are 3 apartment properties in this area that are valued at $100 million each.
chart apartments affected
An additional 25 million square feet of commercial space is under construction in Houston, including more than 12,000 apartment units and approximately 25 percent or 5 million square feet is within the flood plain, with 1,170 units alone under construction near the Medical Center.
Analysis of Affected Office Market
chart affected office market
The most impacted office submarket is Greenspoint, with 3.5 million square feet within the flood plain, and already experiencing high vacancy rates since 2015 when ExxonMobil left the area.
Army Corps of Engineers Releasing More Water, Possibly Damaging 2.5 Million Square Feet of Office Property
In addition to the flood water, more water is coming from a nearby reservoir, released through Buffalo Bayou by The Army Corps of Engineers to prevent the earthen dams supporting these reservoirs from failing. The Bayou runs west to east and crosses through Woodlake, River Oaks, the Energy Corridor, Memorial Park, Briarforest, and Uptown Park. There are approximately 117 buildings totaling 17 million square feet within 1,500 feet of the bayou, and more than 2.5 million square feet of mostly office space in the Energy corridor and Post Oak neighborhoods is at high risk since it is located within the 100-year floodplain.
Sources: FEMA, University of Colorado, CoStar, NOAA, Dartmouth, Reuters
Whether you rent office space in Class A towers or a warehouse to store inventory or retail space for your coffee shop, your lease with the landlord probably has terms that are not good for you but that you agreed to anyway. Just make sure your lease renewal doesn't have the three most common mistakes. Even small mistakes can be very costly unless your lease language is clear on every detail.
Most Leases Include Price Increases Tied To The Consumer Price Index
The history of linking rent payments to inflation became strategic in the days of 1970’s high inflation, when the OPEC oil embargo caused oil prices to skyrocket. When higher oil prices combined with the wage-price spiral, the result was an overnight jump in inflation from 3.2% in 1972 to 11% in 1974. This caused landlords to realize that rental income did not retain its purchasing power, which is the economic theory that a dollar in the future should buy the same amount of goods as it does today. Today it is common practice for leases to include consumer price index (CPI) language to protect landlords, but the problem is that there is more than one Consumer Price Index and there are different ways to calculate each. Even sophisticated tenants and landlords depend on experts to advise them in lease negotiations.
Make Your Lease Clear How The CPI Is Calculated
Here is lease language for a medical property that makes the CPI data source very clear:
Consumer Price Index: It is further understood and agreed by and between Lessor and Lessee that, commencing with the first day of the second year of lease, the monthly rental as set forth above will be adjusted upwards at the beginning of the second lease year, and every year thereafter until expiration or termination of the lease using the all urban consumers (CPl-U) United States City Average, All Items, (1967=100)published by the Bureau of Labor Statistics, United States Department of Labor (referred to as "Consumer Price Index").
Compounded or Added Together?
Table showing annual compounding at 3% rate
Always compound if you are the landlord and never compound if you are the tenant. When adjusting for the CPI, it makes a difference if you add the inflation rate for each year rather than multiply the rate by the previous year. Assume a 5 year lease renewal where the CPI was 3% each year for the previous 5 years. Some landlords multiply 5 years times 3% to get 15% for the increase. For a large property with rent income of $100,000 annually, the adjusted rent would be $115,000; however, if the lease is written so the CPI is compounded, meaning each new year is applied toward the previous year’s CPI, the result is rent of $115,927 in year 5. Your lease renewal should spell out how the CPI is calculated.
How CPI Adjustments Affect Property Value
cpi all urban consumers index annually since 2007
Our economy today is driven by a different wage/price spiral which causes low inflation. This helps borrowers but hurts landlords and savers. One strategy utilized is to build in a fixed rate adjustment in addition to a CPI adjustment because the challenge for landlords is that the CPI since 2012 has averaged 1.3%. The current CPI doesn’t keep up with 3% average annual medical care increases.
One strategy that benefits landlords is to include lease language stating the rent adjusts based on the CPI or a fixed rate, whichever is higher. The 30 year table below shows how, during an extended period of low inflation, this strategy can dramatically increase the market value. This lease would include language with adjustments based on the CPI, which we assume in this scenario will continue at the average 1.3% annual rate, compared to a fixed rate of 3%. The result, assuming current rent income of $100,000, would be to increase rent by $95,399 in year 30, which at an 8% cap rate adds $1,192,486 more market value to the property.
Summary
In conclusion, make sure your lease language details how your rent is adjusted. You can design your table data at the Bureau of Labor website and, if you need help, their phone number is shown on the data release. If you call the number on the press release, the analyst who produced the CPI report will answer any questions. If your property is in outlier data cities such as Detroit, Houston or New Orleans, you can even produce a local Consumer Price Index. Remember to make sure your lease is clear about what CPI is used, how it is calculated and whether you compound your rate, which is why many tenants and landlords hire an expert to advise them. Remember, mistakes can be costly.
Louisiana Commercial Realty and its sister company, Mississippi Commercial Realty, were hired recently to market the only Class A medical office center in Hattiesburg, Mississippi, known as One Lincoln Parkway Medical Center. The ADA compliant medical office building is 85,000 square feet on three floors and is home to the major health providers in the Hattiesburg area. The building was constructed in 2005 and offers wrap-around parking for 200 cars, and portico access on all four sides for easy access by patients. Current tenants include Forrest General Hospital and Hattiesburg Clinic, the two major health care providers in the 14 county market surrounding Hattiesburg.
Mississippi Commercial Realty was hired to market the property after London and Stetelman Realty was unsuccessful for over a year in finding tenants for four vacant office spaces in the building. Mississippi Commercial Realty President Robert Hand explains,
" Many property owners come to us for two reasons. One is that we are a dominant commercial real company in both Louisiana and Mississippi since we offer the comprehensive services of not only Mississippi Commercial Realty but also Louisiana Commercial Realty. What that means for our clients is that they get two firms working for them for the price of one. The second reason people hire us, and it is sometimes after other commercial real estate firms have been unsuccessful with their property, is that we put more thought into a client's property and tailor-make a solution to solve their problem. For example, with One Lincoln Parkway Medical Center, we researched the market to see what medical services are needed in the Hattiesburg area and pursued those as our target markets. Rather than wait for them to call us, we identified tenants that Hattiesburg needs and we went after them. We are currently working to bring in a dialysis clinic for people with kidney problems."
"The days of putting a sign out front of a property are gone, and property owners need to be smart about the image their property has in the community" says Hand, " Every property has a brand, whether the owner realizes it or not. By being proactive and taking control of your brand, property owners can create demand that would not exist otherwise."
For more information about the Hattiesburg, Mississippi market, click here.
Louisiana Commercial Realty has been ranked among the top 100 commercial-only real estate brokers in the Gulf South area, including northwest Florida, Alabama, Mississippi and Louisiana, having been inducted into the Society of Industrial and Office Realtors, which is an invitation-only international organization of the top ranked commercial real estate brokers in 630 cities and 34 countries. SIOR members are specialists in the office and industrial markets and must meet stringent requirements certifying their expertise. Of the 1.2 million licensed real estate agents in the United States, only 3,000 have the SIOR designation and, of those, only 100 are in the 4-state Gulf South area. Members of SIOR are the highest performers in the industry, and reported more than $12.5 billion in sales and leases last year. Louisiana Commercial Realty president Robert Hand explains,
"Being a member in the Society of Industrial and Office Realtors means our company is ranked among the top commercial real estate brokers in the U.S., which means our clients benefit from a dedication to excellence and a commitment to providing a higher level of service."
The SIOR organization was founded in 1939, but one year and two months later, the United States entered WW2. The urgency of the war effort required ability, integrity, and sincerity from the brokers—three qualities that we have held in high regard to this day. During the war, members were instrumental in locating existing, and immediately available, plant space that could be utilized to defend our country. Over 200 brokers from across the United States and Canada surveyed suitable facilities and reported their findings to the War Department (now the Department of Defense), playing a vital role in the business of commercial real estate to help provide the infrastructure to produce goods to make life better.
Click here for information on the Commercial Real Estate Index, a proprietary summary of commercial real estate conditions in the U.S., based on a survey questionnaire including: (1) recent leasing activity; (2) trends in asking rents; (3) trends in vacancy rates; (4) subleasing conditions; (5) levels of concession packages in leases; (6) development activity; (7) site acquisition activity; (8) investment pricing levels; (9) the impact of the local economy on the property market; and, (10) the effect of the national economy on the property market.
Sometimes we forget that behind the everyday tasks of waking up, getting dressed, eating breakfast, and just getting to school or work are people making alarm clocks, clothes, frozen waffles and driving buses to help us along the way. In higher level economics courses, it is called the "Multiplier Effect", where a change in input, or spending, causes a larger effect on output, or Gross National Product. For the average person, we don't think about all the work people put into things that help us get through our everyday life, but it drives our economy and enriches our life.
Just Getting The Kids To School Can Be Challenging
Getting children to school doesn't seem complicated: a bus pulls up in front, kids get in and are delivered to the front of the school building where they get out and go to class. But behind that one bus is a host of people making sure that everything goes right. Recently Louisiana Commercial Realty helped one owner of a school bus company find a new location for his buses, which turned out to be a real challenge. Louisiana Commercial president Robert Hand explained,
"The bus company owner asked for our help to find a new location because his current location on France Road was being sold. He was unsuccessful in looking on his own for several months. To complicate things, he was running out of time because he had a contract to provide transportation for 5 charter schools which were starting up in 6 weeks. Even worse, he had not researched the zoning required and almost all the zoning where he needed to be was recently changed, so there were no sites available anywhere near a central location. His business helped hundreds of kids get to school, so we went into overdrive to help."
The school bus owner stood to lose not only his contract, but several other revenue streams if he could not find a properly zoned location, fast. Hand worked every day, all day, scouting locations for the bus owner. He researched the proper zoning, and used the latest technology to find sites that worked. Hands says, "We had to think outside the box. First we contacted the city zoning department to confirm the zoning. Most of the industrial properties in New Orleans East where most buses are parked had recently had zoning changed from Industrial to Business Industrial Park, which does not allow bus parking.
What Nobody Knew About The Required Zoning
What nobody realized was that school bus parking is not deemed a use as a parking lot but a motor vehicle facility which is not allowed in BIP, and requires light industrial zoning. Hand confirmed this in writing with not just one but two employees in the city zoning department, including Ed Horan, the department director. Hand says,
"We compiled a list of all potential sites with that zoning. There were none already listed for lease, so we drove the neighborhoods, scouting locations that nobody else knew about. We found one location that was zoned correctly and had space that was not being used. It was not listed for lease anywhere, so nobody knew about it, but with just good ol' boots on the ground and our technology, we found the right location, then researched who owned the property, contacted the owner and negotiated the details, then drafted the lease agreement to include specific terms for our client."
Thank Your Bus Driver
So next time you have a tough time just getting going and getting to work or school, remember that there are thousands of people that have already cialis prix been up for hours, prepping to provide goods and services to help get you on your way. There is an invisible hand of commerce and free enterprise, guiding you along that you don't even have to think about but it's enriching to know they are there for you.
For more information on zoning and how to research it, see these articles in Louisiana Commercial Realty Commercial News:
New Orleans contracts out all the transportation work including streetcars, city buses and public school buses to outside vendors, who are mostly from out of state, so carpetbaggers are always asking where can I find a lot to park my buses. Not so fast. Any old vacant lot just won't do. Residential zoning won't work. What about commercial zoning? Nope. Of the 83 zoning districts in Orleans Parish, only 3 permit school bus parking: light or heavy industrial and marine industrial park. A conditional use is business industrial park, which requires city council approval and an application costing from $1,000 to $4,000, depending on the lot size. Classified as a Motor Vehicle Operational Facility, defined as a privately-owned facility for the dispatch, storage and maintenance of emergency medical care vehicles, taxicabs and other livery vehicles. A motor vehicle operations facility does not include facilities where the vehicles of the fire, police, or other municipal departments are dispatched, stored, and/or maintained, which are considered either public safety or public works facilities.
Zoning Map
The map below shows in the purple areas the zoning allowed for parking, which is heavy and light industrial, business industrial park and marine industrial.
Zoning Map-Marine Industrial Zoning On Tchoupitoulas Street
Parking is allowed only on the river side of Tchoupitoulas street, zoned marine industrial, and only the area behind the flood wall called Clarence Henry Truckway, owned by the Port of New Orleans.
Zoning Map-Uptown Business Industrial Park
The purple shaded areas along the Mississippi River are zoned marine industrial but are all Port of New Orleans property and used as wharves. The is a small area on Claiborne Avenue near the Jefferson Parish line zoned light industrial, near the Lowes and Crabby Patty's.
A second area zoned business industrial park surrounds the Times-Picayune warehouse, which is why they were not allowed to build apartments there. You can see tour buses parked in an old asbestos barn from I-10 at this district.
Zoning Map-New Orleans East
Nearly all of the companies that own school buses have fenced land where they park on Old Gentilly Road, zoned heavy industrial and shaded purple in the map below.
For additional information on zoning issues, pick from hundreds of insightful articles at LouisianaCommercialRealty.com
Comprehensive List Of Zoning Codes In Orleans Parish
6.2.A Open Space Districts
OS-N Neighborhood Open Space District
OS-G Greenway Open Space District
OS-R Regional Open Space District
NA Natural Areas District
GPD General Planned Development District
6.2.B Rural Development Districts
R-RE Rural Residential Estate District
M-MU Maritime Mixed-Use District
6.2.C Historic Core Neighborhoods Districts
VCR-1 Vieux Carré Residential District
VCR-2 Vieux Carré Residential District
HMR-1 Historic Marigny/Tremé/Bywater Residential District
HMR-2 Historic Marigny/Tremé/Bywater Residential District
HMR-3 Historic Marigny/Tremé/Bywater Residential District
VCC-1 Vieux Carré Commercial District
VCC-2 Vieux Carré Commercial District
VCE Vieux Carré Entertainment District
VCE-1 Vieux Carré Entertainment District
VCS Vieux Carré Service District
VCS-1 Vieux Carré Service District
HMC-1 Historic Marigny/Tremé/Bywater Commercial District
HMC-2 Historic Marigny/Tremé/Bywater Commercial District
HM-MU Historic Marigny/Tremé/Bywater Mixed-Use District
VCP Vieux Carré Park District
6.2.D Historic Urban Neighborhoods Districts
HU-RS Single-Family Residential District
HU-RD1 Two-Family Residential District
HU-RD2 Two-Family Residential District
HU-RM1 Multi-Family Residential District
HU-RM2 Multi-Family Residential District
HU-B1A Neighborhood Business District
HU-B1 Neighborhood Business District
HU-MU Neighborhood Mixed-Use District
6.2.E Suburban Neighborhoods
S-RS Single-Family Residential District
S-RD Two-Family Residential District
S-RM1 Multi-Family Residential District
S-RM2 Multi-Family Residential District
S-LRS1 Lakeview Single-Family Residential District
S-LRS2 Lake Vista and Lake Shore Single-Family Residential District
S-LRS3 Lakewood and Country Club Gardens Single-Family Residential District
S-LRD1 Lake Vista Two-Family Residential District
S-LRD2 Lakewood/Parkview Two-Family Residential District
S-LRM1 Lake Area Low-Rise Multi-Family Residential District
S-LRM2 Lake Area High-Rise Multi-Family Residential District
S-B1 Suburban Business District
S-B2 Pedestrian-Oriented Corridor Business District
S-LB1 Lake Area Neighborhood Business District
S-LB2 Lake Area Neighborhood Business District
S-LC Lake Area General Commercial District
S-LP Lake Area Neighborhood Park District
S-LM Lake Area Marina District
6.2.F Commercial Center and Institutional Campus Districts
C-1 General Commercial District
C-2 Auto-Oriented Commercial District
C-3 Heavy Commercial District
MU-1 Medium Intensity Mixed-Use District
MU-2 High Intensity Mixed-Use District
EC Educational Campus District
MC Medical Campus District
MS Medical Service District
LS Life Science Mixed-Use District
6.2.G Centers for Industry
LI Light Industrial District
HI Heavy Industrial District
MI Maritime Industrial District
BIP Business-Industrial Park District
6.2.H Central Business District
CBD-1 Core Central Business District
CBD-2 Historic Commercial and Mixed-Use District
CBD-3 Cultural Arts District
CBD-4 Exposition District
CBD-5 Urban Core Neighborhood Lower Intensity Mixed-Use District
CBD-6 Urban Core Neighborhood Mixed-Use District
CBD-7 Bio-Science District
6.2.I Overlay Zoning Districts
SC Suburban Corridor Use Restriction Overlay District
ENORC Eastern New Orleans Renaissance Corridor Use Restriction Overlay District
HUC Historic Urban Corridor Use Restriction Overlay District
Lower St. Charles Avenue Use Restriction Overlay District
RDO-1 Residential Diversity Overlay District (Marigny/Bywater)
RDO-2 Residential Diversity Overlay District (Tremé/Seventh Ward)
AC-1 Arts and Culture Diversity Overlay District (Frenchmen, St. Bernard, Broad)
AC-2 Arts and Culture Diversity Overlay District (Freret, Newton, Teche)
AC-3 Arts and Culture Diversity Overlay District (St. Claude)
AC-4 Arts and Culture Diversity Overlay District (Tremé)
RIV Riverfront Design Overlay District
CPC Character Preservation Corridor Design Overlay District
EC Enhancement Corridor Design Overlay District
CT Corridor Transformation Design Overlay District
GC Greenway Corridor Design Overlay District
Start-ups 68% higher in New Orleans than national average
For decades prior to 2005's Hurricane Katrina, new businesses fled New Orleans in mass for greener pastures with more high-tech employees and payroll tax incentives, but after Katrina many residents launched their entrepreneurial spirit and started their own businesses, resulting in a doubling of new businesses that is 68% higher than the national average and has lasted for more than a decade. Among these entrepreneurs are high technology companies, drawn to the area with economics incentives and a culture that younger tech-savvy millennials demand in their work. One of these high tech companies, CivicSource, is the leading auctioneer of tax-distressed real estate, and has been recognized by Inc. Magazine’s 500|5000 as one of "America’s Fastest Growing Companies". Their work space in the 935 Gravier office tower is a model of high tech environments, with white boards, pool tables, break areas including sofas and a full kitchen, and fiber optic networks with open work areas, making it easy to be recognized as the one of the "Best Places To Work in New Orleans" for the past five years.
Like many start-ups, success results in outgrowing the physical office space, and while normally the entire 17th floor at the 935 Gravier Street office tower would be sufficient, CivicSource decided purchasing office building would provide more control over their growth than paying rent. After a search of the top commercial real estate brokers, CivicSource hired Louisiana Commercial Realty to market their 17th floor office space for sublease.
Ethical Standards and Conflicts of Interest
Louisiana Commercial Realty President Robert Hand explains, "Many commercial property owners come to us to help them lease or sublease their office space because our approach is vastly different from everyone else. Rather than just put up a sign and wait for someone to call, we utilize the latest technology and identify who the best person is to lease the space and we reach out to them." Many property owners are concerned with conflicts of interest in finding tenants for their property, and no longer want an agent working for them who might also show a competing listing to the same person. Hand says, "We don't accept listings that might compete with clients we have. Commercial property owners like the idea that we guarantee there are no conflicts of interest and their property will be represented with the highest ethical standards."
Louisiana Commercial Realty has vast experience in helping tenants sublease their office space, having completed negotiations recently in the sublease of 75,000 of Class A CBD space on 3 full floors on Poydras Street for the 8th largest oil company in the world.
After unsuccessful attempts by Latter & Blum, the largest commercial real estate firm in the south, to sell his property, the owner of the largest office property for sale near Ochsner Baptist Hospital decided to try a different approach and hired a small boutique commercial real estate firm, Louisiana Commercial Realty to market his property.
Ethical Standards and Conflicts of Interest
President Robert Hand explains, "Many commercial property owners come to us to help them sell their property because our approach is vastly different from everyone else: rather than just put up a sign and wait for someone to call, we utilize the latest technology and identify who the best person is to purchase or lease the property and we contact them." Many property owners are concerned with conflicts of interest in finding buyers or tenants for their property, and no longer want an agent working for them who might also show a competing listing to the same person. Hand says, "We don't accept listings that might compete with clients we have. Commercial property owners like the idea that we guarantee there are no conflicts of interest and their property will be represented with the highest ethical standards."
A Revitalized Neighborhood
The property was renovated a few years ago, so each floor of the office building has 14 private offices, large conference rooms, restrooms and break areas. The Ochsner Baptist area has enjoyed a rapid growth in retail stores and top-rated dining, with the Magnolia Marketplace Shopping Center offering Michaels, TJ Maxx, Ross and PetSmart, and nearby Freret Street offering innovative cuisine including High Hat Café, Company Burger, Dat Dog, Wayfare, Origami and Pure Cake, plus one of the highest rated cocktail bars called the Cure.
More information on the neighborhood and the office property for sale, download the Marketing Presentation or visit www.louisianacommercialrealty.com.
Want information on prices of commercial property? Check out the Commercial Property Price Charts which charts the prices in New Orleans and Louisiana for industrial, office, apartments and shopping centers.
With over 4,000 known blighted properties in New Orleans, and probably an additional 10,000 not yet declared blighted, city officials have recently discovered they can bring in new revenues from code violation fines. One commercial property at 1532 Robert E. Lee Boulevard was assessed $100,000 in fines, which were paid in order for Ochsner to have a clinic there. The fines force property owners to make repairs which eventually brings in more revenue to the City because repairs lead to higher property values and higher assessments. This means there is a good chance your commercial property can be cited for code violations, even if you believe your property is in good shape. What will surprise you is the amount of the fines, which can easily be $5,000 to $10,000 per property. For the 1,281 judgments the last 6 months, that amounts to $6.4 million annually into the City coffers. This article explains what to do when Code Enforcement knocks on your door wide commercial property code violations.
Don't Throw Away Code Enforcement's Letter
The first step is usually a complaint from your neighbor or maybe even be someone interested in purchasing your property so they want to discourage you from owning it. All they have to do is call 311 and file an anonymous complaint over the phone to say your grass is too high, your windows are covered with advertising, your dumpster is not behind a fenced in area, or almost 50 various categories of disrepair. A 311 call prompts a city employee to inspect the property but you will never know when the property has been inspected, or who the inspector is. If an active code violation case does not already exist for your property, Code Enforcement creates a case which you can follow on the website BlightStatus. Code Enforcement employees perform a detailed inspection of building exterior and lot conditions, taking lots of pictures and making lists of violations of City ordinances. The average time from a complaint and creation of a case to inspection is 30 days. After an inspection is completed and violations have been documented, the Hearings Bureau performs title research to notify owners. This is where you will receive a notice of a hearing date and a list of the code violations. The hearing must be at least 30 days from when the notice is mailed to you.
The Hearing From Hell
The hearing is a review of the code violations and a decision will be made at the end of this hearing to impose fines. This is a 5 to 10 minute hearing in a small room at 1340 Poydras Street. It is rushed. You can bring an attorney, but be prepared to get verbally abused on why your property is in disrepair. You are not allowed to speak much and any defense of your excuses will be ignored. It is not a negotiation. The hearing is conducted by a code enforcement employee and a city employee who represents the mayor's office. The person who inspected your property is not in attendance. There is a stenographer taking notes and the meeting is recorded, but you do not get a copy. You have to file a Freedom of Information Request to get the recording of your hearing.
4,177 properties have been inspected the last 6 months for code violations
The code enforcement employee has not inspected your property, but will display photographs on a large screen of code violations from the inspector's report. The code enforcement employees won't review the photographs in detail nor explain exactly where on the property the violations occurred, because they were never on your property. They are using the inspector's report of violations, but the inspector is not present. If you ask the officer to review the photographs and show where the violations are, they will tell you to give the list of violations to your contractor who will tell you what needs to be fixed.
There will be lots of code violation-possible 20 to 30 in all-even if your property is in good condition. If you try to explain why there are code violations, you will be shushed by the mayor's representative. You will be told there is no more time and that they have to move on to other cases. They will conclude by fining you up to $500 for each of the single code violations, which usually totals $5,000 to $10,000, and put a lien against your property so it can't be sold unless the fines are paid. An attorney working in the Code Enforcement Department, who you will never be allowed to contact, may at their discretion place your property in a sheriff's sale so proceeds can be used to satisfy the fines.
After The Hearing Is Consummated
3,361 properties were found to have code violations the last 6 months
A hearing officer may postpone the hearing to a future date which usually is not set for a definite date if they feel there is work in progress. The officer may also dismiss the case based on evidence presented at the time of hearing, and the code enforcement hearing officer has total discretion. If a property remains in violation of the City ordinances, a Notice of Judgment will be issued to the owner and, if not appealed or paid in full, will be filed with the recorder of mortgages 30 days after the hearing. This filing will constitute the lien on the property and will give the City the authority to remediate the violations and seize the property for Sheriff Sale.
Vague Code Violation Law Can Apply To Most Any Property
2,482 hearings were conducted the last 6 months
The current housing code dates back to 1995 when Mayor Marc Morial recodified the 1956 Code of Ordinances and established 170 chapters of law on how the City would operate. The housing code is written with vague language and could apply to almost any commercial property. Here are some examples:
Chapter 26, Article 4, Section 26-159 states: All sidewalks, walkways, driveways, parking spaces and similar areas shall be kept in a proper state of repair and maintained free from hazardous conditions, including but not limited to, deterioration, deformation, fractures, fissures, spalling, or detached, dislodged or failing connections.
Spalling means a break in your sidewalk. So you could be in violation of this code if your sidewalk is in disrepair.
Chapter 26, Section 26-151 states: All structures and exterior property shall be kept free from rodent harborage and infestation. Where rodents are found, they shall be promptly exterminated by approved processes which will not be injurious to human health. After extermination, proper precautions shall be taken to eliminate rodent harborage and prevent re-infestation.
The problem with this violation is that rodents do not have to be found, despite the language saying differently. The inspector will list you in violation of this code regardless.
Sec. 26-167 states: All exterior surfaces, including but not limited to: doors, door and window frames, cornices, porches, trim, balconies, decks, and fences, shall be maintained in good condition.
Good condition seems pretty arbitrary. You'll be in violation of this code for sure.
Sec. 26-184 states: All interior surfaces shall be maintained in a good, clean and sanitary condition. Peeling, chipping, flaking or abraded paint shall be repaired, removed or covered. Cracks or loose plaster, decayed wood and other defective surface conditions shall be corrected. Holes in interior walls shall be sealed as necessary.
Interior wall holes shall be sealed, and no peeling or flaking paint. It's a good code but open to interpretation. The inspector will find you in violation of this for sure even though they have not seen the interior.
Sec. 26-179 states: Every window, skylight, door and frame shall be kept in sound condition, good repair and weather tight. All glazing materials shall be maintained free from substantial cracks and holes. Every window, other than fixed windows, shall be operable and capable of being held in position by window hardware.
Every window operational? Not in a 100 year old house where windows have 7 coats of paint sealing them shut for the last 30 years.
Before and After 30 Days of Your Code Violation Hearing
1,281 judgments were handed down, with fines, the last 6 months
After the hearing but within 30 days:
Present photographs showing that all violations have been fixed, and photos of the front, rear, and right and left side of the structure.
Provide proof of permits and Certificate of Completion and/or Certificate of Occupancy from the Department of Safety and Permits.
You still have to pay the fines, but this will stop the sheriff's sale.
More Than 30 days after the hearing
After 30 days, waiver of daily fines will only be considered upon submission of a completed Lien Forgiveness Request Form.
Forgiveness of partial fines is considered when the property in question has been brought into full compliance with the City housing code.
The code enforcement employee has total discretion.
Summary- 8 Things To Immediately Do When Accused of Code Violations
Immediately upon receiving notice of the hearing for code violations, call or visit the Code Enforcement Department. Ask for the email address for the person who sent you the hearing notice. Get the violations fixed and send the hearing officer the following documents, before the hearing date.
CURRENT clear printed photos of the property in compliance. Photos should include front, right and left sides and have the date it was taken printed on the photo.
Recently executed contracts for repairs.
Permits covering the scope of work that has been performed.
Certificate of Completion indicating that work performed under a permit.
Certificate of Occupancy indicating that work was completed.
Certificate of Appropriateness if the property falls within the historic district of HDLC.
Proof of committed financing for repairs or new construction.
Documents proving your ownership interest in the property including Bill of Sale.
But don't wait until the hearing. You can email the documentation to the code enforcement officer in hopes of having the hearing reset or violations cancelled.
For more insight on the city's fiasco in handling blighted property, click to read our previous article "Why Blighted Property Still Exists 11 Years After Katrina".
Construction starts on $61M ‘Canal Crossing’ development downtown
By: Andrew Valenti, Reporter, January 31, 2017
Construction has begun on a massive mixed-use development at the site of a former Canal Street surface parking lot led by a real estate development partnership with ties to Missouri billionaire sports mogul Stan Kroenke. According to plans filed with the city, Provident Realty Advisors of Dallas and The Kroenke Group of Columbia, Missouri are partnering in a development at 1535 Canal St. that would include a 400,000-square-foot, nine-story residential building with ground floor commercial space reserved for tenant use.
New Orleans' Largest Apartment Project
Commercial broker Robert Hand, president of Louisiana Commercial Realty, said this project is a great example of the confidence developers continue to show in the area. The Tulane Avenue and Canal Street corridors continue to be a hotbed of activity for investors in recent years due in large part to the opening of the $1.1 billion University Medical Center and the $1 billion Veterans Affairs Hospital.
Hand said he believes the housing market will be able to support these additional units when they come online in the coming years. “Many of the newer apartment developments along Tulane Avenue are near 100 percent occupancy,” he said. “So there is still a need for apartments in that area.”
The project also includes a 10-story, 187,000-square-foot, 500-space parking garage. The ground floor of the garage would feature a small pet park and the apartment units would be built around a 10,000-square-foot courtyard. The development is called “Canal Crossing” and offer 330 one-bedroom and two-bedroom apartments. A permit report lists the construction value at $61 million.
The parcel of land occupies an entire city block bounded by Canal, North Robertson, Iberville and North Villere Streets. It’s situated across from the vacant Jung Hotel, where a $130 million renovation is underway, and the former University of New Orleans tower, which is planned to be converted to a dual hotel.
At first glance, imposing tariffs or quotas appear to be the perfect solution to get American industries back on track to prosperity, but the reality is that tariffs steal money out of consumers’ pockets by causing prices to increase, stifle creativity, reward inefficiencies and destroy the competitive drive that allows a free market economy to deliver cheaper, smarter and innovative products to you. If you skipped college or avoided a business degree, you missed the basic economics course that explains why tariffs and quotas work in communist countries but never work in a free market economy. This article refreshes you on Econ 101 and explains why tariffs in America cost you over $70 billion every year.
Price Is The Intersection Of Supply And Demand
Supply and Demand Curves
The price of a good is the intersection, or equilibrium, of the demand and the supply. The chart illustrates the interaction between increased quantity and increased prices for buyers (demand curve) and suppliers (supply curve). The supply curve always rises since as prices increase, providers of goods want to sell more, and the demand curve always declines, since as prices rise, consumers always want to buy less. The intersection of supply and demand tells us the long term equilibrium of price and quantity.
Tariffs and Quotas
A tariff is a tax on imports, paid to the government. Domestic producers are exempt from the tariff. A quota is a limit on the quantity allowed to be imported. The result of both is an increase in the price of the good, from the market price to the new tariff price. American manufacturers get to charge the new price, but manufacturers overseas receive the market price but pay the tariff to the US government. The government gains area “D”, the revenue from the tariff; however, American consumers pay the higher price measured by areas A+B+C+D. Even if the government passes along to consumers the revenue from the tariff, the loss to consumers is still area B+D.
Tariffs Cause Consumers To Pay Higher Prices
Tariffs and quotas are not sound public policy. They undermine competitive discipline which forces industries to always reduce cost and increase efficiency, driving creativity and invention. Protectionism has a narcotic effect, allowing sick industries to avoid facing up to their problems.
What Can We Learn From Steel Industry Tariffs
America has many precedents that teach us tariffs are bad policy, and the most obvious is the one industry promoted that tariffs will help today: steel. Going back 70 years, the steel industry was an oligopoly, with just a few manufacturers and little competition, allowing the industry to raise prices 9% annually in the late 1940’s, twice the rate of wholesale prices. In the early 1950’s, steel prices increased 4.8% annually at a time when the wholesale price index was falling. In the late 1950’s, steel price were increased 7.1% annually, three times wholesale prices. In 1969, quotas were imposed and steel prices increased 14 times greater than they had in the previous 9 years, during a time of recession and 25% of industry capacity in an idle state. The result was a lag in technology. American steel companies failed to introduce the oxygen process and continuous casting which put them at a disadvantage. Their oligopolistic pricing policy kept American companies from competing in the world market and eventually allowed imports to erode their market by producing a better product at a lower price.
The recent sale of 2537 Tulane Avenue for $5.6 million set a record highest price for property closest to the new $2 billion hospital development, so Citybusiness reached out to Louisiana Commercial Realty broker Robert Hand to discuss the trend on Tulane Avenue apartments and hotels:
Commercial broker Robert Hand, president of Louisiana Commercial Realty, said that he feels either project would do extremely well in that area due to high demand for those services.
“There is a shortage of moderately-priced hotels in the area,” he said. “Rooms at $100 to $125 a night would do well and pull (clients) from the French Quarter tourism market as well as the new hospitals. There really isn’t anything decent on that side of (Interstate 10).”
“There’s still a high demand for apartments as well,” he added. “It is still very difficult to find a two-bedroom apartment for under $1,500 in the city.”
Feil purchased the 1.6-acre site from the family that owns Dixie Beer for $5.6 million in April. He also bought the property at 2501 Tulane Ave. for $740,000 in May. Joe’s Lawnmower Shop once occupied the location and is in the same block as the warehouse. Jeffrey Feil, CEO of the Feil Organization, plans to build either an extended-stay hotel or a mixed-use development near the $1.1 billion University Medical Center and immediately adjacent to the nearly-completed Veterans Affairs Hospital, according to a demolition request application filed with the city.
Proposed Tulane Avenue Apartment
The documents show two different plans for the site. The five-story hotel would offer around 59,500 square feet of space with 88 rooms. Rooms would be located on the top four floors, and sizes would vary from 356 to 408 square feet. There would be 139 parking spaces, with 115 located off-street and the remaining to be on the street. Designs show that cars will enter the development on South Rocheblave and South Dorgenois with the main pedestrian entrance fronting Tulane Avenue. A second set of plans shows a 5-story, mixed-use development that would offer 20,000 square feet of retail space on the first floor to go along with 54 covered parking spaces for residents. There would be 40 spaces for retail customers.
The second, third and fourth floors would be 35,000 square feet each and have 96 apartments at 830 square feet each. Designs show that the fifth floor would be an open-air space for residents. There would be a total of 96 parking spaces for residents. The application filed with the city indicates that PPS Contractors is handling demolition of the 49,000 square-foot warehouse. The work is valued at $200,000, according to the application, which was signed on Sept. 21. Designs show that Thibodaux-based Duplantis Design Group is the architect for the project. Representatives of the Feil Organization could not be reached for comment.
The city's criteria for building a hotel on the New Orleans airport north terminal property will shock you. The hotel is part of the $800 million new terminal on the massive stretch of land on the north end near Veterans Boulevard. That will be good news for the tourism industry which is a powerful economic driver to the area, witnessed by last year's 10.6 million passengers, up 9.1% from the previous year. The new development will demolish concourses A, B and C and use concourse D as charter and administration, even though charter accounts for 3,189 passengers, down 40% from last year and only 0.1% of the total.
New $800 Million Airport North Terminal
The city hoped to lease part of the land to a developer who would build a 140 room, 8 story hotel on 22,000 square feet of land leased by the city to the hotel developer, but no developers were interested. The reason for the lack of demand can be found in the restrictive criteria in the 140 page Request For Proposals, which we found to have 5 areas where criteria were so restrictive that it made any hotel unfeasible.
Criteria For Awarding The Hotel Contract
The city is using consultant Leo Daly LLC as its advisor since they are experts in airport development, and the city is awarding the hotel land lease based on the weighting of these 5 criteria:
Payment to the city, 30%.
Design, 30%.
Team members, 20%
Airport Concession Disadvantaged Business Enterprise, 10%
State of Louisiana Disadvantaged Business Enterprise, 10%.
City Criteria For 30% Of Hotel Employees Can Be A Prior Arrest
During the construction phase, 30% of the work performed by Louisiana workers must be Targeted Workers, which are defined as residents of Orleans, Jefferson and St. Charles Parishes, and 10% of the project hours must be performed by Disadvantaged Targeted Workers, which are:
In Orleans Parish, having a household income of less than 50% of Adjusted Median Income.
Homeless.
Custodial single parent.
Eligible to receive public assistance.
Having a prior arrest or conviction.
Suffering from Chronic Unemployment.
Emancipated from the foster care system.
A veteran of the U.S. military.
During the operations phase of the hotel, the city requires 50% to be Targeted Workers and 30% to be Disadvantaged Targeted Workers. In addition, all new hires for the hotel must use the city's agency, Office of Workforce Development.
Hotel Developer Must Pay City $550,000 Annually
The 22,000 square feet will be leased by the city to the hotel developer for $103,000 annually, which is actually a fair price, plus a minimum of $450,000. This payment to the city could amount to as much as 36% of the net operating income for the hotel, making the entire hotel project unfeasible. Here is how the net income is calculated:
Number of rooms: 140
Times Daily Market Room Rate: $125
Times 365 Days/Year:365
Total Potential Revenue: $6,387,500
Times Average Occupancy:60%
Expected Revenue Per Year: $3,832,500
Less Operating Expenses Averaging 60%: -$2,299,500
Net Operating Income: $1,533,000
The Net Operating Income does not include the payments of $553,000 to the city, which amounts to 36%, so the net income to the investor/developer is actually $980,000, less income taxes of 35% results in an after tax income of $637,000. Since the development is expected to cost $17,000,000, the annual rate of return would be 3.74%.
The numbers just don't add up to a viable project, which is why the city did not receive any interest in building a hotel on the airport property. There are several strategies the city can use to make the project work: one, lease more land for a larger hotel so that hotel revenues can be higher which reduces the impact of the city's fee on the bottom line, or two, reduce the fee, or three, finance the developer by using low interest rate tax free bonds which the city can issue.
The Times-Picayune first broke the story that no bidders stepped forward to lease 22,000 square feet of city land to build an 8-story, $17 million, 140 room hotel on the $807 million airport terminal development on the north side of the existing Louis Armstrong, so they reached out to Louisiana Commercial Realty president Robert Hand for an explanation.
September 28, 2016 at 2:50 PM
By Katherine Sayre, NOLA.com | The Times-Picayune
Louis Armstrong International Airport's plan for a prominent hotel at the front entrance to its new $807 million passenger terminal failed to attract interest from developers, despite an unprecedented hotel boom unfolding in downtown New Orleans.
The New Orleans Aviation Board did not receive any responses to its recent request for proposals to build a nationally branded, full-service, 140-room hotel connected to the terminal, which is under construction and slated to be finished by October 2018. The deadline to respond to the hotel request was Sept. 16.
Robert Hand, president of Louisiana Commercial Realty, said the airport is asking too much — at least $550,000 annually — to make the project attractive for a developer. "The money that they're asking makes it unfeasible if you work through the numbers," Hand said. Airport hotels attract companies that want a convenient place for regional employee meetings, he said. The meetings can be held at the hotel, and employees can use their evenings off to go into the city. There also limitations on what brand the airport could attract, he said, depending on what brands already have hotels in the area.
The new terminal project, which all-told would include nearly one-billion dollars investment including a new interstate flyover and a hotel, is slated to open Oct. 1, 2018. Armstrong Airport currently leases 22 gates to airlines and has seen huge growth in passenger traffic which is expected in 2016 to surpass its all-time record of 10.6 million passengers in 2015, so the new terminal will have 30 gates with an option to expand to 42. As for the existing terminal, concourses A, B (Southwest) and C (American, Alaska, JetBlue and others) will be demolished. The airport intends to repurpose concourse D (Delta, United) for charter services and administrative offices. The airport had hoped to have a lease negotiated, approved by the City Council and signed by Dec. 16.
Airport leaders estimated the hotel would be a $17 million project. The city and the New Orleans Aviation Board were seeking a 30-year lease deal that would require a developer to pay about $103,000 a year in rent and a minimum of $450,000 every year to share in revenues.
Across the metropolitan area, the New Orleans market has added more than 4,000 rooms in 23 hotels to its hospitality stock in the last six years, according to Smith Travel Research. Developers have turned to historic tax credits to renovate old office towers in the Central Business District into hotels and apartments, while hotels continue to be developed and renovated in the Warehouse District and near the Ernest N. Morial Convention Center. Tourists and convention visitors drive demand in the city's core.
The largest development in the history of Jefferson Parish, and the one having the biggest impact on the future of New Orleans, is the development of the $807 million dollar north terminal at Louis Armstrong Airport, which will include a 140 room hotel on land leased from the city. CityBusiness recently interviewed Robert Hand, president at Louisiana Commercial Realty on the hotel development.
September 29, 2016
By: Lance Traweek, Managing Editor
Louis Armstrong International Airport doesn’t plan to scrap plans for a hotel near its new $807 million passenger terminal despite receiving no interest from hotel developers. The New Orleans Aviation Board did not receive a single response to its recent request for proposals to construct an on-site, three-star hotel next door to the terminal currently under construction. The deadline for responses was Sept. 16.
Robert Hand, president of Louisiana Commercial Realty, said the 140-page RFP makes a hotel not feasible due to the payments required by the city. At a 140-room hotel, the average room rate would $125 per night, which would amount to $6.3 million in potential rental income. But Hand pointed out that hotels don’t operate at 100 percent capacity. “They plan for 60 percent, so pro forma revenues are $3.8 million, which is the effective rental income,” he said. Expenses are 60 percent, which means 40 percent is left, or $1.5 million, the net operating income. If a developer paid $100,000 rent for the land, plus a $450,000 fee, that would amount to 35 percent of net operating income, leaving approximately $1 million before income taxes which are around 35 percent.
The resulting income to the investor is $650,000 annually for a $17 million investment which is a 3.8 percent return on investment, which doesn’t compensate investors enough for the risk, Hand said.
New North Terminal At Louis Armstrong Airport In New Orleans
Hand recommended the board reduce the guarantee fee based on profits, offer financing since they are a government entity and rates would be below market, and lease more than 22,000 square feet so construction costs would be less.
Requests to interview Iftikhar Ahmad, director of aviation at the airport, have not been returned. Several aviation board members did not return messages seeking comment. According to the original RFP, the nationally branded hotel must include at minimum of 140 rooms and embody the terminal’s design by architect Cesar Pelli. Preliminary architectural renderings of the proposed project must include two different aerial views, a typical guest room, lobby area, restaurant and meeting area. The proposal will be judged on its aesthetic and functional compatibility with the North Terminal design as described within the RFP. The selected proposer will lease the hotel development site – about 23,000 square feet – from the NOAB for the term of a 30-year lease. The airport had wanted to consider bids beginning next week and sign a lease by a lease by Dec. 16. The terminal is scheduled for completion in October 2018.
Whether you rent office space, a warehouse, or a retail store, your lease probably has language that ties rent you pay to the Consumer Price Index. The idea is meant to benefit only the landlord, because the rental income retains its purchasing power. The problem is that there is more than one Consumer Price Index and there are different ways to calculate each, so make sure your lease agreement contains language that is very specific. One example of lease language referencing the CPI is:
The rental under this lease shall be four ($4.00) dollars per square foot for the first twelve (12) months, with annual adjustments tied to the Consumer Price Index (published by the Bureau of Labor Statistics, All Urban Consumers, Current Series, Index) for the previous calendar year period.
Five Things Every Lease Should Make Clear
It Is Clear Where The CPI Is Published-If rent is tied to an index, what index is used and where can you find it? The above lease language spells out that the rent is adjusted by the Consumer Price Index, and tells the information is published by the Bureau of Labor Statistics, which is found easily online.
It Is Clear What Type of Consumer Price Index Is Used-There are 4 methods used to calculate the Consumer Price Index:
All Urban Consumers (Current)-Consists of all urban households in Metropolitan Statistical Areas (MSAs) and in urban places of 2,500 inhabitants or more. Nonfarm consumers living in rural areas within MSAs are included, but the index excludes rural nonmetropolitan consumers and the military and the institutional population.
Urban Wage Earners and Clerical Workers (Current)-Consists of consumer units with clerical workers, sales workers, protective and other service workers, laborers, or construction workers. More than one-half of the consumer units income has to be earned from these occupations, and at least one of the members must be employed for 37 weeks or more in an eligible occupation.
All Urban Consumers (Chained)-The urban consumer population is deemed by many as a better representative measure of the general public because 90% of the country's population lives in urban areas. Using chained CPI means the rate at which Social Security benefits tick up would be slower, because it reflects substitutions consumers would make in response to rising prices of certain items. Therein lies the "chained" part of the name. The metric utilizes a basket of goods and services that are measured changes from month to month; much like a daisy chain. If the cost of a certain form of transportation goes up, for example, people might switch to another kind. This kind of "substitution" is part of what is factored into chained CPI.
Average Price Data- Calculated for specific items such as, household fuel, motor fuel, and food items from prices collected for the Consumer Price Index (CPI). Average prices are best used to measure the price level in a particular month, not to measure price change over time.
It Is Clear How The Adjustment Is Applied-The CPI adjustment can applied to a lease payment monthly, quarterly, or annually, but be clear about what period of CPI is used. It is best that landlord and tenant agree the CPI is for the previous 12 months and applied to the last rent payment.
It Is Clear Whether The CPI Is Adjusted For Seasonal Changes-The CPI can be adjusted for changing climatic conditions, production cycles, model changeovers, holidays, and holiday sales which can cause variation in prices. For example, oranges can be purchased year-round, but prices are significantly higher in the summer months when the major sources of supply are between harvests.
It Is Clear Whether The CPI Is National or Local-The CPI publishes unadjusted price indexes at the national, metropolitan area, and regional levels. So you could drill down and calculate your CPI based on your city's MSA. This would be more meaningful if your economy is an outlier, such as Houston, Detroit, or New Orleans.
How Is The CPI Calculated
In calculating the CPI, the urban portion of the United States is divided into 38 geographic areas called index areas, and the set of all goods and services purchased by consumers is divided into 211 categories called item strata. This results in 8,018 (38 × 211) combinations.
The CPI is calculated in two stages. The first stage is the calculation of basic indexes, which show the average price change of the items within each of the 8,018 CPI item-area combinations. At the second stage, aggregate indexes are produced by averaging across subsets of the 8,018 CPI item–area combinations.
Percent changes for periods other than 1 year often are expressed as annualized percentages. Annualized percent changes indicate what the change would be if the CPI continued to change at the same rate each month over a 12-month period. These are calculated using the standard formula for compound growth:
What Is Included In The CPI
The CPI represents all goods and services purchased for consumption by the reference population with all expenditure items divided into more than 200 categories, arranged into eight major groups. Major groups and examples of categories in each are as follows:
FOOD AND BEVERAGES (breakfast cereal, milk, coffee, chicken, wine, full service meals, snacks)
APPAREL (men's shirts and sweaters, women's dresses, jewelry)
TRANSPORTATION (new vehicles, airline fares, gasoline, motor vehicle insurance)
MEDICAL CARE (prescription drugs and medical supplies, physicians' services, eyeglasses and eye care, hospital services)
RECREATION (televisions, toys, pets and pet products, sports equipment, admissions);
EDUCATION AND COMMUNICATION (college tuition, postage, telephone services, computer software and accessories);
OTHER GOODS AND SERVICES (tobacco and smoking products, haircuts and other personal services, funeral expenses).
What Does Yesterday's Release Of The CPI Tell Us
The Bureau of Labor Statistics, under the Department of Labor, released the latest Consumer Price Index numbers yesterday, using the All Urban Consumers Index which increased 0.2 percent in August, but this was for only one month and it was not seasonally adjusted. The seasonally adjusted number increased 0.3 percent, the largest increase in 6 months, due to increases for shelter and medical care.
Some August prices increased while others decreased, which is why the CPI can be misleading. The indexes increased for motor vehicle insurance, apparel, communication, and tobacco; however, the indexes decreased for used cars and trucks, household furnishings and operations, recreation, and airline fares.
These numbers are only for the month of August, and leases should use the annual number. The all items index rose 1.1 percent for the 12 months ending August. The index for all items less food and energy rose 2.3 percent for the 12 months ending August. The food index was unchanged over the last year while the energy index declined 9.2 percent.
How Much Difference Can 1 Percent Make
Inflation is not what it used to be. In the 1980's the CPI approached 20% and the greatest economist alive said it was going to 25%. It went to 2%. Our economy today is driven by a different wage/price spiral and low inflation helps borrowers and hurts landlords and savers. Building in a CPI adjustment can still make a difference in a long term lease, as shown in the table below which compares a 1 percent CPI to a 2 percent CPI adjustment over a 25 year time frame. A 1 percent incremental rate increase annually results in $378,000 additional income over the 25 year span, and assuming a 10 percent Capitalization Rate, increases the market value of the property $338,000, or 33%.
Summary
In leasing any type of property, whether you are the landlord or the tenant, make sure your lease is clear about what the rent is, and what inflation adjustments apply to the rent. Any lease document can be revised, even though some parties say they use a standard lease. There is no such thing. A lease is an agreement between two parties, and you should revise it to include language that works for you. As always, consult an expert.
Free Lease Consultation: If you have questions about a lease document, Louisiana Commercial Realty offers a free lease review, which includes an analysis of nearby rental market prices.
For more information on leases, read these articles published on our website:
Is 2 Years A Long Time To Take To Lease Property
9 Things To Know Before Signing Any Contract
Negotiate Contracts With Strength
Triple Net Leases For Dummies
The City Has A Process That Fosters Blighted Property
It's not a conspiracy, but the result is the same: New Orleans still has thousands of blighted houses. What it can be called is a dysfunctional system that created an organized effort that actually encourages blighted property, and uses your tax dollars to take away your tax dollars. The effect of thousands of blighted properties is two-fold: one, a loss of property taxes, which could be used to fund more police, fire protection and schools, and, two, a reduction in property values which takes money out of your pocket when you sell your property.
How big a problem is blighted property? It's underestimated. In my 15 years of working to put vacant property back into commerce, I estimate there are 20,000 to 40,000 blighted properties and vacant lots remaining that, if put back into commerce, would provide enough property tax income to triple the size of the police force. New Orleans could be known all over the world for almost eliminating crime.
Putting Vacant Properties Back Into Commerce Could Produce $100,000,000 in New Property Taxes-Which Department In The City Budget Below Would You Expand?
Not Fixing Blighted Property Stems From Policy of Mayor Ray Naquin
After Katrina, thousands of homes were in need of repair, so holding property owners accountable was a priority low on the totem pole. Mayor Ray Naquin's administration would not allow fines for code violations on blighted properties. The mayor did not want to lose voters.
The fines would actually encourage owners to cut the grass and repair their properties, and, if not, allow the city to sell the property if went unpaid which would put the property into the hands of someone who would care for the property and revitalize the neighborhood. The city wins, the neighborhood wins, and the owner gets relief from maintenance they cannot afford and gets the money to put into things about which they do care.
Individual Rights of Property Ownership Were Denied in Order to Create a Public Good
This is one of the few things we expect government to do: make the world better for individuals by doing things that individuals cannot do, such as build a massive highway system from one coast to the other. We saw this process work in the 1956 when President Eisenhower signed the Federal-Aid Highway Act, a $500,000,000 highway rebuilding program that resulted in major highways across the nation. Traveling for vacation was easier, owning a home in the suburbs was affordable, trucking transportation costs declined, and goods got where they needed to go faster. In order for the government to build highways, they needed to force some private property owners to sell their property. Three appraisals were required so that the owner received a fair price.
The same process was utilized with property owners on Tulane Avenue, when the Veterans Administration and LSU hospitals were built and private property owners were forced to sell their property. Individual rights of property ownership were denied in order to create a public good. You want it to happen only in rare occasions, but it can work to make your neighborhood better.
One Example: Declared Blighted 6 Years Ago and Still Nothing Done
The Lakeview Civic Improvement Association back in 2009 deemed one house to be a problem. The house had no electricity, even 4 years after Katrina, and the foundation was crumbling in disrepair with gaping holes big enough for rodents to live and breed and threaten nearby children playing in their own yard. The owners lived in another state and had no interest in repairing the property, but did have the resources to hire an attorney and fight the city.
The Lakeview Civic Improvement Association has a process regarding blighted property, which starts with notifying the city by calling 311, the city’s catch-all service number. A complaint was filed for violating city codes, and the Code Enforcement Department researched the issue. Code Enforcement officers visited the property and determined there were violations, then assigned a case number and a hearing was set to address the violations with the owners. The blighted house has been inspected by Code Enforcement 5 times since 2009 and found to have a total of 37 violations, and none have been addressed by property owners.
2009-Hearing #1
On August 27, 2009, the first hearing occurred. The hearing took place at the Code Enforcement Department office at 1350 Poydras Street. Present were the hearing officers, 1 or 2 people who are employees of the Code Enforcement Department, looking out for the residents and enforcing the city housing laws. Also present were the homeowners or their attorney. There was a stenographer taking notes. At this first meeting, the hearing officer decided to “reset” the meeting, which means nothing happens and it is delayed. Everything is on hold to give the homeowner a chance to correct the code violations.
Hearing #2
Two months later, on October 14, 2009, the 2nd hearing occurred. Present was the hearing officer and the homeowner. The case was again “reset”.
Hearing #3
Two months later, on December 16, 2009, the 3rd hearing occurred, where the hearing officer issued a conditional guilty decision but “reset” the hearing. The judge waived over $15,000 in accumulated fines.
2010-Hearing #4
Three months later, on March 11, 2010, the 4th hearing occurred, and the hearing officer determined the homeowner was guilty of code violations and fined $574 plus $200 daily.
2011-Sheriff's Office Now Involved
The property further fell into disrepair, with the owners refusing to pay property taxes, so the Sheriff’s office put the house up for sale, since the City had imposed liens for code violations which went unpaid. The sale was stopped at the last minute.
2013-Hearing #5
The Code Enforcement Department finally assigned a case number # 12-07481-PNBL, after Code Enforcement found 5 code violations during an inspection on October 8, 2012. Almost one year later, on August 20, 2013, the 5th hearing occurs and an officer with the Code Enforcement Department determined the owners were guilty, fined them $575 plus $500 daily, and the property deemed a public nuisance and blighted.
2014-Hearing #6
After additional complaints by the Lakeview Civic Improvement Association and neighbors, a 2nd case number # 14-02430-MPM was filed by the Code Enforcement Department after an inspection on April 30, 2014, found 6 violations, and a 6th hearing granted which determined there was no work in progress and the case was closed.
Hearing #7
A 3rd case number, # 14-03102-MPM, was filed for 14 code violations, after a rodent living under the foundation attacked a child playing in her own yard. It turns out the owners were leaving food in their back yard for feral cats, which was also feeding the rodents. On September 4, 2014, a 7th hearing occurs where hearing officers determined the owners were guilty and fined them $1,694. On October 3, 2014, the property owners hired attorney Peter Derbes, who filed the 1st appeal #14-9692.
2015-Issue Goes To Civil District Court
On April 21, 2015, a 4th case number, # 14-09909-MPM, was filed by Code Enforcement for 2 violations but no hearing was set because the hearing officer said the case was under appeal. On May 28, 2015, property owner’s attorney, Peter Derbes, filed a 2nd appeal, #15-5043. On September 25, 2015, City attorney, William Goforth, consolidated both appeals into a new hearing in Civil District Court. On October 1, 2015, Claudia Riegel, director of the New Orleans Mosquito, Rodent & Termite Board was notified by neighbors about property owners feeding rodents at the property.
2016-Hearing #8 and #9
An 8th hearing was scheduled for January 15, 2016 with Judge Kern Reese, Division L, but the hearing was rescheduled but no date set. On April 25, 2016, Code Enforcement inspectors found 10 violations and a 5th case # 16-01802-MPM was filed. A 9th hearing was set for June 16, 2016. The Code Enforcement officer had the authority to waive the daily fees, so the fines were reduced to $2,500.
Neighbors Attend a Hearing Only To Have It Cancelled
On June 9, 2016, Code Enforcement noticed there are several verdicts and appeals and agreed if there is a judgment as a result of the hearing on June 16th that it might not move forward until the appeals are resolved. Code Enforcement agents agreed to contact the appeals department across the street to find out why the appeals had not been resolved. Once a judgment to foreclose is decided by a hearing by the city due to unpaid city liens, city attorneys would be responsible for proceeding to have the property auctioned off. On June 13, 2016, Cherrel Taplin, Senior Chief Deputy District City Attorney, emailed participants that a hearing was scheduled for September 9, 2016.
On June 16th, neighbors attended a 9th hearing at the Code Enforcement office, which was “reset” by code officers after discussing with Tammy Jackson, City Legal Advisor, because the owner’s attorney, Peter Derbes, produced a copy of an email stating he had talked with a code enforcement officer and that the hearing should not take place. This was contrary to information provided to the attending residents and the hearing officer. Residents met with Chad Dyer, Director of Code Enforcement, to discuss the blighted property and why it was granted appeals. Chad disclosed that he did not know why the property was appealed but if it was because of a problem in the City’s blighted process, it means the City has to give homeowners more than enough opportunity to fix the blighted property. Chad stated one significant issue occurred a few years ago and the cityy was found to be in violation of the blighted process and had to throw out 2,500 cases. He was concerned that if an attorney could prove the city's process was flawed, that the attorney could make the city pay his legal fees. Chad promised to research the reason for the appeals and reply to the residents. They never heard from him again.
Hearing #10
The two appeals were heard in Civil District Court under Judge Kern Reese, who ruled that the city had only notified one property owner, not all three, and dismissed $2,500 in fines.
Summary
Time since city was alerted: 7 years
Number of hearings: 9
Number of cases filed by Code Enforcement: 5
Number of violations: 37
Action taken by homeowner to fix violations: none
With a 77% increase in price, the gold medal for New Orleans' commercial real estate goes to the apartment sector, far outpacing every other sector of commercial real estate over the past year. The silver medal goes to the office sector with a 21% increase in average sale price, and the bronze goes to the industrial lease sector with an 18% increase in price.
Prices This Past Year for Major Sectors of New Orleans Commercial Real Estate:
Industrial For Sale +8.1%
Industrial For Lease +18.4%
Retail For Sale -20.4%
Retail For Lease +12.6%
Office For Sale +21.3%
Office For Lease +2.4%
Multifamily For Sale +77.4%
Industrial Sector
Sale Prices: Statewide, sale prices are lower than in New Orleans, but are experiencing a higher growth rate over the past year. In New Orleans, asking prices for industrial property average $61.93 per square foot, up 8.1% from one year ago, compared to an average price over the state of only $51.65 per square foot, but up 9.7% compared to one year ago.
The New Orleans industrial market is highly fragmented with Elmwood commanding the highest prices and New Orleans East bringing the lowest at around $20 per square foot.
Lease Prices: Asking prices have increased 18.4% over the past year for leasing industrial property in New Orleans ($7.09 PSF), compared to a 3.5% increase in the New Orleans-Metairie-Kenner metropolitan area ($6.65 PSF). Statewide saw a decline of almost 1% but commanded the highest lease rate averaging $7.13 PSF.
Retail Sector
Sale Prices: Retail prices in Louisiana, Orleans Parish and New Orleans were flat during 2013-2014, then only New Orleans' prices rallied hard from 70% to 100%, then peaked in March 2015 and have retrenched 30% to where most retail property is priced around $140 per square foot. Louisiana prices averaged an increase of 4.1% while New Orleans sale prices are up 20.4% over the past year.
Lease Prices: New Orleans retail lease prices experienced a 12% increase over the past year, averaging $21 per square foot, compared to only a 2.4% increase statewide, averaging a price of $14.13 per square foot.
Office Sector
Sale Prices: New Orleans Office sale prices exploded over the past year, increasing 21.3% and averaging $147.81 per square foot, compared to the Louisiana office sale price increase of 5.4%, averaging $103 per square foot. Lease Prices: New Orleans office lease prices have increased only 2.4% over the past year, averaging $17.08 per square foot, compared to the state average decrease of 2.1%, averaging a price of $15.58 per square foot.
Multifamily Sector
Sale Prices: With an average 77% increase in price over the past year, apartments experienced the strongest growth. The New Orleans apartment average asking price per unit increased from $60,000 in the summer of 2013 to over $125,000 per unit today.
Summary & Opportunities
New Orleans has a stronger market than the state does in four sectors: apartment sales, office sales and leasing, and retail leasing; however, the charts in every sector show prices can fluctuate both up and down wildly, and remember: past performance is no guarantee of future results.
Contact us today for more information on pricing commercial real estate in these cities:
Baton Rouge
Bossier City
Covington
Harahan
Harvey
Kenner
Lafayette
Lake Charles
Metairie
Monroe
New Orleans
Shreveport
Slidell
St. Rose
West Monroe
Pricing commercial real estate is vastly different from other assets, such as stocks and bonds where thousands of buyers and sellers state openly their best price and recent transactions are known by all. In fact, commercial real estate pricing is far from a highly competitive industry which must have transparency and all participants have easy access to information.
In commercial real estate, money is made when one party has superior information, meaning the other party has inferior information. Ironically, both parties feel their idea of price and value is accurate or a transaction would never take place. This article unveils recent prices of all 8 categories of commercial real estate in the New Orleans MSA and provides a math lesson showing how price is not affected by supply. Knowing current prices provides you with information that most commercial real estate participants don't have, and knowledge can help you make better real estate decisions.
Size of the Commercial Real Estate Market in the New Orleans Metropolitan Statistical Area
The commercial real estate market in New Orleans includes 8.2 million SF for sale and 8.5 million SF for lease, but the largest category is 366 million SF of land for sale.
Average Prices For The 8 Major Sectors of Commercial Real Estate
The Industrial and Office sectors have about 5 million SF available, the Retail sector around 3 million, not including 1 million SF of Shopping Centers, Apartments around 200,000 SF and the smallest sector is Hotels with around 100,000 SF available.
Office Market
Zeroing in on the 1,024 property Office sector, there are 142 properties for sale averaging $101 per square foot and 882 for lease averaging $17.35 PSF and on the market for 138 days, down 38 percent from the 12 month average of 223 days. During July 2016, 29 office properties were leased and 3 sold.
Office Sector Lease and Sale Prices With Days On The Market Comparing July With 3 Month and 12 Month Averages
Cause and Effect: Days On The Market and Lease Price
The chart comparing days on the market to lease price doesn't depict any correlation, but both are indicators of a strong office market resulting in the highest lease prices in 24 months and properties being leased the fastest since 2014, back when Ebola was a problem and the Iphone 6 was announced.
Industrial Sector
The 5.6 million SF Industrial sector has only 273 properties, with 192 for lease averaging $4.60 per square foot and 81 for sale averaging $69 PSF and on the market for 259 days, down 28 percent from the 12 month average of 364 days. During July 2016, 7 properties were leased and 2 sold.
Comparison of Industrial SF For Sale and For Lease
While the Industrial square footage over the last 12 months has ranged between 2.5-3.0 million SF, going back to early 2014 shows how the Industrial sector has tripled the square footage coming onto the market for both sale and lease.
Comparison of Industrial Lease Price and Square Footage
There does not seem to be a correlation in the Industrial sector between lease price and supply. Since 2014, the supply of SF for lease has increased from around 1 to 2.7 million, but the price has stayed around $5 PSF.
Can Math Prove That Price and Supply (SF) Are Not Related
You can test this mathematically, using a statistical term called Correlation, or how strongly two sets of data are related. Excel makes it easy. Just copy the data below into Excel.
Table of Industrial Prices and Square Feet Last 24 Months
Month
Price
SF
2014-04
4.60
1,097,714
2014-05
4.74
1,191,966
2014-06
5.13
1,373,344
2014-07
4.76
1,424,003
2014-08
6.28
1,489,141
2014-09
6.52
1,701,071
2014-10
6.79
1,814,324
2014-11
6.54
2,108,881
2014-12
6.97
2,686,484
2015-01
6.44
2,678,266
2015-02
4.65
2,653,680
2015-03
4.38
2,676,633
2015-04
6.20
2,515,386
2015-05
6.32
2,450,285
2015-06
6.72
2,558,397
2015-07
5.38
2,693,481
2015-08
4.68
2,799,854
2015-09
10.60
2,697,487
2015-10
4.86
2,887,840
2015-11
4.06
2,951,164
2015-12
3.58
3,027,771
2016-01
6.88
2,882,150
2016-02
7.10
2,844,831
2016-03
5.93
2,244,517
2016-04
2.23
2,377,821
2016-05
4.93
2,358,527
2016-06
9.28
2,525,389
2016-07
4.38
2,406,397
Click tabs formulas, more functions, statistical, then scroll to CORREL. Copy and paste Price cells into array1 and SF cells into array2. The result is .0928 which is 9.28%. That means square footage only explains 9.28% of the change in price. This works for any comparison of data, even temperature versus snowball sales.
Summary
Both the Office and Industrial sector in the New Orleans MSA are experiencing strong markets, where prices hold despite an increase in supply. Prices for the most active sectors are:
Office-$17.06 PSF
Industrial-$5.75 PSF
Retail-$14.16 PSF
Shopping Centers-$13.26 PSF
For more information on how to value commercial real estate, read our article, How To Value Commercial Property Using Cap Rate.
For a free market valuation of any commercial property, just call or email our office.
Robert Hand, MBA, CCIM, SIOR
Louisiana Commercial Realty, LLC
One Lakeway Center
3900 North Causeway Boulevard-Suite 1200
Metairie, Louisiana 70002
Phone: 504-289-8172
New Orleans once was one of the largest cities in America- for over 140 years. Today it is an exciting place to live with an intoxicating culture steeped in its 300 year old history, but for those who have lived here long enough to see their children go from the "Trinity Pink Party" to LSU Engineering School, a silent but deadly penalty stymies the growth of wealth. Nobody talks about it, but we all endure it. You don't realize how big of a penalty it is until you visit other cities and see how their growth far surpasses the growth of New Orleans, and has been for years. The challenge is to understand our history of wealth creation as a city and then to do something about it to make it better. It requires a long term strategy and local and state government action.
This article uncovers the reality of wealth creation in New Orleans which is composed mostly of real estate and not stocks or bonds, and suggests some reasonable solutions to make things better. We conclude by tying in how population growth creates wealth in home prices and commercial real estate.
New Orleans Was In The Top 20 For Over 100 Years
New Orleans was founded by Jean-Baptiste Le Moyne de Bienville in 1718 and in 1722 replaced Biloxi as the capital of French Louisiana, but was destroyed by a hurricane in 1722. In 1763, New Orleans was given to the Spanish, confirmed by the Treaty of Paris. In 1800, Spain gave Louisiana back to France and in 1803, Napoleon sold it to the United States in the Louisiana Purchase. Due to demand for sugar and invention of the cotton gin by Eli Whitney, along with the competitive advantage of being a port city, New Orleans' population grew from 10,000 in 1805 to 100,000 in 1840, making it the 4th largest city in the United States.
In 1810 New Orleans Ranks #7 In U.S. Population
In 1810, New Orleans ranked number 7 with a population of 17,242 even though it was not one of the 13 original colonies.
table 1810 population New Orleans number 7
From 1820 To 1840 New Orleans Grows To Top 5 In Population
With the advantage of being a port city and the ability to trade sugar and cotton, New Orleans remained a Top 5 City In The U.S. until 1840.
table population New Orleans 1820 to 1840
From 1850 to 1950 New Orleans Ranks In Top 20 in Population
For another 100 years, New Orleans maintained its population ranking among the TOP 20 U.S. Cities.
table population 1850 to 1960
New Orleans' Population Peaked In 1950
The highest population for New Orleans Metropolitan Area was in 1950 at 660,000, ranking it the 20th most populated city in the United States. Houston ranked 18th at 701,000 and New York 1st at 12,600,000. Today, the New Orleans Metropolitan Area has a population of 1.2 million, Houston has 5.6 million and New York has 20 million. In percentage terms, New Orleans has grown 1% annually since 1950 while Houston has grown 11% annually.
chart population growth since 1950
What Population Growth Means To You
The lesson to be learned from history is that for 140 years, from 1810 to 1950, New Orleans was a major city in the United States, with a transportation hub in its port and growing industry and wealth creation. Then it plateaued. The reason population growth is important is because it is the driver to a city's economy and causes home prices to increase which drives wealth creation which drives consumer spending due to more disposable income which drives commercial real estate development. Most of the research from the National Bureau of Economic Research on home prices centers on affordability, or income relative to home prices. When home prices increase, they become less affordable. The important point is that as a city's population increases, there is a higher number of consumers, and even if they have no increase in income, the growth in numbers will result in higher gross disposable income which will drive commercial real estate development of retail stores to satisfy that disposable income, apartments and hotels to meet the need of increased housing, and eventually warehouses to meet the needs of the businesses that supply to those businesses. It is a Domino Effect.
The Average Household Has Most Of The Wealth In Real Estate
The increase in population drives real estate prices higher, which leads to higher wealth for individuals since most of their wealth is in their home and rental property, not in stocks and bonds. This is especially true in New Orleans because as a nearly 300 year old city, there are many generations to have passed along the fully paid for family home and rental property to their children. The U.S. Census research shows, on average across America, that 68 percent of a household's wealth is in real estate.
where is the average household's wealth?
The New Orleans Penalty
The hidden penalty since the 1950's for those of us living in New Orleans has been that compared to those who moved to Houston, our real estate has not increased as much in value, and therefore our net worth has not increased as much. Correlating home prices to population growth would allow us to put this into numbers. Since 1950, a $200,000 home in New Orleans would now be worth $400,000, but in Houston would be worth $1.4 million. While nobody would say a gain of $200,000 in wealth was immaterial, it wouldn't pay for retirement or an out of state college education. In Houston however, the same home would have created wealth of $1.2 million which could finance a condo in Destin, a college education and still have $600,000 left over for dinner at Galatoire's and karaoke at Cat's Meow.
How New Orleans Can Get Back On Track
The solution is for New Orleans to get back on track by focusing on population growth, and we are already making headway because visitors and entrepreneurial Tulane students are choosing to stay and live and work here. In order to attract large businesses like General Electric, who is hiring 200 software engineers, we need to have a pipeline of engineers fed from well educated high school students, and not just $60,000 dollar a year private schools. New Orleans has to bring professional leadership to its Board of Education and provide real measurable results-oriented teaching. We need accountability in the police department and a partnership with the judicial system to reduce crime which can be a major reason why people don't move here. We need a fire department that doesn't mismanage their members' retirement savings, causing the City to fund a $17 million dollar shortfall. Imagining a city growing to 5 million in population means we need high speed rail to the airport from downtown, and a reduction in the 20% tax on the hospitality industry. Eliminating state income taxes with bring businesses and retirees to the area fast.
Getting New Orleans back on track can be accomplished, we just have to look back at why we were at the top for over 140 years, and figure out how to do it again.
For more articles on New Orleans real estate and how demographics affect commercial real estate, go to Louisiana Commercial Realty, LLC.
Notes and Sources:
Metropolitan Area is defined as: Metropolitan and micropolitan statistical areas (metro and micro areas) are geographic entities delineated by the Office of Management and Budget (OMB) for use by Federal statistical agencies in collecting, tabulating, and publishing Federal statistics. The term "Core Based Statistical Area" (CBSA) is a collective term for both metro and micro areas. A metro area contains a core urban area of 50,000 or more population, and a micro area contains an urban core of at least 10,000 (but less than 50,000) population. Each metro or micro area consists of one or more counties and includes the counties containing the core urban area, as well as any adjacent counties that have a high degree of social and economic integration (as measured by commuting to work) with the urban core.
You need parking for 75 people, but how do you convert this into useful information, such as square footage of land?
A good rule of thumb is to allow just as much square footage for parking as you estimate you will need to allow for any building, whether it is office, or retail, or apartments. This article explores how to accurately calculate how many parking spaces can be configured, for a given square footage.
Gross Floor Area Determines Required Number of Parking Spots
It all starts with zoning regulations. Parking spaces are required by the parish zoning department, unless the property is located in an incorporated area, such as Kenner, where the city zoning code overrides the parish code. Requirements in the Zoning Code are posted online, under Chapter 40, Article 35, of the Comprehensive Zoning Code, and there are 28 different zoning uses, each with their own parking requirements.
Table of Jefferson Parish Zoning Districts
B-1 Batture District.
S-1 Suburban District.
R-1D Rural Residential District.
R-1C Rural Residential District.
R-1B Suburban Residential District.
R-1A Single-Family Residential District.
R-1 MH Manufactured Home District.
R-2 Two-Family Residential District.
RR-3 Three- and Four-Family Residential District.
R-1 TH Townhouse District.
R-1 CO Condominium District.
CD-R Core District-Residential.
R-3 Multiple-Family Residential District.
GO-2 General Office District.
GO-1 General Office District.
H-1 Medical Service District.
H-2 Medical Service District.
BC-1 Business Core District.
C-1 Neighborhood Commercial District.
BC-2 Business Core District.
C-2 General Commercial District.
OW-1 Office Warehouse District.
M-1 Industrial District.
M-2 Industrial District.
M-3 Industrial District.
M-4 Industrial District.
U-1 Unrestricted District.
MUCD Mixed-use Corridor District.
Number Of Parking Spaces Required Depends On Floor Space
For example, if a property is zoned C-1, Neighborhood Commercial District, the requirement for Business and Professional Office is one space for each three hundred square feet of gross floor area, but for General Business, Commercial or Personal Service Establishments, catering to retail trade, including "Supermarkets" , the requirement is one space for each 200 square feet of gross floor area.
If there is more than one use for a property, the number of required parking spaces can vary. For example, in the table below for a property with 50% office use and 50% grocery store use, the required number of parking spaces is reduced to 25% for the use after 6pm.
Table of Required Parking Spaces For Mixed Use Properties
Configuration Of Required Number Of Spaces And Size
In Jefferson Parish, parking spaces are required to be at least 8 feet 6 inches wide and 19 feet long, called a stall; however, there is also a requirement of 24 feet for the parking place access, called the aisle. In the drawing below, there are three main measurements: (A) Stall width (B) Stall length (C) Aisle
Parking Configuration
One Acre Provides 144 Parking Spaces
Given this, how many square feet would you need to allow if you needed parking for 50 employees, and 100 customers? This would accommodate an office size of 45,000 square feet, assuming one parking space for every 300 square feet of floor space, or a retail size of 30,000 square feet, assuming one parking space for every 200 square feet of floor space. Many developers use a larger width than required, usually a parking spot measuring 10 feet wide but the standard length of 18 feet long and a 24 foot aisle. The image below shows how this configuration would all three rows of 48 parking spaces, for a total of 144 parking spaces on a lot 180 feet by 242 feet, or 43,560 square feet which is one acre.
When you purchase commercial real estate, one of the top 5 things you need to know on day one should be the parking requirement. Parking requirements are established by the Department of Planning in the Parish where the property is located. If the property is located in an incorporated city such as Kenner, they will have their own zoning codes which override the Parish zoning codes. The Planning Department also includes departments regulating zoning as well as code enforcement, and you need to meet or, at least, talk to all three before you make an offer to buy any New Orleans commercial property.
Jefferson Parish Zoning Codes & GIS Map
Here is an example. Say you want to buy land and build an office building in Jefferson Parish. You have 20 employees and need approximately 2,500 square feet of office space and parking for employees and a few customers. The zoning is BC-2, and the lot you are considering measures 60 feet wide by 100 feet deep. First you need to confirm zoning district BC-2 allows office buildings.
Determining Zoning
Jefferson Parish allows you to confirm the zoning using an overlay map. All you have to do is insert your target property street address on their GIS Property Website, http://jp-appserver.jeffparish.net/webapps/webmap/. Since vacant land often has no known address, select a nearby building with an address, then click your target site from the GIS map to bring up the lot description and zoning information.
GIS Map Website
The definition of each Jefferson Parish zoning code can be found at http://library.municode.com/index.aspx?clientId=14447, under Chapter 40, Comprehensive Zoning Ordinance. All the information about zoning district BC-2 is under Article 24, Business Core District. The first paragraph of the zoning code explains the purpose of the zoning district:
This district encompasses an area of high density and intensity development situated on principal thoroughfares and represents an urban mixed-use core. The areas of high intensity development contain office, retail, and service uses and represent a local and regional employment and shopping commercial center. They also contain dense residential development as single uses or mixed with commercial uses to create an urban environment with diverse choices for living and working.
Then the code describes permitted uses, which are different from conditional uses:
Sec. 40-422. Permitted uses.
In BC-2 Districts only the following uses of property shall be permitted:
(1) Any existing stand-alone one-, two-, three-, or four-family residential dwelling shall be considered as a conforming use. However, the existing stand alone one-, two-, three-, or four-family residential dwelling shall not be restored if it is destroyed beyond seventy-five (75) percent or more of its value.
There was nothing about allowing office buildings, but we need to read the code further.
Jefferson Parish Zoning Code Explanations
The code further describes a whole host of permitted uses , including banks, bakeries, barber shops, bars, tailors, garages, hospitals, hotels, offices and restaurants, et cetera. Look for your specific business in that description and if it is not mentioned, call the planning department for verification in writing.
Setbacks
A setback is the distance from the curb from which no buildings can be erected. Using the Area Regulations below for BC-2, a building needs to be 20 feet from the curb, and 10 feet from each side and 15 feet from the rear lot line. So if our lot is 60 feet by 100 feet, our building can be no larger than 65 feet by 40 feet.
Sec. 40-424. Area regulations.
The following regulations shall be for structures sixty-five (65) feet or less in height. Regulations for structures exceeding sixty-five (65) feet in height are stated in the site plan review section of this list.
(1)Setbacks.
a.Front yard.
1.All structures shall be a minimum of twenty (20) feet from the street right-of-way.
2.On through lots the required front yard shall be provided on both streets.
b.Side yard.
1.All structures shall be a minimum of ten (10) feet from the property line.
2.On the side of a lot abutting a residential district or a residential structure, there shall be a side yard having a minimum width of fifteen (15) feet.
3.On corner lots the side yard on the side of the lot abutting the side street shall not be less than ten (10) feet.
c.Rear yard.
1.All structures shall be a minimum of fifteen (15) feet from the property line.
2.On the rear of a lot abutting a residential district or a residential structure there shall be a rear yard having a minimum depth of twenty (20) feet.
d.Lot area.
1.Each lot shall have a minimum lot width of fifty (50) feet and a minimum lot depth of one hundred (100) feet and contain five thousand (5,000) square feet of lot area.
2.When living facilities are erected above or in connection with other uses, the lot area per family regulation shall be the same as those in the R-3, Multiple Family Residential District.
Height, area, sign regulations and site plan reviews are explained, but off-street parking is referred to in Article 35.
Off-Street Parking Regulations in Jefferson Parish
Each use requires a different parking requirement, usually according to square footage. Notice General Business and Retail require one parking space for every 200 square feet of gross floor area but Business and Professional Offices require only one space for every 300 square feet of gross floor area. For a 2,500 square foot building, we would need 8.33 parking spaces. If the calculated number is less than 1/2, you can round down, but if were over 8.5, we are required to round up to 9 parking spaces.
(1)? Archery, Golf Driving, Shooting, similar ranges; and Miniature Golf, and other similar activities
1½ spaces for each station, tee, or 2 holes.
(2)? Automobile Repair Garage
One (1) space for each employee.
(3)? Bowling Alleys
Five (5) spaces per alley.
(4)? Batting Cages
Outdoor: Two (2) spaces per station Indoor: One (1) space for each two hundred (200) square feet of gross floor area.
(5)? Business and Professional Offices
One (1) space for each three hundred (300) square feet of gross floor area.
(6)? Child Care Center
Four (4) spaces plus one (1) space per five hundred (500) feet of gross floor area.
(7)? Churches, Temples and other Places of Worship
One (1) space for each ten (10) seats in main auditorium.
(8)? Clinics
One (1) space for each four hundred (400) square feet of gross floor area.
(9)? Clubs and Lodges
One (1) space for each three (3) members plus one (1) space for each sixty (60) square feet of gross floor area that is available to the general public.
(10)? Commercial Amusement activities
One (1) space for each two hundred (200) square feet of gross floor area.
(11)? Commercial Manufacturing and Industrial Establishments not catering to Retail Trade
One (1) space for each three (3) employees on the largest work shift plus one (1) space for each company vehicle operating from the premises.
(12)? Dance Halls, Exhibition Halls, Bingo Halls and Places and Gymnasiums
One (1) space for each sixty (60) square feet of gross floor area.
(13) Dwellings - Single-family
One (1) space per dwelling unit
??Two-family
One (1) space per dwelling unit,
??Three- and four-family
One and one-half (1.5) spaces per dwelling unit,
??Multiple-family
One and one-half (1.5) spaces per dwelling unit.
For multiple-family dwellings or condominiums that exceed the maximum height allowed by right, the following requirements apply: One and one-half (1.5) spaces per dwelling unit for efficiency and one-bedroom; and two (2.0) spaces per dwelling unit for two (2) or more bedrooms
(14)? Elderly Housing and Assisted Living Facility
One (1) space for each two (2) Assisted Living Facility dwelling units plus one (1) additional space for each four (4) employees on the largest shift. Parking for any use other than allowed under the definition of Assisted Living Facility as stated in section 40-3, Definitions of this ordinance, shall be determined in accordance with the requirements for the individual use and shall be computed separately. Elderly Housing - One (1) space for each dwelling unit plus one (1) additional space for each four (4) employees on the largest shift. Parking for any use other than allowed under the definition of Elderly Housing as stated in section 40-3, Definitions of this ordinance, shall be determined in accordance with the requirements for the individual use and shall be computed separately.
(15)? Furniture Store, Appliance Center and Computer Stores
One (1) parking space for every three (3) employees plus one (1) parking space for each six hundred (600) square feet of gross floor area.
(16)? Casino, Gaming Establishments and/or Gaming related activities and accessory uses
1. One (1) parking space for each fifty (50) square feet of gaming area, plus one (1) space for each employee at the maximum shift.
2. Bus parking shall be provided at a rate of one and one-half (1.5) percent of the above required parking spaces. The minimum bus parking space shall be a minimum of twelve (12) feet in width and forty-five (45) feet in length exclusive of access or maneuvering area, ramps and other appurtenances.
3. On-site accessory uses or structures shall provide off-street parking in accordance with the requirements otherwise listed in Article XXXV, Off-Street Parking, Loading, and Clear Vision Area Regulations.
(17)? General Business, Commercial or Personal Service Establishments, catering to retail trade, including "Supermarkets"
One (1) space for each two hundred (200) square feet of gross floor area.
(18)? Home Occupations
One (1) space in addition to the parking space(s) required for the residential use.
(19)? Hospitals
One (1) space for each four (4) beds plus one (1) space for each staff doctor plus one (1) space for each four (4) employees including nurses.
(20) Hotel
One (1) space per guest room; plus one (1) space for every two hundred (200) square feet of gross floor area used for restaurants and lounges; plus one (1) space for every two hundred (200) square feet of gross floor area used for convention facilities, meeting rooms, banquet halls, or similar uses.
(21) Kennels and Animal Hospital
One (1) space for each four hundred (400) square feet of gross floor area.
(22) Kindergartens, Family Day Care Homes, Nursery Schools or Pre-Schools
One (1) space for each ten (10) children.
(23) Libraries and Museums
One (1) space for each four hundred (400) square feet of gross floor area.
(24) Mini-Storage Structure
One (1) space for each three thousand (3,000) square feet of storage area or one (1) space per one hundred (100) storage units, whichever is greater.
(25) Motel
One (1) space for each guest room plus one (1) additional space for manager.
(26) Nursing and Convalescent Homes and Institutions
One (1) space for each eight (8) beds.
(27) Off-track wagering facilities
One (1) space for each fifty (50) square feet of floor area used for video poker (if applicable) plus one (1) space for each remaining one hundred fifty (150) square feet of gross floor area.
(28) Printing Establishment
One (1) space for each employee plus one (1) space for each company vehicle operating from the premises.
(29) Restaurants and Lounges
One (1) space for each one hundred fifty (150) square feet of gross floor area.
(30) Riding Stables
One (1) space for each four hundred (400) square feet of covered area of such stable.
(31) Roadside Stands
Five (5) spaces for each such establishment.
(32) Schools, Dancing and Music
One (1) space for each ten (10) pupils or students.
(33) Schools, Public and Private
Elementary and junior high schools, two (2) spaces per classroom, laboratory or manual training shop.
High schools, eight (8) spaces per classroom, laboratory or manual training shop.
Colleges, universities, trade, industrial and business schools, ten (10) spaces per classroom, laboratory or other teaching room.
(34) Schools having Auditoriums, Gymnasiums, or Sports Arenas
Schools with such facilities shall have parking that accommodates the highest number of parking spaces required when the required parking spaces for the school and each such facility are calculated; i.e., the use requiring the highest number of parking spaces shall be the parking requirement that applies.
(35) Skating Rink
One (1) space for each one hundred fifty (150) square feet of gross floor area.
(36) Theaters, Auditorium, Sports Arenas and Places of Public Assembly
One (1) space for each three (3) seats or twenty (20) spaces per athletic field without seating. Multipurpose athletic fields without parking shall provide parking for all possible field arrangements; e.g., one (1) football-sized field that will also be used for two (2) baseball diamonds shall provide parking for two (2) athletic fields.
(37) Townhouses
One (1) space
In our example, we have 20 employees and need at least 20 parking spaces, even though only 8 parking spaces are required. The Jefferson Parish website http://www.jeffparish.net/index.aspx?page=229 spells out the requirements for parking spaces in a pdf at http://www.jeffparish.net/modules/showdocument.aspx?documentid=1013.
Parking Spaces in Jefferson Parish Are 9 Feet by 18 Feet
The required stall dimensions are 9 feet by 18 feet with a travel isle of 24 feet.
parking dimensions
So for a parking area for 20 employees you could place 10 parking spaces on each side of the lot with the 24 foot travel isle in the middle. This would take up 90 feet since each of the 10 parking spaces is 9 feet wide, and would require a width of 60 feet, since two rows would be 18 feet each plus a 24 foot travel isle. So your parking area is 90 feet by 60 feet. Since your lot is 100 feet by 60 feet, you will need to build your building raised with parking underneath, and you will have 10 feet left over in your 20 parking spot office building.
One more requirement: the parking area cannot include the support columns of a raised building. If each column in your raised building is 2 feet square, then you can have no more than 5 support columns in each parking area which would take up the left over 10 feet in your 20 parking spot lot that requires 90 feet of the 100 foot lot.
Summary
So now you know where to find your zoning, how to determine what permitted uses the zoning allows, and how to determine the parking requirement and where to find it.
You also now know that you need to build your 20 parking space building above the ground with five support columns nine feet apart on each side, and that in zoning district BC-2 you are only required 8 parking spaces but are permitted for office use.
It's really smart to bring in experts when facing major decisions and a purchase of high value real estate is no exception; however, there is a widespread trend, while not illegal, that many real estate professionals consider unethical: the inspection renegotiation.
Stop The Insanity!
Somewhere between Suzanne Somers' Thigh Master and PX-90, Crossfit and Pilates, there was Stop The Insanity, one of the first TV exercise programs by Susan Powter to go viral. It's the same message that arises today, only that it involves the real estate industry and the conspiracy of using inspections to renegotiate prices after an agreement has already been negotiated. The insanity is the exaggeration of inspection reports which are couched in language that convinces buyers to renegotiate the price of an already negotiated transaction, based on careful worded language, overlaid with a 72 hour time deadline that does not allow each party enough time to gather the facts to make a rational decision.
Case Study
For example, we present to you, as Rod Serling would from the Twilight Zone, a case study of an inspection of the foundation of a typical home uptown, where the buyer asked for a $6,700 discount from the agreed upon price, due to the following opinion from a well-known, highly regarded, residential and commercial inspection company:
We noted long spans at the intermediate sill sections in the right and left of the crawl space. These long spans can lead to sagging of the floor framing, and we recommend that additional piers be installed between the existing piers to reduce the spans on these sills. (approximate costs to cure - $4,000 to $6,000)
Any prudent person would read this language and come to the conclusion that there is a major deficiency and ask for a price reduction of $4,000 to $6,000 off the purchase price, since this was an problem that could not be detected at the time the original purchase price was negotiated.
Here is a 2nd case study of a foundation report from a well-known inspection company:
The foundation piers have typical minor age settlements and tilting. A few of the piers have minor soft and eroding mortar, but repairs are not currently required. Many of the center piers shims do not extend the full length of the piers, which provide uneven or inadequate bearing surface. We recommend that these shims be replaced with noncompressible materials such as slate or concrete block. (approximate cost of repairs $300)
The insanity is that these two opinions are written by the same inspector on the same house.
One opinion states repairs are "not currently required" and the other states "we recommend additional piers be installed" at a cost of $4,000 to $6,000. The problem affects real estate agents, operating with the highest ethical standards to represent their clients, when they try to help their clients renegotiate the price to compensate their clients for the inspections reports' deficiencies, when in fact the deficiencies that agents are fighting for are misrepresented.
NAR, LR, and NOMAR Don't Help Real Estate Agents With This Dilemma
The Code of Ethics that might address this issue for real estate agents should be written by the National Association of Realtors; however, there is no guidance of how agents should address the issue. There is no Code of Ethics for Louisiana Realtors, but they do have bylaws, but they do not address the issue. The same applies to (NOMAR) New Orleans Metropolitan Association of Realtors, which has no Code of Ethics but does have bylaws.
Home Inspectors Code of Ethics
There is guidance for home inspectors, regulated by the Louisiana State Board of Home Inspectors, who produces a Code of Ethics and a Standard of Practice, which states the inspection report shall include:
Hidden away in Chapter 5, section B-10, Title 46, Part XL, of the Professional and Occupational Standards of the Louisiana State Board of Home Inspectors is the only language that establishes guidelines on the issue:
The LHI shall be objective in his reporting and shall not knowingly understate or overstate the significance of observed conditions.
Where Is The Incentive
Any good company CEO, parent of a 4 year old or owner of a chocolate lab knows that in order to change behavior, all you have to do is make sure your incentive creates the behavior that matches your goal. The disconnect is that the incentive for the inspection company is to get hired to produce a report that has language which justifies to the purchaser a renegotiation in the price of the property. The real estate agent is an unknowing participant in this process, especially if they are impassioned about looking out for their client's best interest. The loser is the real estate industry, which suffers from the disappointment by both buyers and sellers at the process, because both are relying on their experts and examine the same situation and come to the insanity of opposite conclusions.
A Few Good Men and Women
There is an underground movement to change the system. Some real estate agents, both commercial and residential, are aspiring to higher ethical standards where they discuss with their clients how inspections are predisposed to look for problems and since New Orleans is almost 300 years old, it is different from Houston where old properties are measured in single digit years, and buyers must distinguish between acceptable wear and tear and major deficiencies.
What Can You Do To Make Your Voice Heard
If you have an opinion on whether agents should or shouldn't encourage their clients to renegotiate inspections, or have a life experience to share, email the President of the National Association of Realtors, Chris Polychron, your opinion. With your input, the organization that represents you can incorporate your voice into the Code of Ethics that guides our industry to a higher level of service to our clients.
Louisiana is second in the nation in refinery capacity and has 112,000 miles of pipeline carrying crude oil and natural gas, so will the collapse in the price of oil also cause a collapse in Louisiana's economy?
Uncle Jed Missed The Rabbit and Hit Oil Only Once
In the early days of Merrill Lynch, a new stockbroker overheard a breaking news report that hydrocarbons were discovered off Louisiana's coast in the Gulf of Mexico, causing the novice to blurt out, "I thought they were looking for oil."
Gone are the days of gushing oil wells because the new technology of fracking has reduced oil prices by increasing supply, which has caused oil prices to plummet. The price of oil fell over 50% from 2014 to March 2015, then bottomed, rallied some, but is still down 40% over the last year.
How Much Does Oil Contribute To Louisiana's Economy
Oil only accounts for 12 percent of Louisiana's real gross domestic product, but that still adds up to $73 billion. And for every job lost in the oil patch, there are on average 3.4 jobs affected in other industries inside Louisiana. The 40% drop in oil price over the last year correlates to a drop of 4,000 people on the payroll in the goods-producing sector.
Summary
Consumers should batten down the hatches and prepare for a storm. Businesses should delay capital expenditures and long term hiring until the storm clears. After the down cycle loses steam, jobs will stabilize and strong businesses can take advantage of opportunities.
Do you make policy for your company? View this podcast "Oil Prices and the Economy" by the Atlanta Federal Reserve.
For more information on economic drivers in the 10 parish area around New Orleans, read our article, Which Industry Drives Louisiana's Economy, Oil or Tourism?
Sources: Bureau of Labor, Bureau of Economic Analysis, Federal Reserve
Louisiana first encouraged the movie industry to come here in 2002, when the legislature passed the Motion Picture Tax Credit Program, but it didn’t catch on until we beefed it up in 2005, and this year the incentives are producing spectacular results. In the 63 years before the incentives were created, 52 movies were made, including the favorite Easy Rider in 1969; in the 13 years after, 295 movies were made. In 2015, we are on track to produce 36 movies, about the annual average the last 6 years.
What Are The Incentives That Created A New Industry
The Motion Picture Tax Credit Program offers a 30% rebate on spending inside Louisiana, and an additional 5% for hiring Louisiana residents. Many banks and law firms broker these tax credits which can be sold to investors and used to offset Louisiana income taxes, either corporate or personal. So Tom Benson, or Shell Oil, who pay large amounts of state income taxes, can buy these tax credits for a fraction of the value, and use them to pay their taxes. Donald Trump, not so much.
The money they pay for the tax credits goes to the movie company as cash which they use to finance the movie. So it lowers the cost of the movie, which encourages them to come to Louisiana. For example, at the premier for the movie, RAY, about Ray Charles and starring Jamie Foxx, producer Taylor Hackford said he strongly considered making the movie in Canada, but switched to Louisiana because of the tax incentives.
They Shoot Movies in Lafayette, Don't They?
According to the Louisiana Film Entertainment Association, Louisiana is the third largest film production center outside of New York and California. Last year the film industry created 12,107 jobs averaging $60,000 annual wages and spent 776 million dollars, resulting in local and state taxes of $65 million, excluding wages to actors, producers, directors and writers.
So what did Louisiana do with this new wealth? Representative Joel Robideaux from Lafayette terminated its growth by introducing a law putting a cap on tax credits of $250 million. The law went to the governor for signature last week. To see how your legislator voted, see the legislature website vote.
Spending In Louisiana By Movie Companies By Year
In The Can
These movies are in the works for this year:
2015
MOVIE
TYPE
MOVIE COMPANY
The Devil and the Deep Blue Sea
Feature Film
Scream Queens
TV Series
Brightstar Fox Productions
Pitbulls & Parolees Season 7
TV Series
Animal Planet
Ghostly Matters
MOW
G-Wave Productions
Beyond Deceit
Feature Film
Mike and Marty Productions
Nightwatch Season 2
TV Series
44 Blue Productions
Into the Badlands
TV Series
Stalwart Films
The Big Short
Feature Film
Plan B Productions
Keanu
Feature Film
Chime Productions
Carter & June
Feature Film
Spencer Rabbit LLC
Rodeo & Juliet
Feature Film
When the Bough Breaks
Feature Film
Screen Gems
Quarry
TV Series
HBO/Cinemax
Zoo
TV Series
CBS Television
The Long Night
Feature Film
Lionsgate/Di Bonaventura Pictures
Elvis & Nixon
Feature Film
HW Productions
The Free State of Jones
Feature Film
Larger Than Life Productions
Chasing Moksha
Feature Film
Independent
These movies were made previously:
2014
NOLA Circus
Feature Film
Independent
The D Train
Feature Film
Ealing Studios
Our Brand is Crisis
Feature Film
Warner Bros.
Midnight Special
Feature Film
Warner Bros.
Mississippi Grind
Feature Film
Sycamore Pictures
Cat Run 2
Feature Film
Independent
Get Hard
Feature Film
Warner Bros.
Jurassic World (Ebb Tide)
Feature Film
Universal
Terminator Genisys
Feature Film
Paramount/Skydance
The Best of Me
Feature Film
Relativity Films
American Ultra
Feature Film
Likely Story
Pitbulls & Parolees Season 6
TV Series
Animal Planet
NCIS: New Orleans (Pilot)
TV Pilot
CBS
Hot Pursuit (Don’t Mess with Texas)
Feature Film
Warner Bros.
American Horror Story: Freak Show
TV Series
Fox
Black Ink: New Orleans
TV Series
VH1
Saints & Sinners (Pilot)
TV Pilot
A&E
Geostorm
Feature Film
Skydance/Warner Bros
Mind Puppets
Feature Film
Itaca Films
Adam Divine’s House Party
TV Episode
Bacon Bar Productions
The Runner
Feature Film
Paper Street Films
Trumbo
Feature Film
Groundswell Productions
The American Project
Feature Film
Independent
The Whole Truth
Feature Film
Likely Story
NCIS: New Orleans Season 1
TV Series
CBS
Banshee
TV Episode
HBO/Cinemax
Astronaut Wives Club
TV Series
ABC Television
Man Down
Feature Film
Mpower Pictures
Mr. Right
Feature Film
Amezia Productions
Valencia
Feature Film
Bad Robot
Nightwatch
TV Series
A&E
Kidnap
Feature Film
Relativity Studios
Saints & Sinners
TV Series
A&E
Daddy’s Home
Feature Film
Paramount
Abattoir (Crone)
Feature Film
Radical Studios
The Magicians
TV Pilot
NBC Universal
Joe Dirt 2
Feature Film
Sony/Crackle
Kickboxer
Feature Film
2013
Cat Run 2
TV Episode
KOG Productions
Return to Sender
Feature Film
HW Productions
Una Vida
Feature Film
Independent
Grudge Match
Feature Film
Warner Bros.
True Detective
TV Series
HBO Entertainment
Remember Sunday
MOW
Hallmark Channel
Pitbulls & Parolees Season 5
TV Series
Animal Planet
Now You See Me Reshoots
Feature Film
Summit Entertainment
Heat
Feature Film
Current Entertainment
When The Game Stands Tall
Feature Film
Mandalay/Sony
The Originals
TV Pilot
Warner Bros.
Devil’s Due
Feature Film
Fox
Oxygen
TV Pilot
CBS Studios
Second Sight
TV Pilot
CBS Studios
Reckless
TV Pilot
ABC Studios
American Horror Story: Coven
TV Series
Ryan Murphy Television
Home Sweet Hell
Feature Film
Darko Entertainment
Hot Tub Time Machine 2
Feature Film
MGM/Spyglass
Dawn of the Planet of the Apes
Feature Film
20th Century Fox
American Heist
Feature Film
Glacier Films
Occult
TV Pilot
ABC Studios
Top Chef Season 11
TV Series
Bravo
Dermaphoria
Feature Film
Upload Films
Black or White
Feature Film
Sunlight Productions
Star-Crossed
TV Series
CBS Television Studios
Focus
Feature Film
Warner Bros.
Ravenswood
TV Series
CBS Studios
Self/less
Feature Film
Endgame Entertainment
Maggie
Feature Film
Gold Star Films
22 Jump Street
Feature Film
Sony
99 Homes
Feature Film
Noruz Films
Refugio
Feature Film
Itaca Films
Kidnapping Mr. Heineken
Feature Film
Informant Films
For more information on what drives our economy, click on these articles:
Which Industry Drives Louisiana's Economy?
Economic Driver's of New Orleans' Commercial Real Estate Industry
Major Industries of the 10 Parish New Orleans Market
Sources: Louisiana Economic Development, Forbes, ABC, Economic Impact of Louisiana's Tax Credit Program,WWNO, Times-Picayune, Mayor's Office of Cultural Economy
You might think taking 2 years to lease vacant office space is an outlier, an anomaly, or that something's just wrong: like a building sitting on an earthquake fault; however, it's just par for course for downtown New Orleans' finest office towers where 78% of full floor offices have sat vacant for over one year, and 35% have sat for over 2 years, and 13% for over 4 years. And that's just vacant time to date.
Pie Chart-Time Vacant For Class A Office Full Floor Space
Size of the Market
Let's step back and get an idea of the office market in New Orleans. There are 22.2 million square feet of rentable office space in the New Orleans market, with 70% of office space in buildings under 50,000 square feet. Of this, 12 million square feet of office space is in the Central Business District and, of this, 8.8 million rentable square feet comprises the CBD Class A Office Tower market and 1.6 million rentable square feet is Class B office space. Of this, approximately 1 million square feet of Class A office space is for lease and, of this, approximately 50% is full floor space. Full floors, if leased to a single tenant, only interest companies with at least 50 employees, which are in smaller supply than those with 5 to 10 employees, resulting in a longer lead time to lease larger office spaces. However, prices have not responded to a lack of supply since ownership of New Orleans Class A off tower buildings is an oligopoly. CBD Class A base rents have averaged $18 per square foot the last few years, resulting in many spaces having gone unleased for several years. Our forecast is for this vacancy rate to remain the same until prices adjust.
Chart of Size Of The Office Market In New Orleans
Full Floor Office Space Is Half The Market
There are 12 Class A buildings in the New Orleans CBD with 24 Class A full floor spaces priced between $14.50 per square foot to $20.00 per square foot, and Class B/C office space available at $11 per square foot. Total full floor CBD office space is 537,486 square feet, and since our forecast is for only 100,000 square feet to be absorbed in 2015, it will take 5 years to lease the current supply. Owners of high vacancy office buildings will need to consider selling their property to redeploy assets to better performing categories, or reduce prices dramatically. The present value of $18 rent 5 years from now is $13.45 (assuming 6% opportunity cost), meaning that leasing space now at $13.45 PSF would be the same as receiving $18 PSF in 5 years.
Table Of Full Floor Class A Office Space In New Orleans CBD
Absorption of Class A CBD Office Space
2015: 1st Quarter: 25,431 SF
2014: 92,859 SF
2013: 133,554 SF
Big Guys Languish While Small Guys Thrive
Large full floor office spaces have languished on the market but the smaller size office spaces are in big demand because of the shift that began decades ago in our economy away from oil and gas to tourism. It all started when we hosted a party and ended up with the 5th largest building in America. The party was the 1984 World's Fair and the building was the convention center. Started by mayor Dutch Morial, the driver of the New Orleans economy has grown to 3,000,000 square feet since then.
But there are other economic drivers such as digital media and movie production which do not yet have as much of an impact but are growing much faster. One of the latest economic drivers is the influx of entrepreneurs, pulled to New Orleans for its culture and tax incentives for corporations to employ here. These are the tax incentives which were just capped last Thursday, in a bill sponsored by Rep. Joel Robideaux from Lafayette.
The influx of entrepreneurs is verified by research from The Data Center in their report, The New Orleans Index at Eight: Measuring Greater New Orleans’ Progress Toward Prosperity, which shows a dramatic increase in start-up businesses in the New Orleans area.
Chart Of New Business Start-Ups In New Orleans
Start-ups tend to require smaller office space and are hesitant to sign long term leases, leading to demand for executive suites which offer month-to-month leasing including secretarial support, conference rooms and locations in Class A office space. Our forecast is for smaller office spaces to see an increase in demand while larger office spaces languish, dragging down performance which causes office buildings to come on the market.
The Bottom Line
In summary, the large Class A office spaces are sitting on the market and will continue to sit until prices adjust, but the smaller office spaces are filling the void in demand for new business start-ups. Where one door closes, another one opens.
For more information on tax credits encouraging growth, click on our article:
Sources: LoopNet. LACDB, Emporis databases. GNO, Inc, The Data Center.
It is a 100 year old well known historic-looking warehouse, steeped in the history of New Orleans as a port city, and the owners have recently hired Louisiana Commercial Realty to market nationwide the 39,042 square foot brick building for lease. The building has been family owned for almost half a century, and recently two family members bought out the remaining family, made improvements and began leasing the building themselves to a movie studio and a metals company for storage.
The owners are bringing in commercial real estate leasing broker Robert Hand, managing director of Sperry Van Ness | Southeastern Commercial Realty, who says, "It is a terrific building in a great location. It has been well maintained and offers a raised concrete slab foundation, brick exterior, metal roof, 10 loading docks and a clear span interior with skylights for great lighting. It has a great location: just one half mile from I-10 at the First Street Wharf entrance."
The building is for lease at $4.25 per square foot, net of expenses such as taxes and insurance which are estimated at 90 cents per square foot, and is located on Tchoupitoulas and Market Street, opposite the Market Street Power Plant which is expected to be redeveloped as a mixed use retail and hotel center.
Tchoupitoulas Street is also a major trucking throughway that serves the Port of New Orleans, which has the world’s longest wharf: a 2 mile conglomerate of 16 wharves, accommodating 15 vessels at one time. The Port is the only deep-water port in the United States connecting to six major railroads, making it a cost-effective destination for shipping. The nearby First Street Wharf has a 1,275 foot berth primarily handling breakbulk cargo and is operated by Empire Stevedoring.
Since the area is zoned mixed use, MU-A, a wide variety of businesses are able to utilize the space, including:
Light Manufacturing
Boat Sales & Service
Motion Picture Studio
Research Center
Furniture Manufacturing
Warehousing
Iron Fabrication
Printing & Publishing
Sign Fabrication
Retail
Wholesale Distributing
Industrial Vocational School
Storage of Building Materials
Sheet Metal Products
Brewery & Micro-Distillery
The most popular method of appraising commercial real estate is not the most accurate. Usually we compare past sales of property and apply the price per square foot, but this is valid only if all the properties are homogeneous, which is never the situation. Let's examine three methods of valuing commercial real estate.
Sales Approach
The most common method of valuing commercial property is the least accurate, because it only works if all properties have the same characteristics. Called the Sales Approach, it requires gathering the sales price of nearby comparable property, then making adjustments for different traits. This leads to inaccuracy, since the unique quality of real estate is that location can contribute greatly to how a property is used which determines what its value might be, and no two properties can occupy the same location. Other characteristics such as floor plan, parking, zoning, ingress and egress can also contribute greatly to value.
Cost Approach
Sometimes, owners value real estate based on what they paid for it, or what someone last offered for the property, or the cost to build the property new. In reality, the cost of property has little to do with market value, and an offer made by one buyer does not mean a different buyer would value the property at the same price. The market value is the price a property would bring in an open and competitive market, with a willing buyer and seller knowledgeable about the facts. The cost approach works when you have the time, financing and a reliable contractor to build an alternative structure.
Income Approach
Whether you own stocks or bonds or real estate, the best method of valuing an asset is the present value of all future cash flows. The underlying principal is that a dollar one year from now is worth less than one dollar today, because you could invest that dollar today at some interest rate which will grow in one year to a value of more than one dollar. Here is the math:
DPV=FV / (1+i)n where
DPV is the discounted present value of the future cash flow (FV),
FV is the nominal value of a cash flow amount in a future period;
i is the interest rate, which reflects the cost of tying up capital
n is the time in years before the future cash flow occurs.
Let’s put this information to work and say a property delivers $10,000 annually in Cash Flow After Taxes. The current value is the sum of future cash flows. You calculate each year’s cash flow, discounted back at an interest rate you could earn on other investments. Let’s assume 7 years at a 5% interest rate and change the n value to match the number of years in the future.
In summary, $57,861 today is the same as $10,000 for 7 years, assuming 5% interest rates. Therefore, if a property had a 7 year lease that produced income of $10,000 annually, the current value of that lease income alone would have a value of $57,861. If an investor required a 10% rate of return, he or she would be willing to pay $578,610 for the property, just to get the lease income.
Not all income is the same however. Let's examine how to determine cash flow income.
Determining Cash Flow
With commercial real estate, the best measure of income is called Cash Flow After Tax, and here is how it is derived.
Potential Rental Income
- Vacancy and Credit Losses
- Operating Expenses
- Annual Debt Service
- Tax Liability
= Cash Flow After Taxes
Determining Operating Expenses
Operating Expenses do not include:
Interest
Depreciation
Capital Expenses
Personal Income Taxes
Reserves for Repairs and Maintenance
Tenant Improvements
Real Estate Commissions
Operating Expenses do include:
Property Taxes
Insurance
Management Expenses
Repairs
Utilities
Source: CCIM Financial Analysis, "The Appraisal of Real Estate", 14th edition, Mark Rattermann, MAI, SRA.
Determining accurate prices for commercial real estate can be elusive. It's not what economist call a highly competitive market such as buying a stock or a bond where the bid (highest price for buyer) and ask (lowest price for seller) is actively visible for all to see. Market prices for commercial real estate can be vastly different from appraisal valuations and can vary widely by property type, location and tenant. The unpredictability of determining a price means that the person with the most knowledge makes the best decision and capitalizes on the opportunity that others may not recognize. This article researches the commercial property markets in Louisiana and Mississippi to provide the knowledge with which you can make better commercial real estate decisions.
The Louisiana Commercial Real Estate Market
For $4.2 billion, you can buy all the listed commercial property in Louisiana. There are 26.9 million square feet for sale and 24.2 million for lease.
Average Time To Sell Or Lease Property
There are 8 sectors of commercial property, shown below. The time it takes to sell or lease most of these 8 types of property is longer than the gestation period of most animals, ranging from 144 to 596 days. Only Apartments and Retail property can be leased or sold faster than it takes to give birth to a human.
Days It Takes To Sell Or Lease Commercial Property, By Type
Industrial-460 days
Office-293 days
Retail-266 days
Shopping Centers-596 days
Vacant land-439 days
Farm & Ranch-not enough data points
Hospitality-Hotels-not enough data points
Multi-Family-Apartments-144 days
Average prices for space for lease and for sale are listed in the table below. The tightest sector is recognized by how close to the list price the transaction takes place. With 700 transactions, Shopping Centers rank the highest demand, having an average transaction at only 6.9% below their list price, followed by 2,493 transactions in the Office sector averaging only 10% below list, land at 15%, Industrial at 16% and in last place is the Retail market that averages a transaction 20% below list.
How Does Louisiana Compare To Mississippi
Louisiana is 4 times the Mississippi market size in property for sale, and 9 times the size in property for lease.
Lease and Sale Prices in Louisiana Compared To Mississippi
The average lease rate in Louisiana is only 10 to 20 percent higher than in Mississippi, but the average sale price in every significant sector is 30 to 100 percent higher. This is due to the more vibrant economy and demographics which drive commercial property to produce more income and therefore hold more value. For example, Industrial sale prices average $34 per square foot in Louisiana compared to $15 PSF in Mississippi, and Office property averages $80 PSF compared to $63 PSF, Retail averages $94 PSF compared to only $48 PSF, and Shopping Centers average $88 PSF compared to $43 PSF.
New Orleans Compared To Baton Rouge
We examine a city's MSA, which is the Metropolitan Statistical Area, designated by the Census Bureau and defined by the Office of Management and Budget as an area with a high degree of social and economic integration . New Orleans MSA is the larger market measured by square feet for sale, with 8.4 million vs. 5.7 million in Baton Rouge, but Baton Rouge is the larger market by total sale price with $1.3 billion vs. $1.1 billion.
New Orleans and Baton Rouge Have Similar Prices In Some Sectors
New Orleans has more properties on the market than Baton Rouge in every significant sector. Office and Industrial sector lease and sale prices are very close in both cities, but 371 transactions in Retail averaged a 46 percent higher price in Baton Rouge while 261 Shopping Center transactions occurred at an average 25 percent lower. Since there were hundreds of transactions, the price data cannot be skewed by outliers.
What About Gulfport-Biloxi-Pascagoula
Who would have thought Gulfport even had an MSA. The market is about 13 percent of the size of New Orleans, as measured by square footage for sale and 6 percent of the market size as measured by lease space. Prices per square foot are within 10 percent of the New Orleans market for the Industrial, Office and Retail sectors, but average 57 percent of the Shopping Center lease price. Sale prices are 20 percent higher for Industrial due to a shortage in supply, but Retail and Office sale prices average 10 to 20 percent lower.
Summary
Now that we have the average sale and lease prices of the various sectors in major markets in both Louisiana and Mississippi, where is the opportunity? If you own properties in several cities, it is called arbitrage, but the average person must look for areas and sectors where prices are simply out of sync.
You might think Shopping Centers in Baton Rouge are a steal at a sale price 26 percent less than in New Orleans, but lease rates are 26 percent less also. That's no coincidence. Office property in Baton Rouge is a bargain compared to New Orleans; even though lease rates are 3 percent less, sale prices are 14 percent less. The real bargain is Retail in New Orleans which has 12 percent higher lease rates than Baton Rouge but sale prices averaging 32 percent less.
For more information on prices on commercial real estate, click on these articles:
Office Space Prices In New Orleans
How To Value Commercial Real Estate
Sources: Census Bureau, Department of Labor & Statistics, LACDB, LoopNet
In this article we examine current market prices for every type commercial real estate in Louisiana.
Louisiana Largest Sector On The Market For An Astounding 460 Days
In Louisiana, there is 26.9 million square feet of commercial space for sale and 24.2 million square feet for lease, which can be broken down into these major categories:
INDUSTRIAL: The Industrial sector has 926 properties totaling 21.1 million square feet and an average asking sale price of $34 per square foot and average lease rate of $4.77 per square foot. The average property is on the market an astounding 460 days.
OFFICE: The Office sector has a population of 2,493 properties with and average sale price of $80 per square foot and average lease price of $15 per square foot and on the market an average of 293 days.
RETAIL: Comprises 1,476 properties averaging $94 PSF in sale price and $12.76 PSF for lease with 266 days on the market.
SHOPPING CENTER: Classified by most as part of the Retail sector, but separated out here as 700 properties averaging a sale price of $88 PSF and lease price of $15.87 PSF with 596 days on the market.
LAND: The largest sector with 1.7 billion square feet and 2,570 properties averaging a sale price of $1.43 PSF and lease price of $1.65 PSF. Seems like its a no-brainer to buy the land at $1.43 PSF and lease it out at $1.65 PSF but it takes so long to transact a deal that the Average Days On The Market does not even show in records. It can take decades to lease or sell land.
MULTI-FAMILY: 102 properties averaging a sale price of $38 PSF , although most are sold based on Net Operating Income or Price Per Unit. Multi-Family is the category in the highest demand, as witnessed by the lowest days on the market at 144. Since the recession in 2008 and the housing market collapse, it has required a higher deposit to purchase a home, causing an increase in renting, resulting in a higher demand for apartments, which leads to higher occupancy rates, which results in large institutions changing their asset allocation away from shopping center investment to apartments, which causes a shift in demand leading to higher prices for apartments and lower Capitalization Rates. Whoo! Yes, it is a Domino Effect, and the trend will continue.
TABLE OF PRICES AND DATA FOR COMMERCIAL PROPERTY SECTORS IN LOUISIANA
Industrial Market In Detail
Let's carve out one of the sectors comprising all Louisiana commercial real estate and break it down. The Industrial market is comprised of 926 properties with 570 for lease and 356 for sale. There is 10 million square feet for lease and about the same for sale. On average the last two years, 29 properties have been leased at an average of $3.68 per square foot and 10 properties have sold at an average of $46 per square foot. This is an average of all the industrial properties in Louisiana, and certain areas may be stronger or weaker.
INDUSTRIAL SECTOR DATA
Industrial Market Price Volatility
Just like the analyst on Bloomberg and CNN who prognosticate with 100% accuracy that the markets will be volatile and fluctuate, providing no more insight than a zoo animal throwing a dart, the chart below shows that over the last 2 years the price of leasing Industrial space on average in Louisiana has gone up and down but not gone anywhere at about $4 per square foot. The average days on the market ended up where they began at around 300.
CHART OF DAYS ON THE MARKET AND LEASE RATE FOR INDUSTRIAL PROPERTY IN LOUISIANA
Tune in next week for a detailed look at prices of other sectors of commercial real estate in Louisiana.
For more information on prices on commercial real estate, click on these articles:
Office Space Prices In New Orleans
5 Things You Need To Know About Pricing Multi-Family
A vacant hotel property that is among the largest pieces of available real estate along Tulane Avenue recently changed hands after more than three years on the market.
The Americas Best Value Inn, 2820 Tulane Ave., sold on March 25 for $1.06 million, according to Orleans Parish conveyance records. The 16,000-square-foot hotel, which is spread across three separate buildings, sits on a more than 30,000-square-foot tract of land near the Orleans Parish Criminal District Courthouse.
Conveyance documents show the property, which had also gone by the name Patio Motel, sold to an entity known as 2820 Tulane LLC. Records from the Secretary of State list New Orleans residents Bahram Khoobehi and Hossain and Mahmood Mogharehabed as members. The new owners could not be reached for comment.
Commercial broker Robert Hand, president of Louisiana Commercial Realty, said the property has been vacant since 2011 when a fire in one of the rooms caused severe damage to the roof and most of the second and third floors. The property was put on the market in “as-is” condition and listed at land value.
According to Hand, buyers came forward twice in 2011, but neither could arrange financing. The property sold in 2012 for $650,000 to a local hotel owner who intended to restore it as a hotel, but the project became too expensive. Prior to this most recent deal, Hand said a verbal offer came in 2014 from a local construction company, but a deal couldn’t be reached.
“It was rather surprising that it took this long to close a promising deal,” Hand said. “Tulane Avenue is among the most anticipated areas in New Orleans for new developments and we had a number of written offers, but none materialized.”
“Negotiations with this most recent buyer began in February,” Hand said. “The plan is to include retail on the ground floor, which is required by zoning, and office space on the upper levels.”
The hotel’s seller is listed as WHCTC II, LLC, which lists New Orleans resident Wen Chuan Chen as a member.
According to assessor’s records, Khoobehi owns several residential properties along Broadway Street uptown.
The common belief that homes prices rise during the summer months because everyone wants to be settled in before school starts is true. The facts show us that the highest prices concentrate around the month of June.
Examining The Trend of 10,323 Homes Sold Over The Last 5 Years
Using the Multi List Service from the Realtor database, home sale prices can be sorted by month, as shown in the table below in a sample of 10,326 single family detached home sales. The highest price month is highlighted yellow, and the second highest price month is highlighted blue. The results show in all but one month since 2010, the highest average price for homes sold occurred in June, and in the second highest price in 3 of the last 5 years occurred in the month of July.
Average Sale Price By Month For Single Family Homes The Last 6 Months
Chart Home Sales By Month
The concentration of homes sold in June can easily be seen in the chart below because almost every year it is the month where prices reach their highest level.
Source: GSREIN MLS database, Stats customized by average sale price and exported.
Note: Average sale prices were used. Results differ if median sale prices are used.
For prices on commercial real estate, click here for charts of current list and lease prices on Industrial, Retail, Office & Retail sectors.


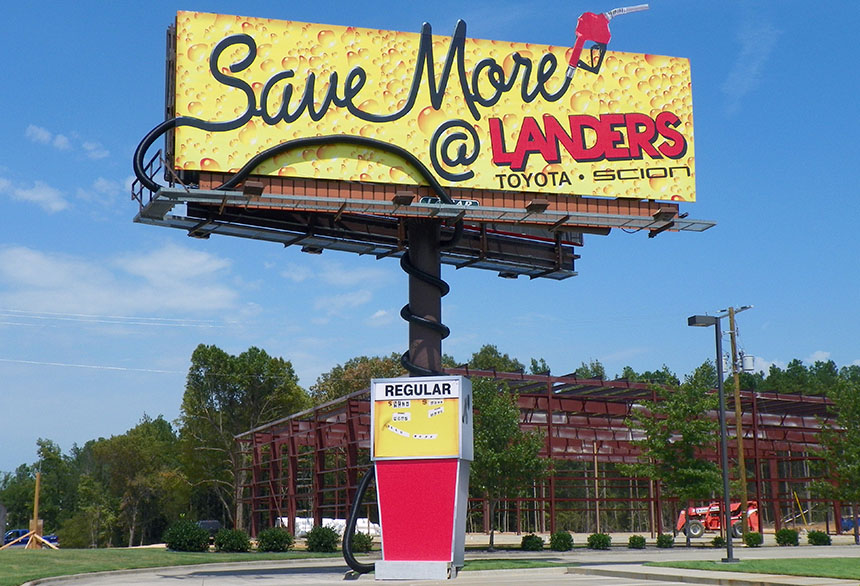


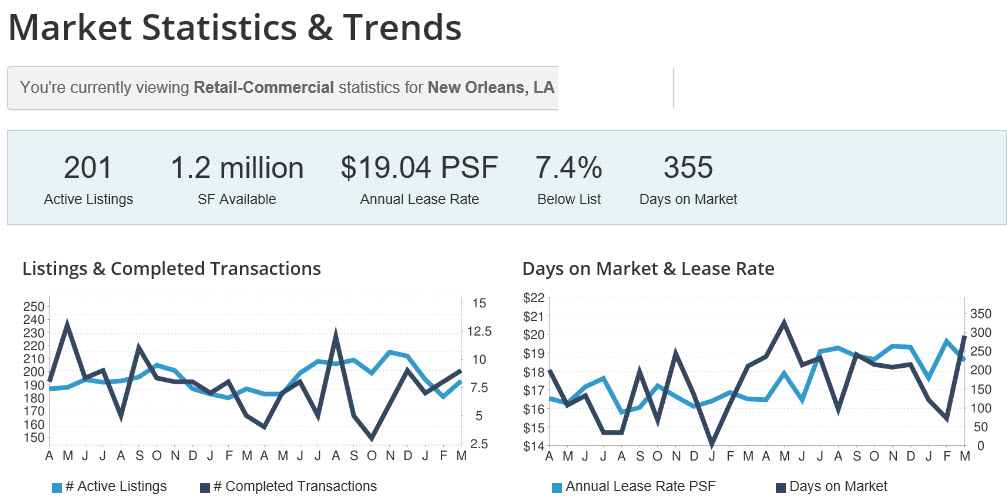


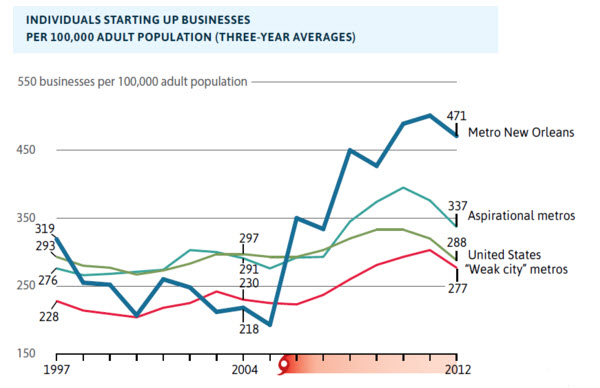
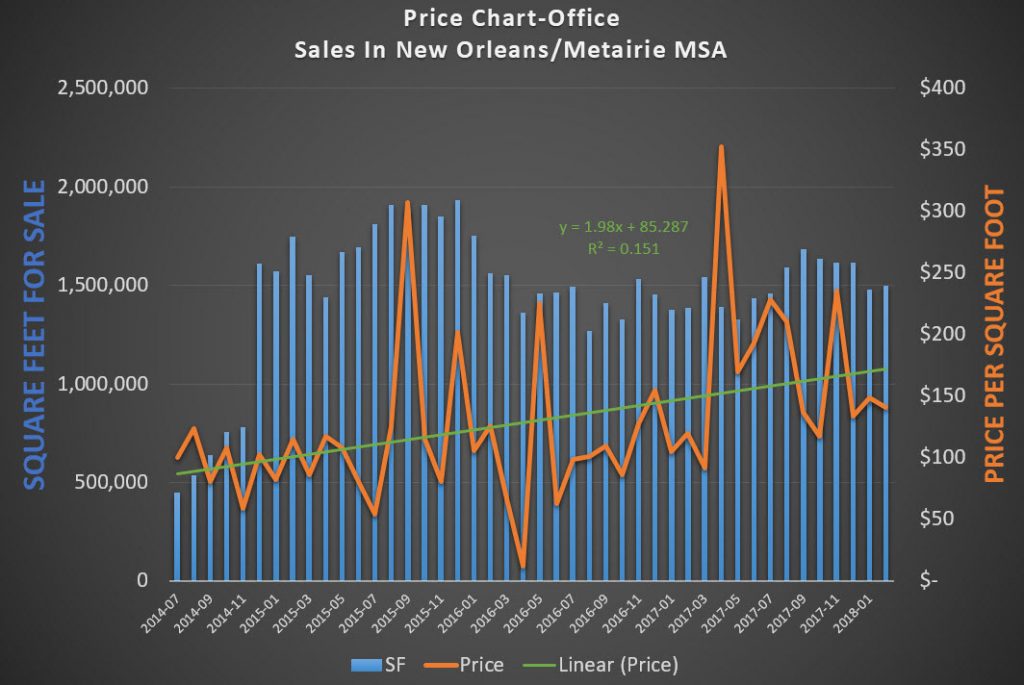
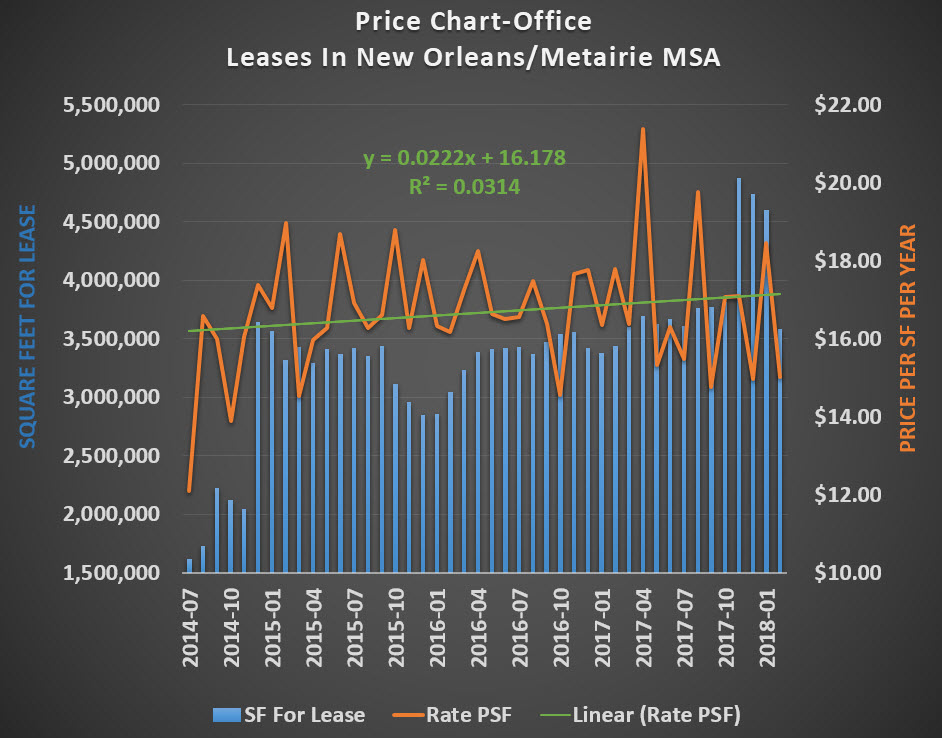

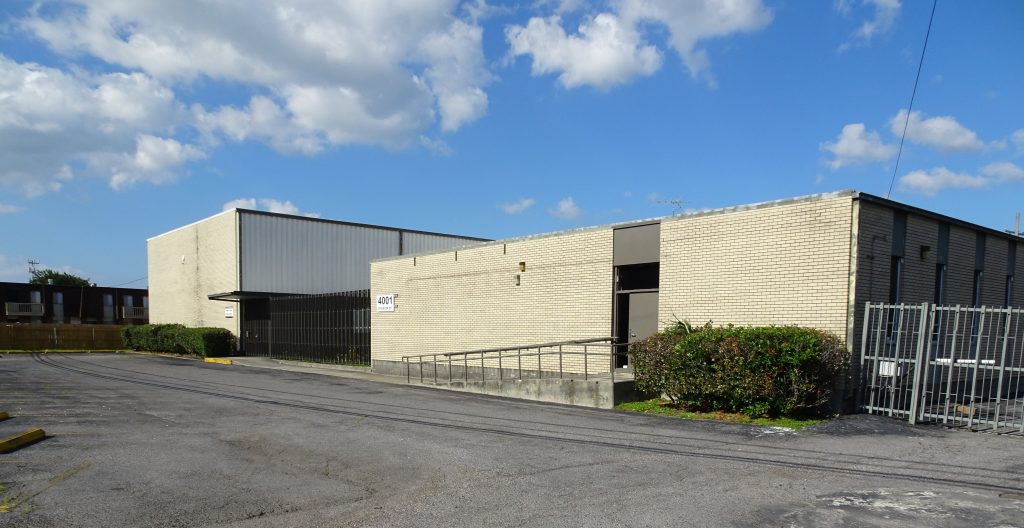 "Third time's the charm" is the saying, used usually after the first two failures, but Louisiana Commercial Realty has been successful three times in a row at helping engineering companies find the perfect home for their growing company.
 Recently Louisiana Commercial Realty teamed with Orleans Parish Assistant District attorney Michael Danon to get one more criminal off the streets of New Orleans. The crime occurred in 2014, and it took 3 years to get the criminal arrested and to court which culminated this month in a trial before Judge Camille Buras in Orleans Parish Criminal Court where criminal Christopher Karl Stephan pleaded guilty to felony theft and fraud, waiving his right to a trial and agreeing to be classified as a multiple offender. Under article 893, the criminal was sentenced to 2 years' suspended time and 2 years' probation but must register with the Department of Corrections. The defendant's attorney, Thomas Myers, also delivered a money order for compensation to the victim.
 Louisiana Commercial Realty and its sister company Mississippi Commercial Realty recently talked with the University of Southern Mississippi to explore helping new medical
 Civil District Court Judge Bruno listened to both attorneys then made some notes and concluded "I find Louisiana Commercial Realty testimony credible and find the defendant, James Ramsey, tried to conceal the sale of property from the listing agent." The controversy occurred after seller Ramsey hired the listing agent but then secretly sold the 10 acre property on Read Road without disclosing it to the listing broker they hired.


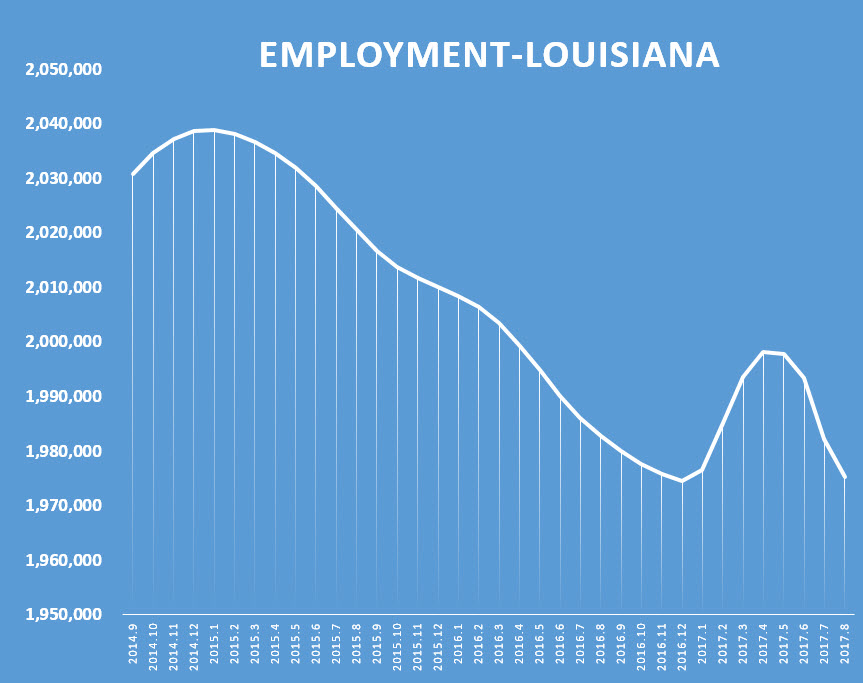
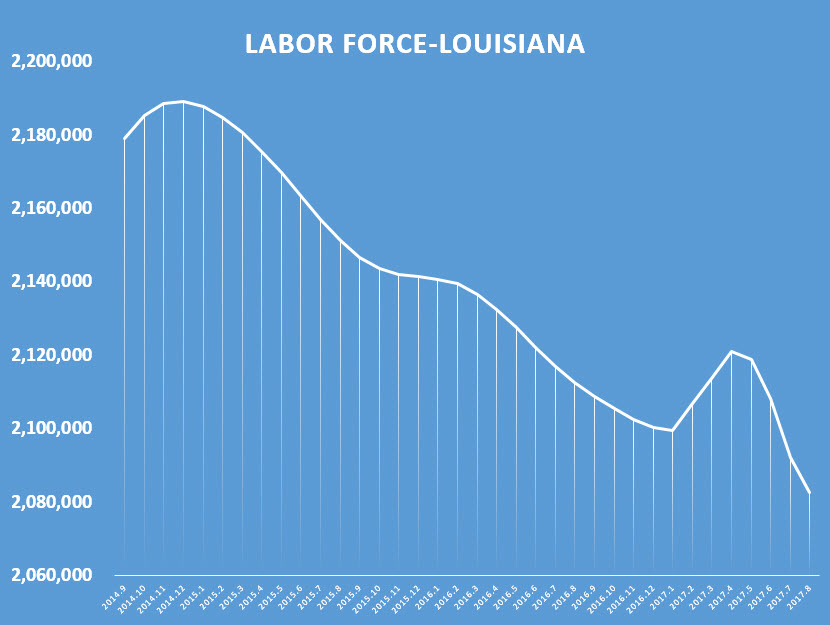
 The state of Georgia is one of the most efficient managers of its 2,000 office leases, with only a staff of 10 people each managing a portfolio up to 300 properties including renewals and expansions, plus new lease transactions.
 Today, Louisiana Commercial Realty met with the State Properties Commission to discuss challenges and solutions to managing the multitude of lease contracts with such a small staff. Since the Properties Commission has most of the government agencies as clients, there are always state budget restrictions that sometimes conflict with the needs of the client so a strict process and procedure is followed which is not usually found with non-government office tenants. There are similarities however, such as competing stakeholders with different objectives, which often leads to conflict.
 Since each staffer manages up to approximately 300 leases, staying organized is a must. Hand shared technological strategies the staffers could use to stay organized, such as implementing a software system to track lease expiration and terms, recording discussions with vendors and clients, storing documents and each stakeholder's contact information. Staffers in the field can also use old school Microsoft Outlook to sync notes and appointments between iPhone and a laptop so being out of the office doesn't mean being out of touch.
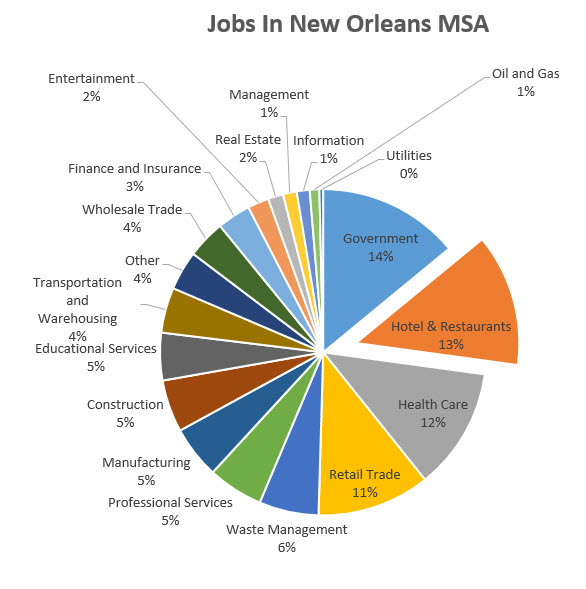
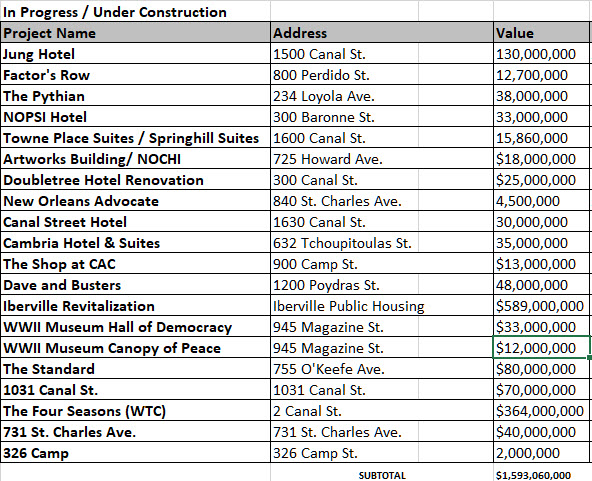
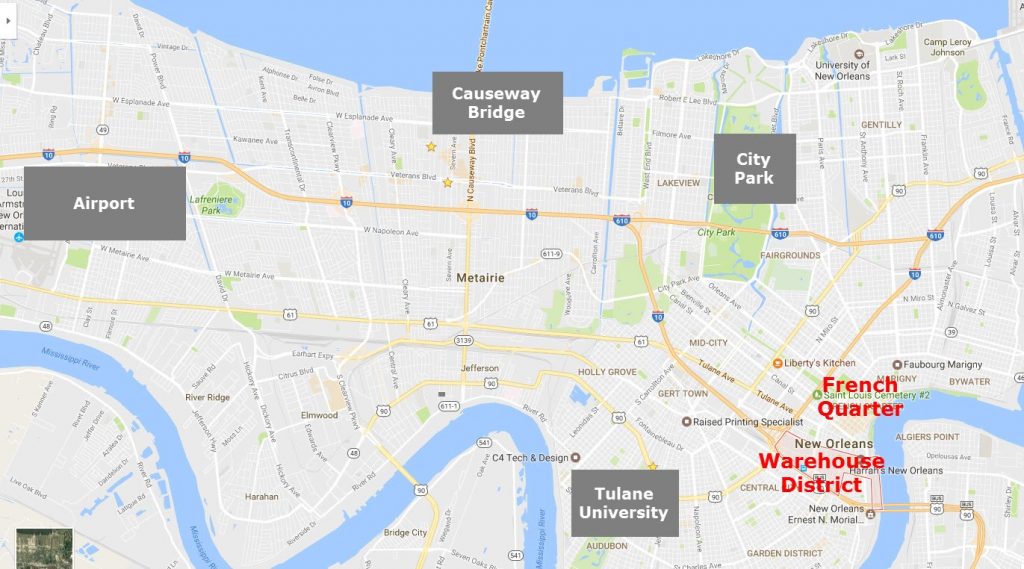
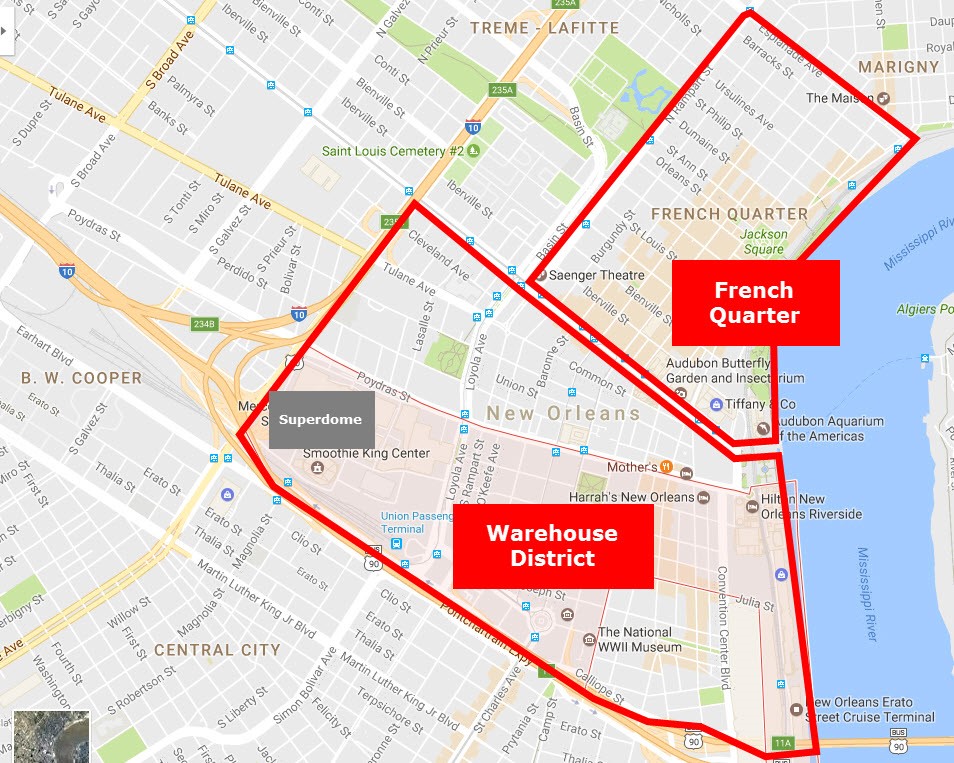
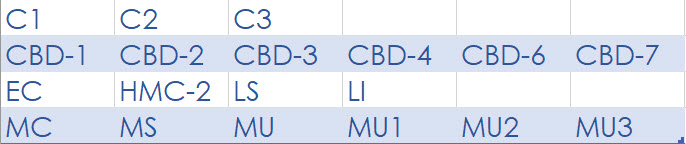


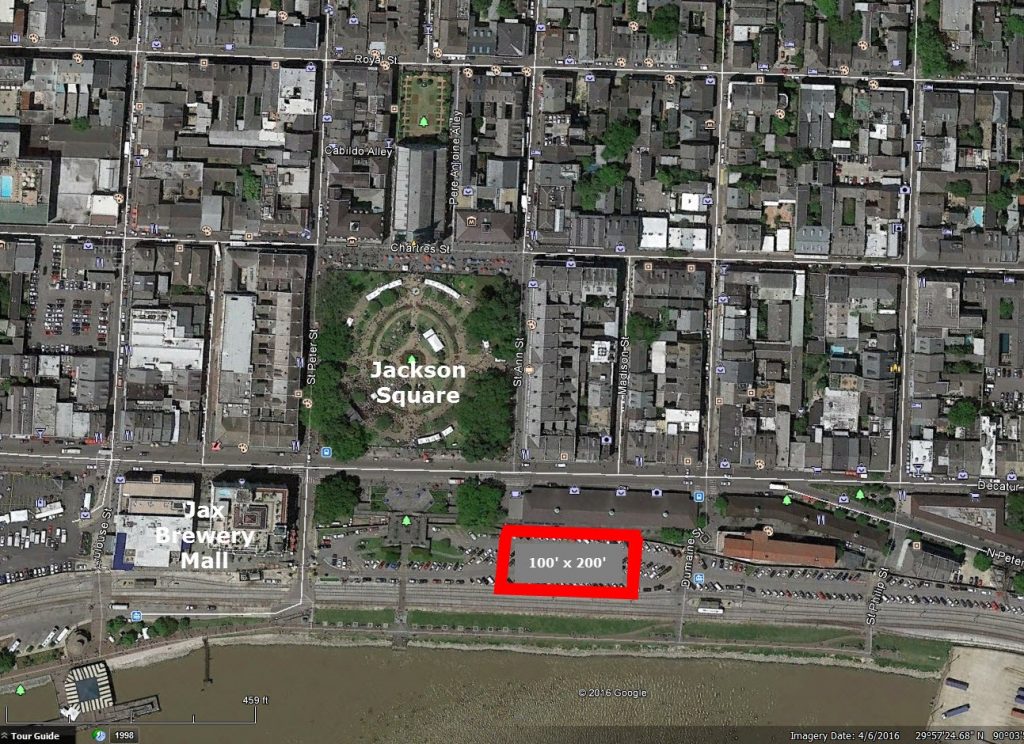
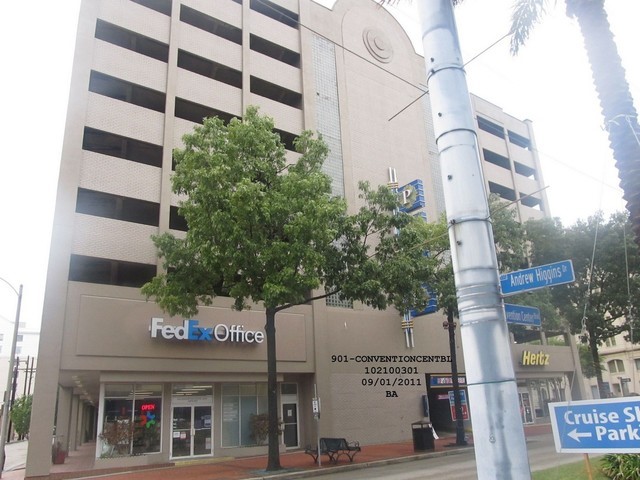

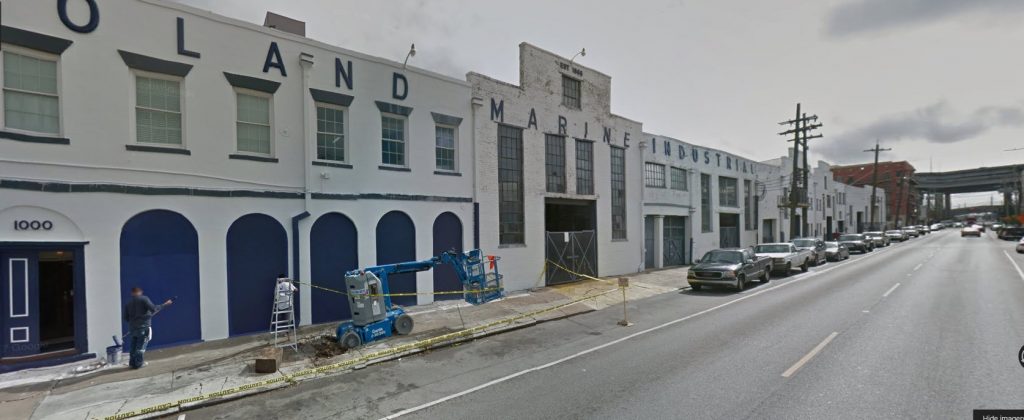
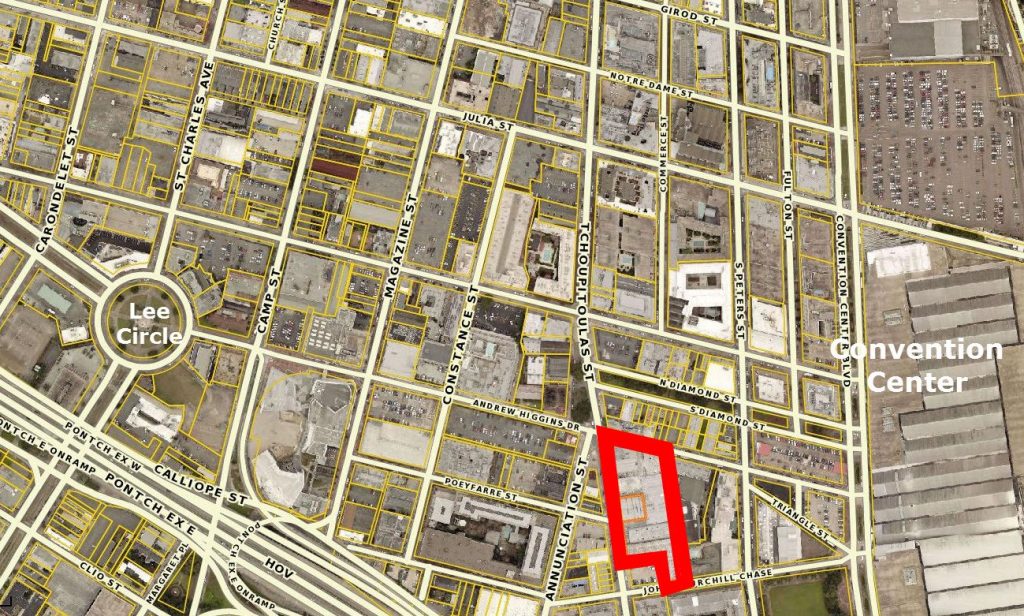


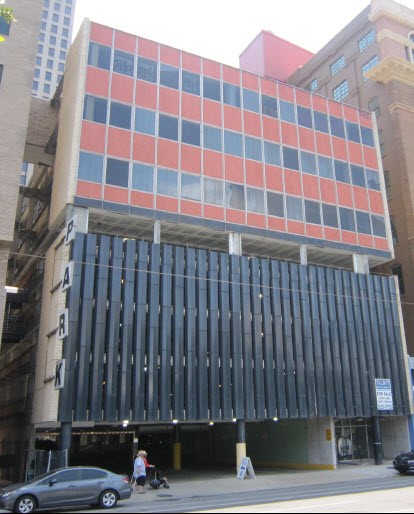
 Summary
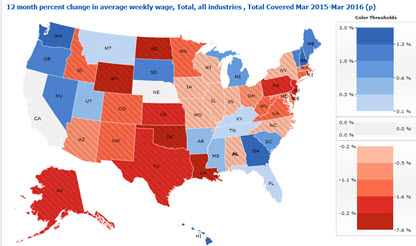 Whether you rent office space, a warehouse, or a retail store, your lease probably has language that ties rent you pay to the Consumer Price Index. The idea is meant to benefit only the landlord, because the rental income retains its purchasing power. The problem is that there is more than one Consumer Price Index and there are different ways to calculate each, so make sure your lease agreement contains language that is very specific. One example of lease language referencing the CPI is:
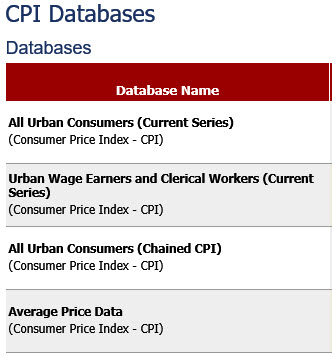
 Calculated for specific items such as, household fuel, motor fuel, and food items from prices collected for the Consumer Price Index (CPI).
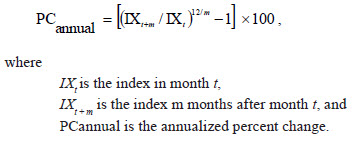
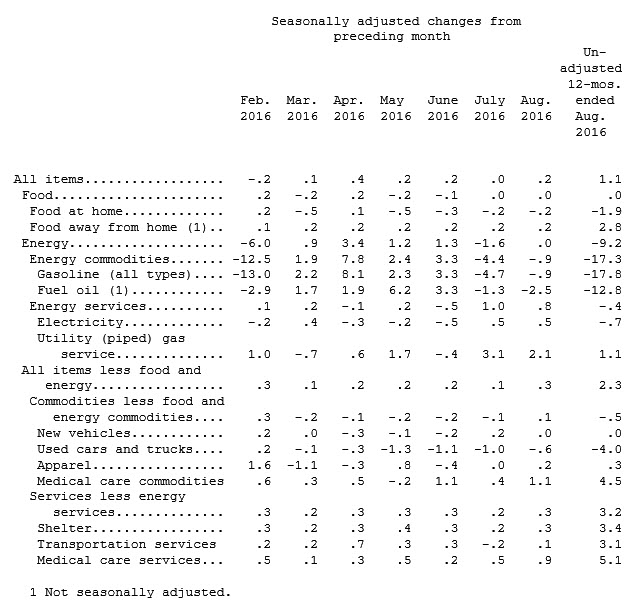
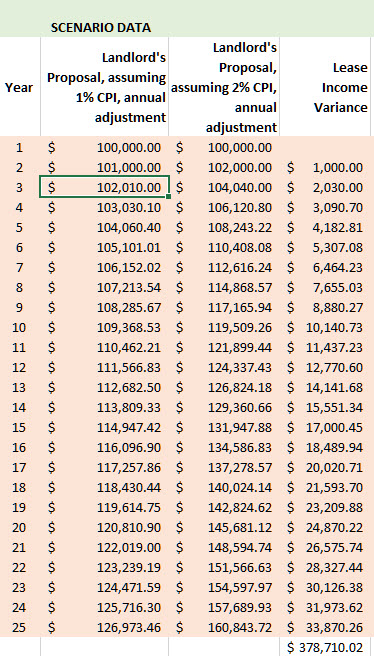

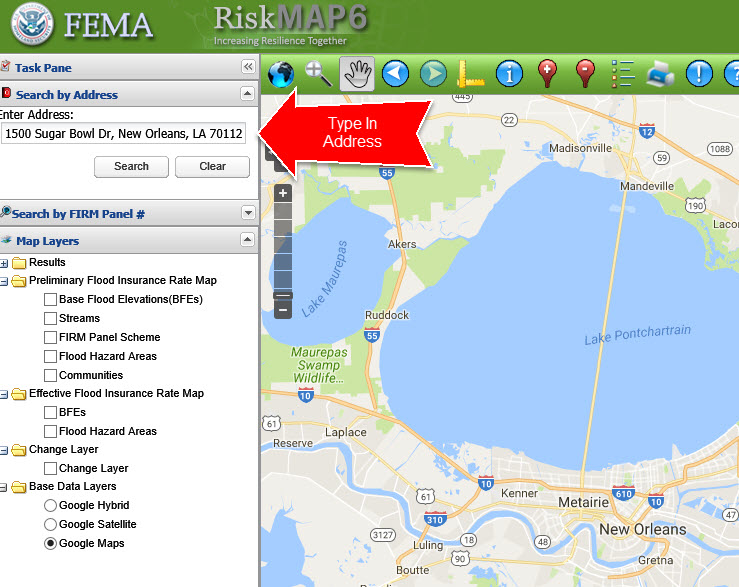

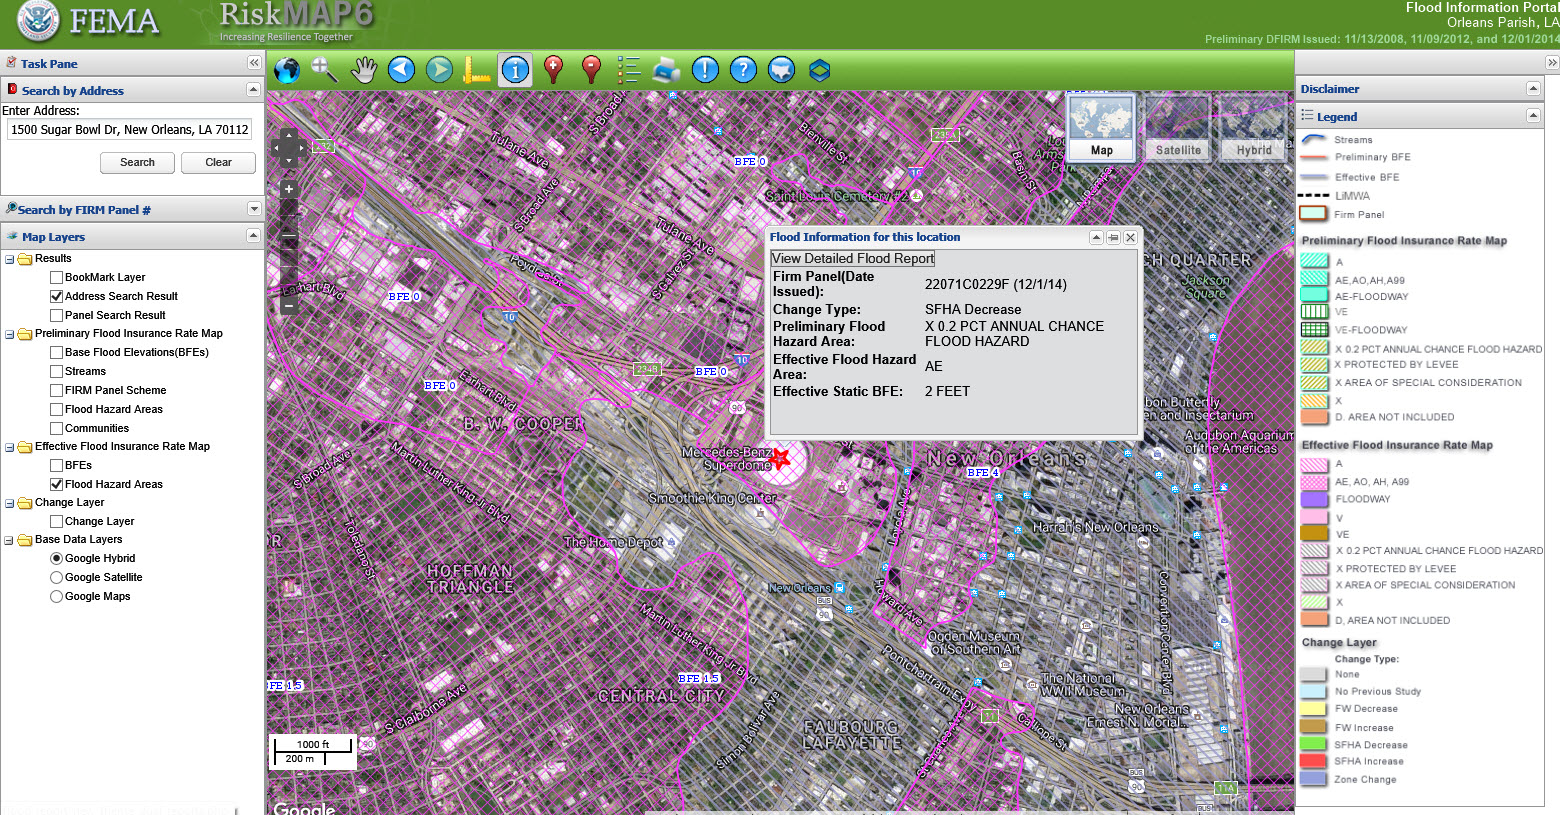


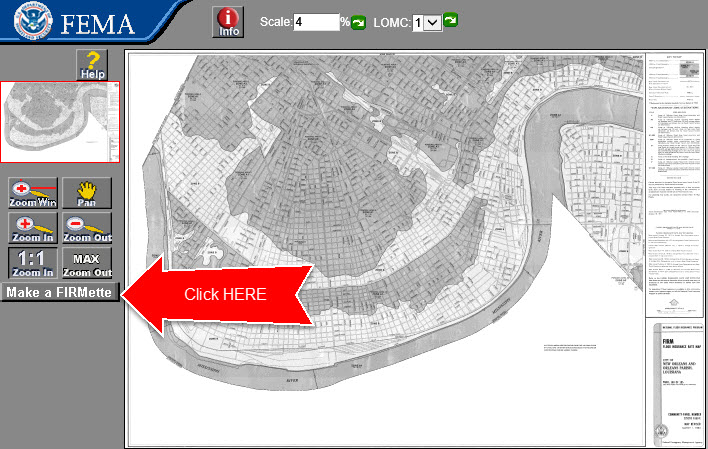
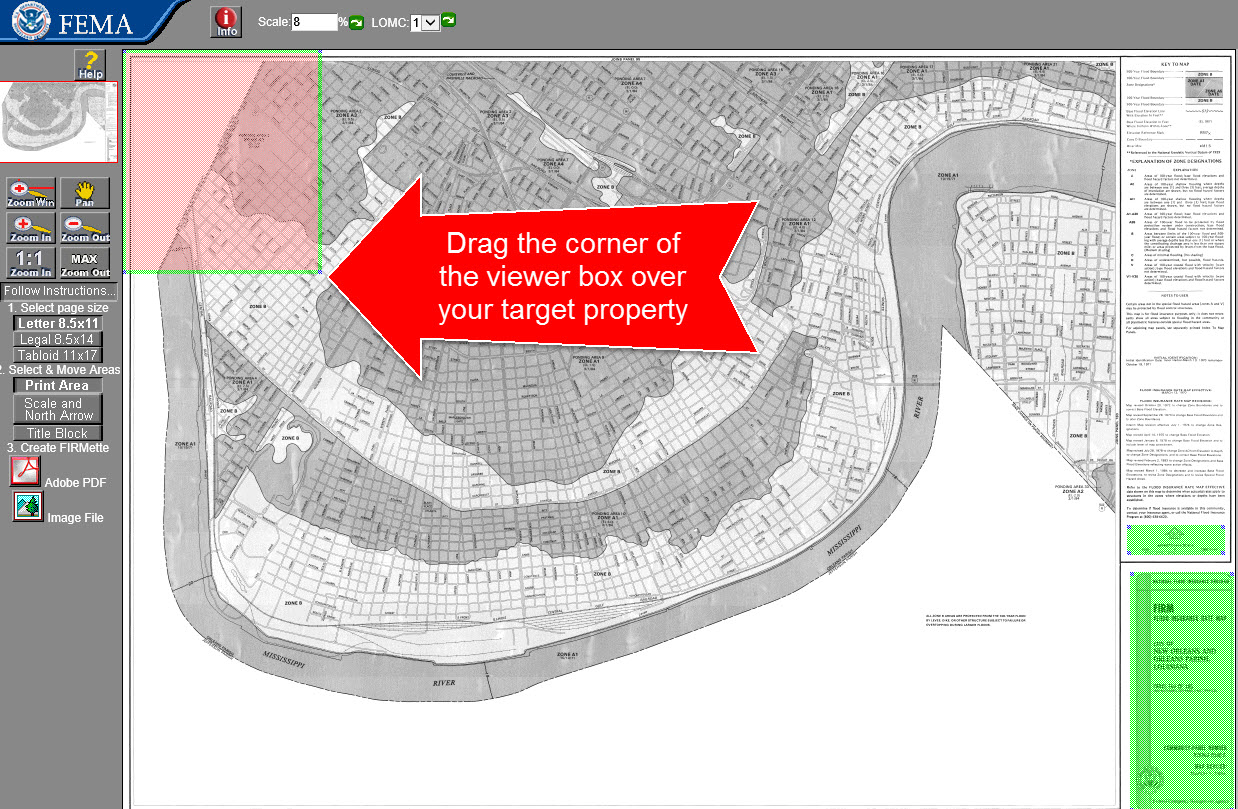
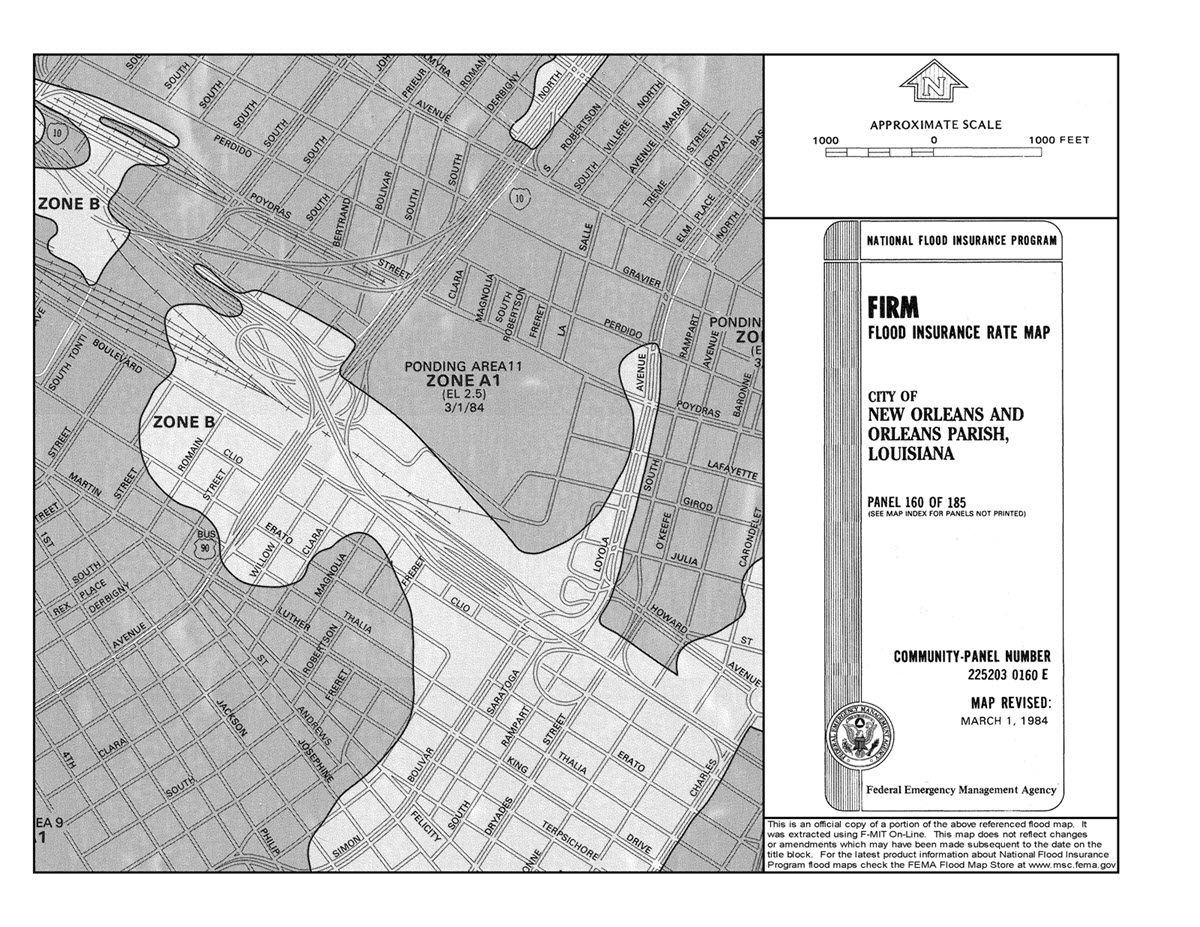
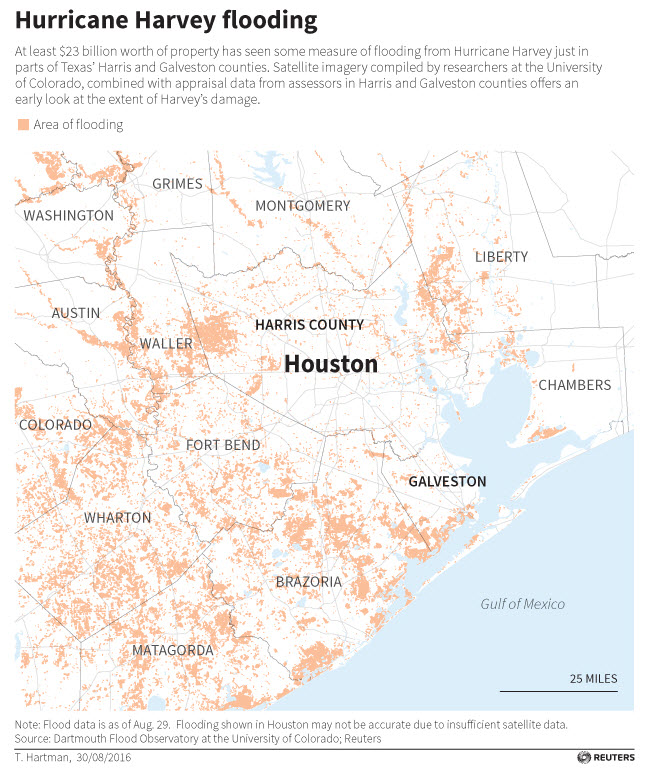

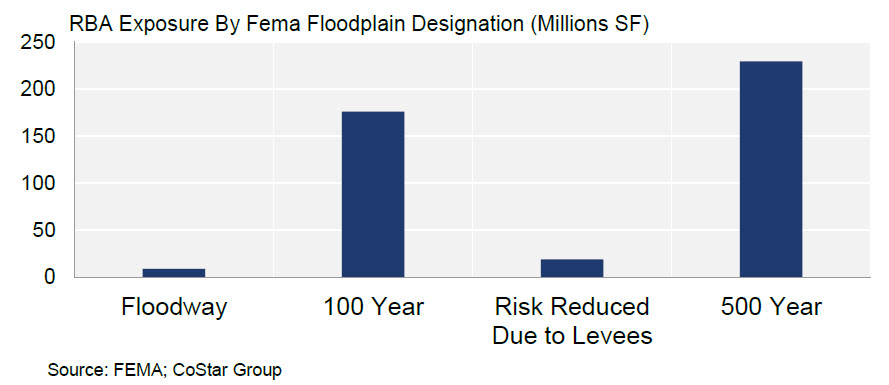
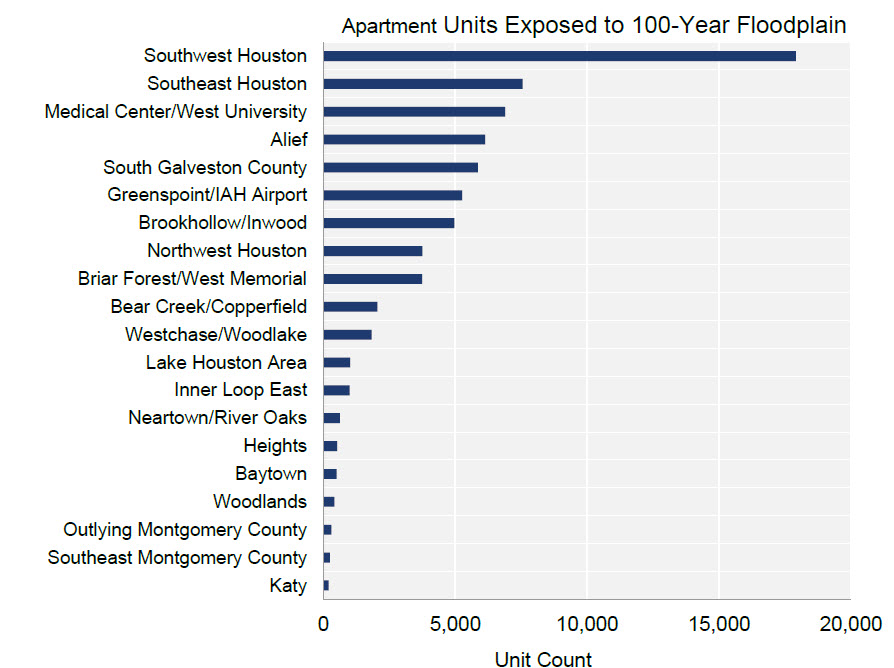


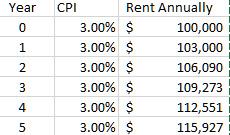
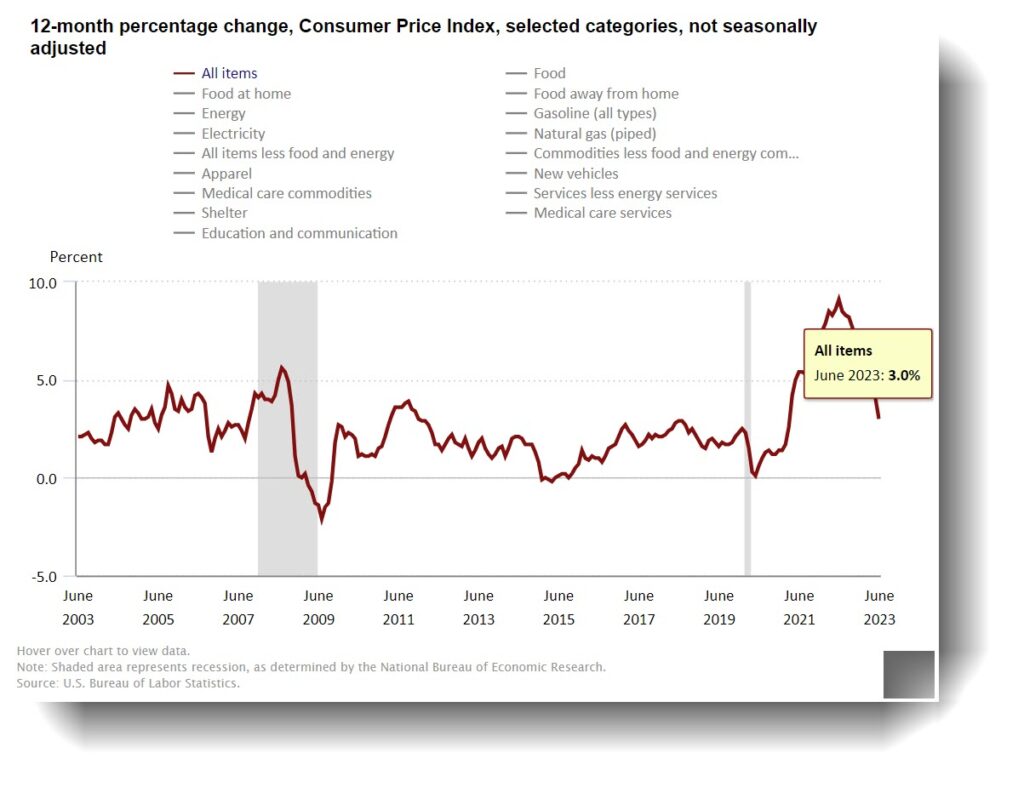
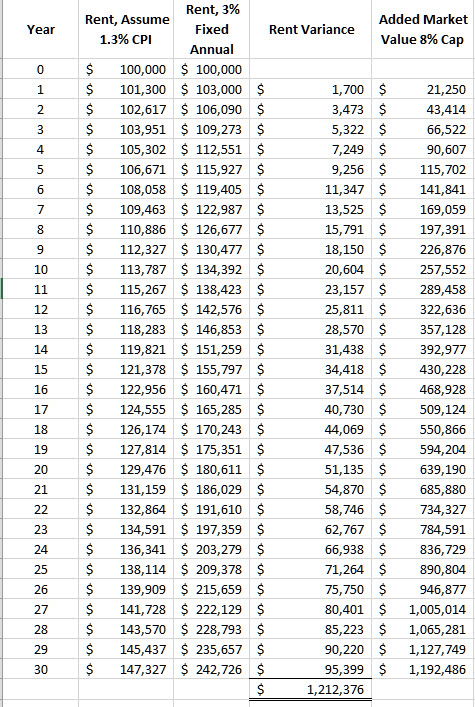
 Louisiana Commercial Realty and its sister company, Mississippi Commercial Realty, were hired recently to market the only Class A medical office center in Hattiesburg, Mississippi, known as One Lincoln Parkway Medical Center. The ADA compliant medical office building is 85,000 square feet on three floors and is home to the major health providers in the Hattiesburg area. The building was constructed in 2005 and offers wrap-around parking for 200 cars, and portico access on all four sides for easy access by patients. Current tenants include Forrest General Hospital and Hattiesburg Clinic, the two major health care providers in the 14 county market surrounding Hattiesburg.
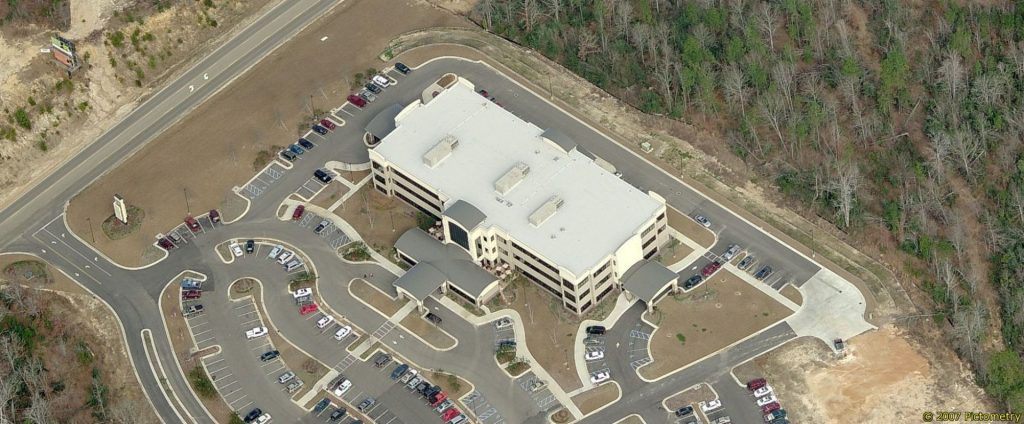
 Sometimes we forget that behind the everyday tasks of waking up, getting dressed, eating breakfast, and just getting to school or work are people making alarm clocks, clothes, frozen waffles and driving buses to help us along the way. In higher level economics courses, it is called the "
 New Orleans contracts out all the transportation work including streetcars, city buses and public school buses to outside vendors, who are mostly from out of state, so carpetbaggers are always asking where can I find a lot to park my buses. Not so fast. Any old vacant lot just won't do. Residential zoning won't work. What about commercial zoning? Nope. Of the 83 zoning districts in Orleans Parish, only 3 permit school bus parking: light or heavy industrial and marine industrial park. A conditional use is business industrial park, which requires city council approval and an application costing from $1,000 to $4,000, depending on the lot size. Classified as a Motor Vehicle Operational Facility, defined as a privately-owned facility for the dispatch, storage and maintenance of emergency medical care vehicles, taxicabs and other livery vehicles. A motor vehicle operations facility does not include facilities where the vehicles of the fire, police, or other municipal departments are dispatched, stored, and/or maintained, which are considered either public safety or public works facilities.
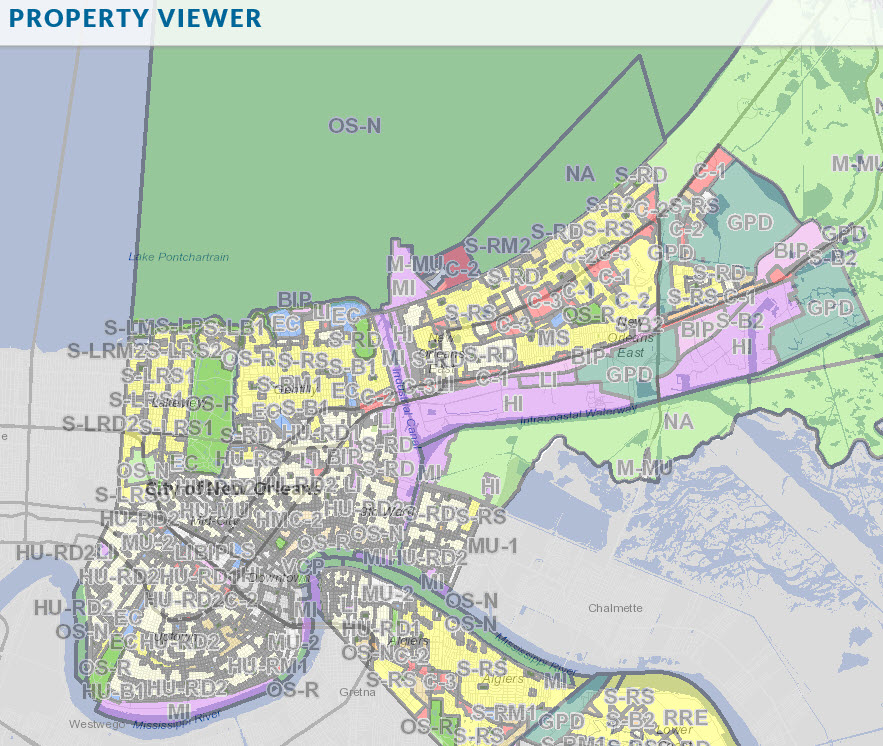
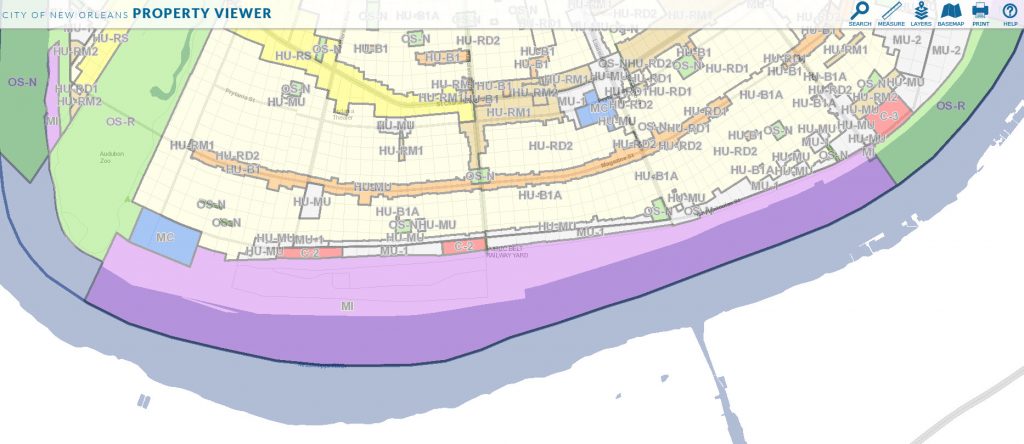
 The purple shaded areas along the Mississippi River are zoned marine industrial but are all Port of New Orleans property and used as wharves. The is a small area on Claiborne Avenue near the Jefferson Parish line zoned light industrial, near the Lowes and Crabby Patty's.
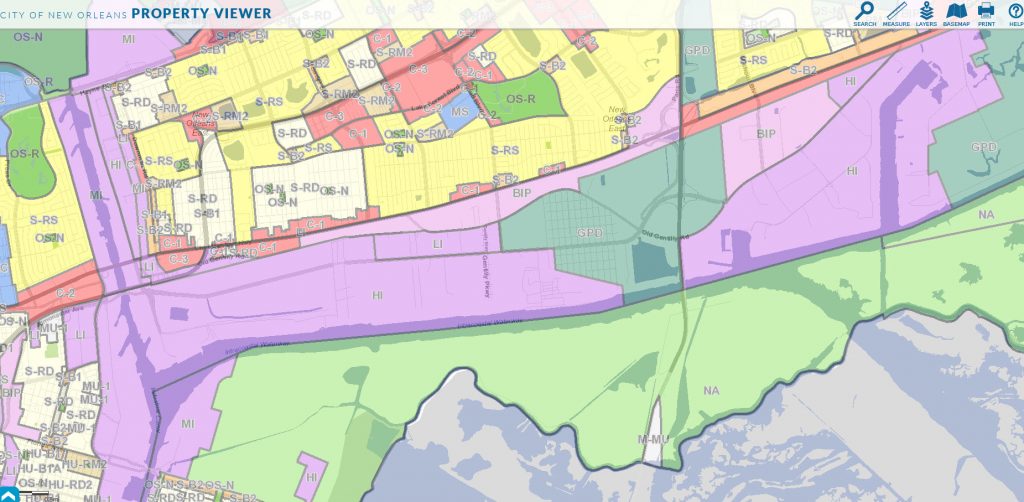
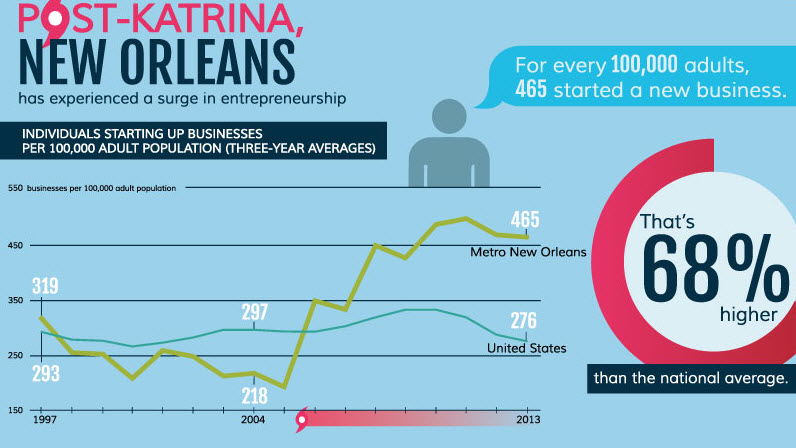
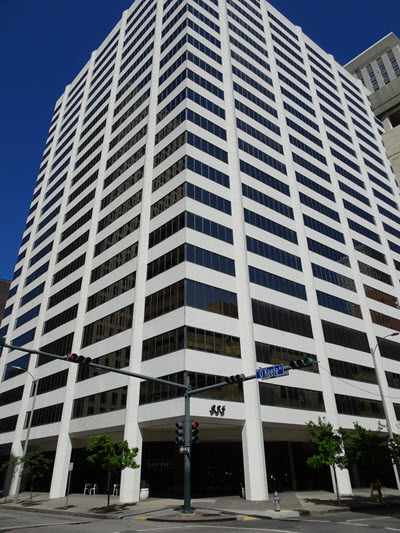

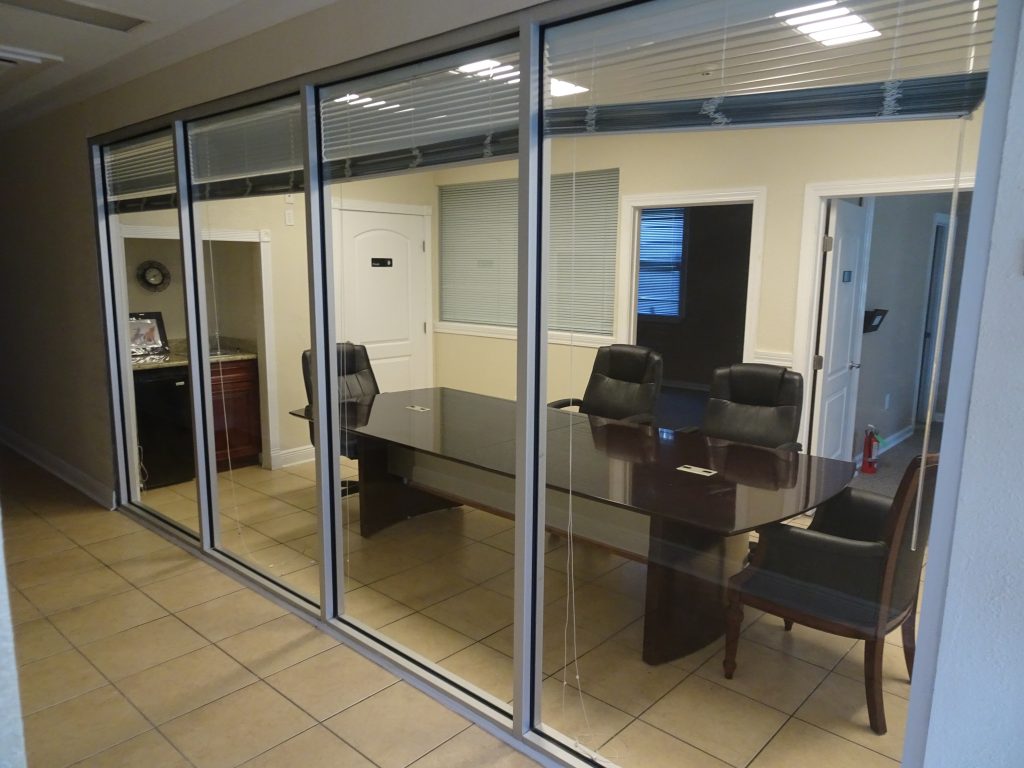
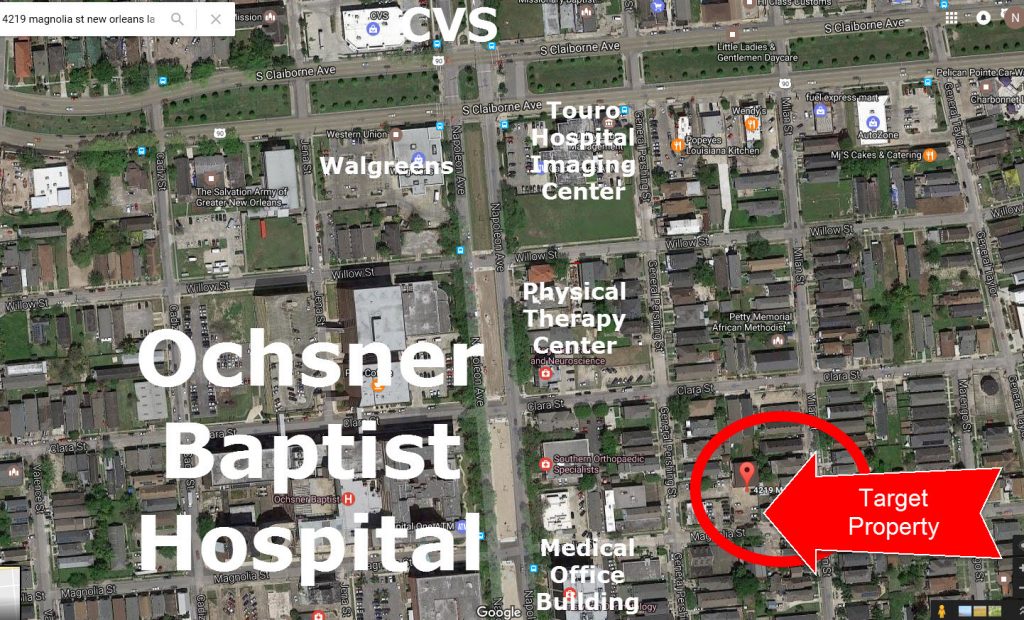
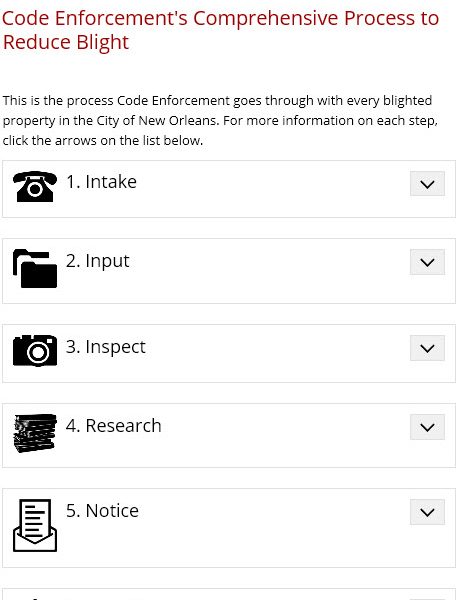


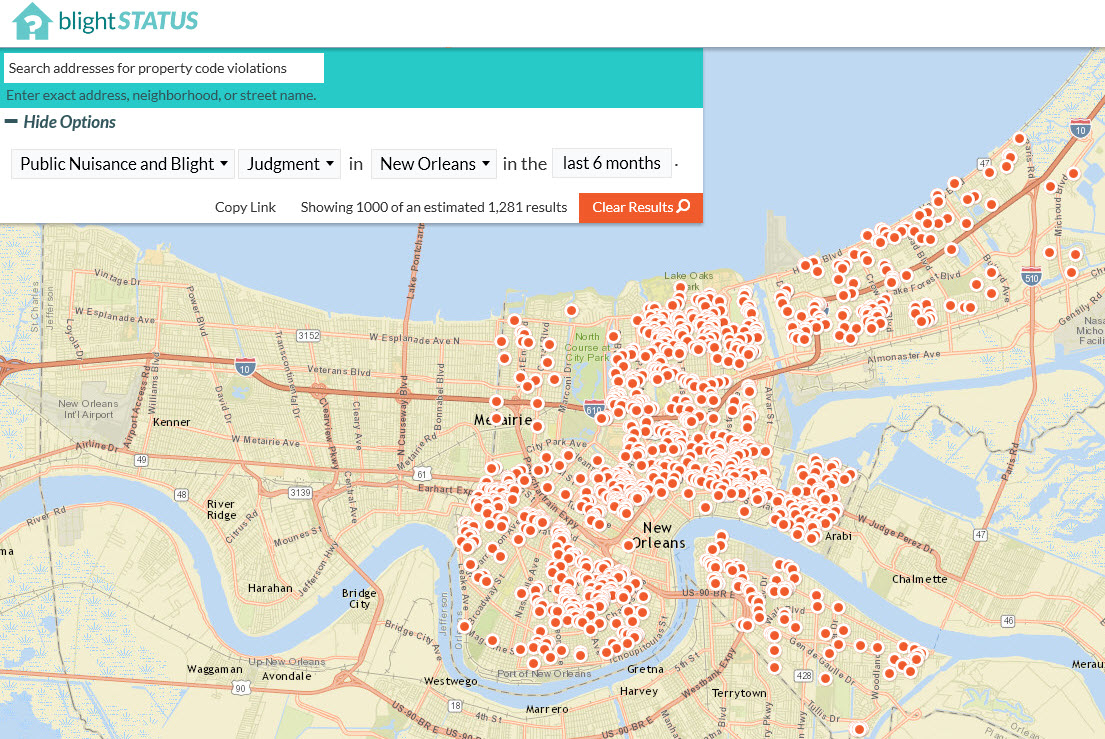
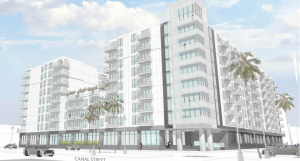
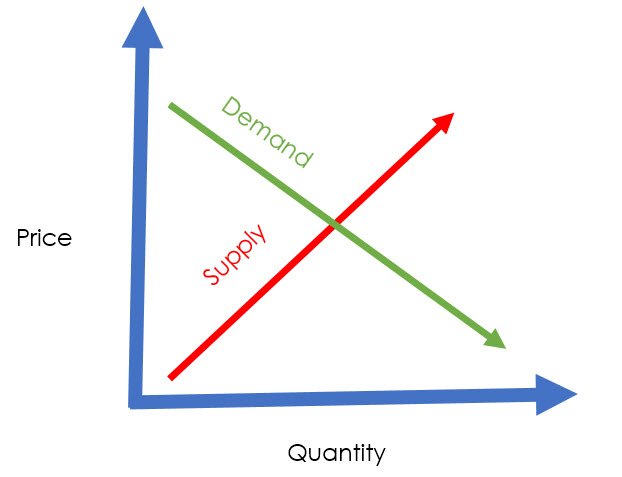

 The recent sale of 2537 Tulane Avenue for $5.6 million set a record highest price for property closest to the new $2 billion hospital development, so Citybusiness reached out to Louisiana Commercial Realty broker Robert Hand to discuss the trend on Tulane Avenue apartments and hotels:
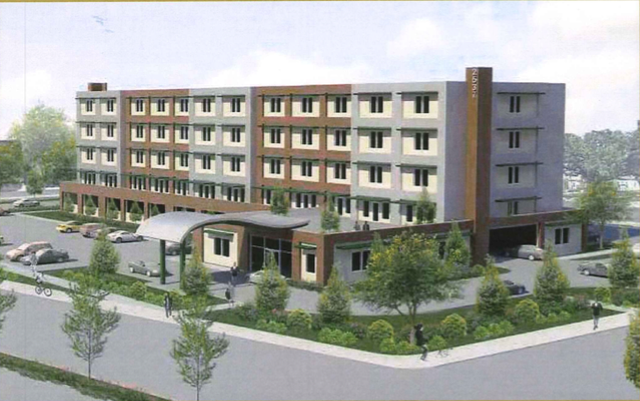

 The city is using consultant Leo Daly LLC as its advisor since they are experts in airport development, and the city is awarding the hotel land lease based on the weighting of these 5 criteria:
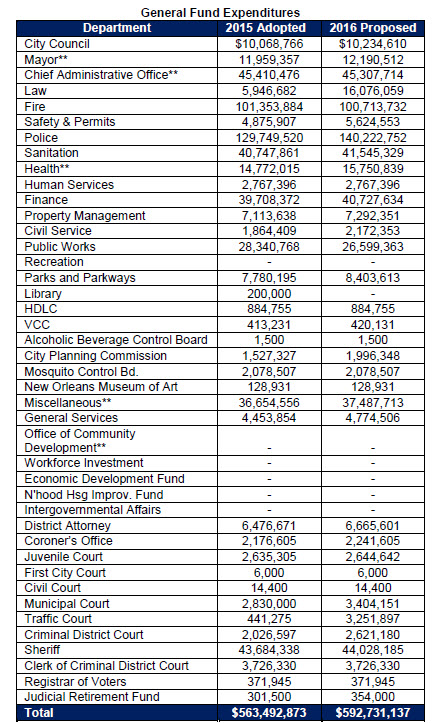
 The Lakeview Civic Improvement Association back in 2009 deemed one house to be a problem. The house had no electricity, even 4 years after Katrina, and the foundation was crumbling in disrepair with gaping holes big enough for rodents to live and breed and threaten nearby children playing in their own yard. The owners lived in another state and had no interest in repairing the property, but did have the resources to hire an attorney and fight the city.
 On August 27, 2009, the first hearing occurred. The hearing took place at the Code Enforcement Department office at 1350 Poydras Street. Present were the hearing officers, 1 or 2 people who are employees of the Code Enforcement Department, looking out for the residents and enforcing the city housing laws. Also present were the homeowners or their attorney. There was a stenographer taking notes. At this first meeting, the hearing officer decided to “reset” the meeting, which means nothing happens and it is delayed. Everything is on hold to give the homeowner a chance to correct the code violations.
 On June 9, 2016, Code Enforcement noticed there are several verdicts and appeals and agreed if there is a judgment as a result of the hearing on June 16th that it might not move forward until the appeals are resolved. Code Enforcement agents agreed to contact the appeals department across the street to find out why the appeals had not been resolved. Once a judgment to foreclose is decided by a hearing by the city due to unpaid city liens, city attorneys would be responsible for proceeding to have the property auctioned off. On June 13, 2016, Cherrel Taplin, Senior Chief Deputy District City Attorney, emailed participants that a hearing was scheduled for September 9, 2016.
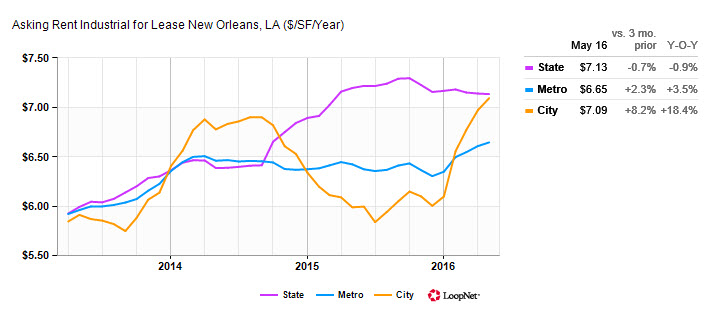


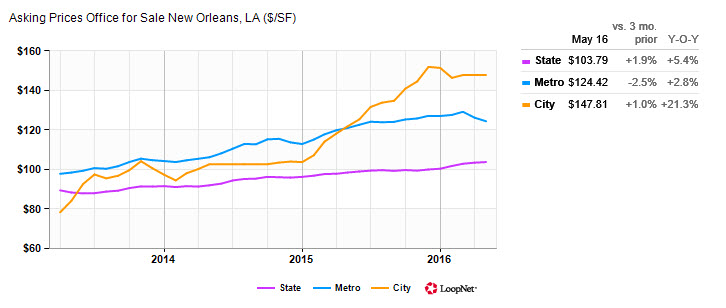


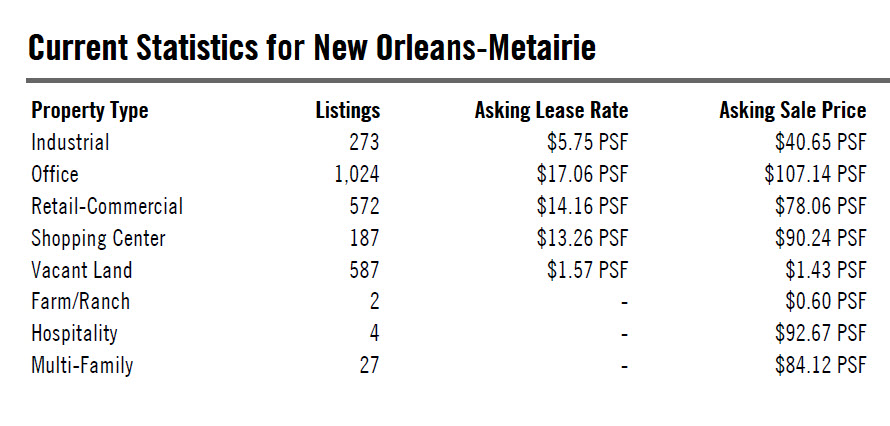

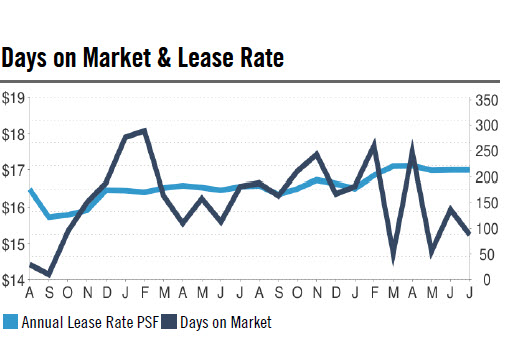
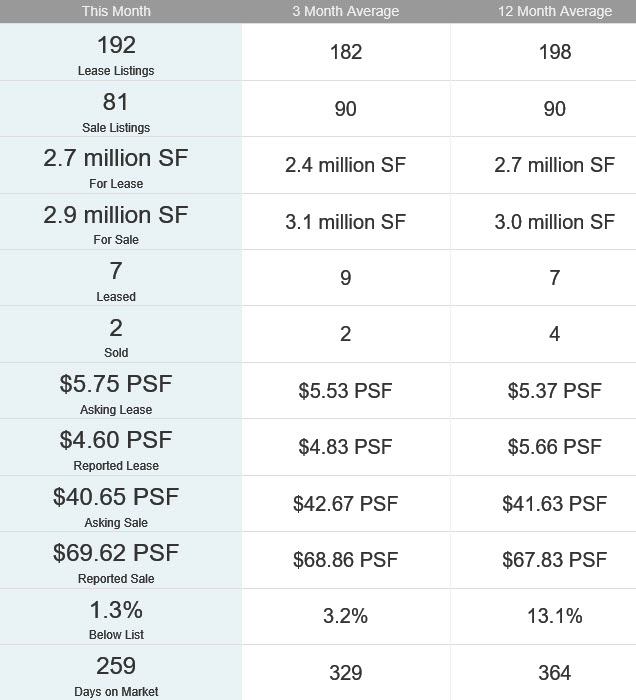
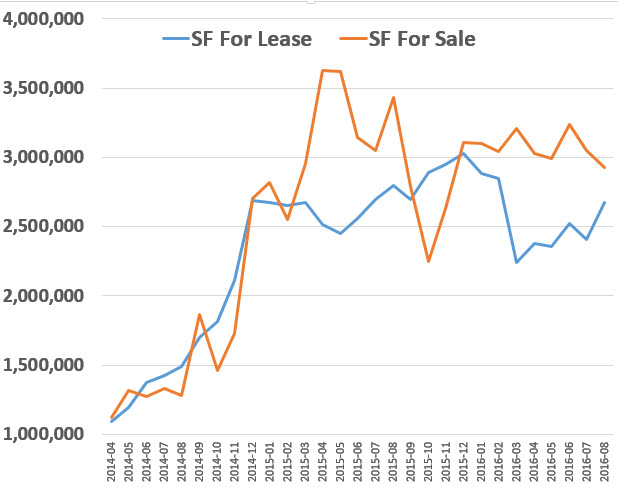
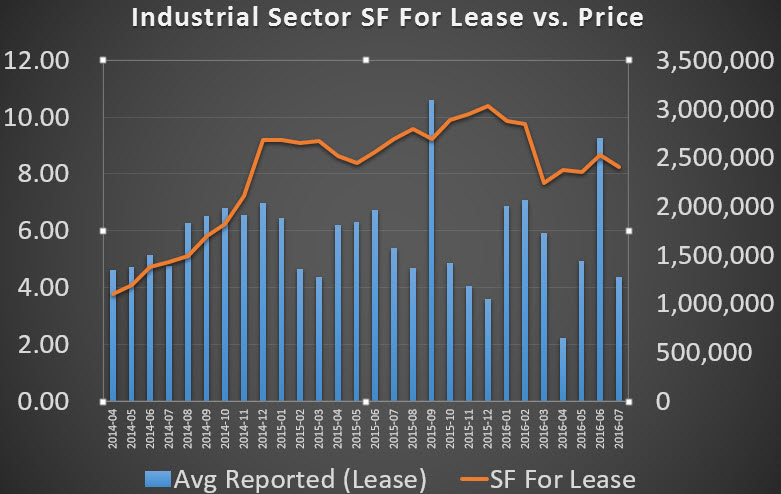
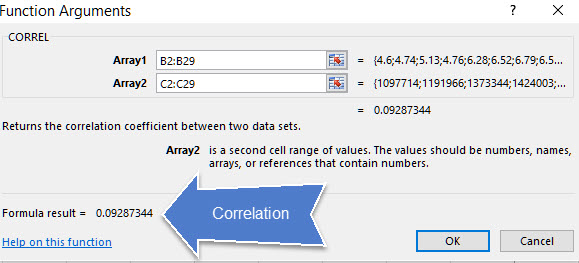
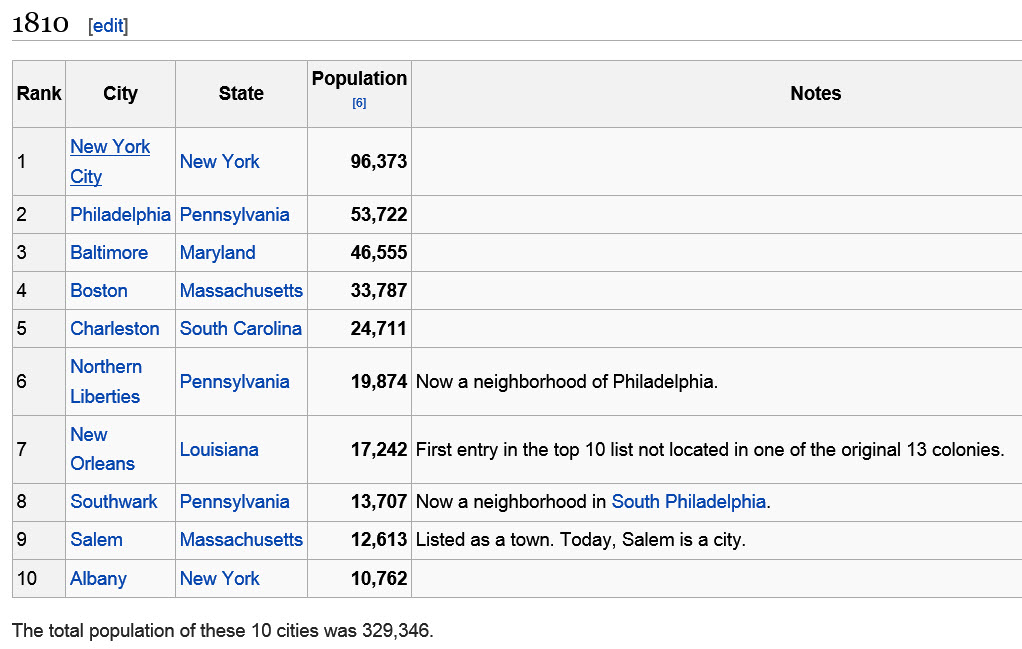
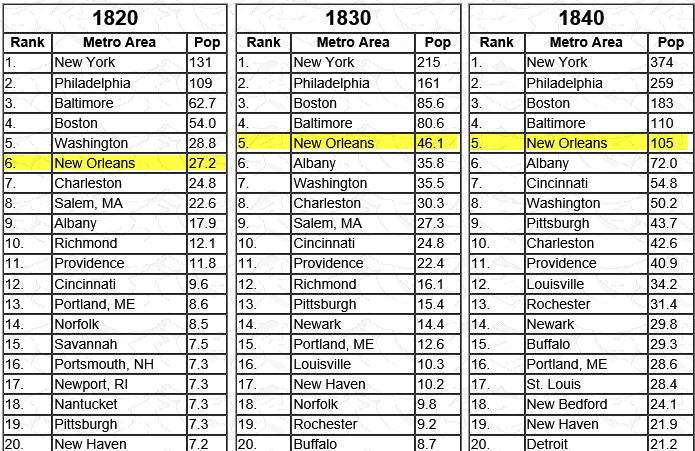


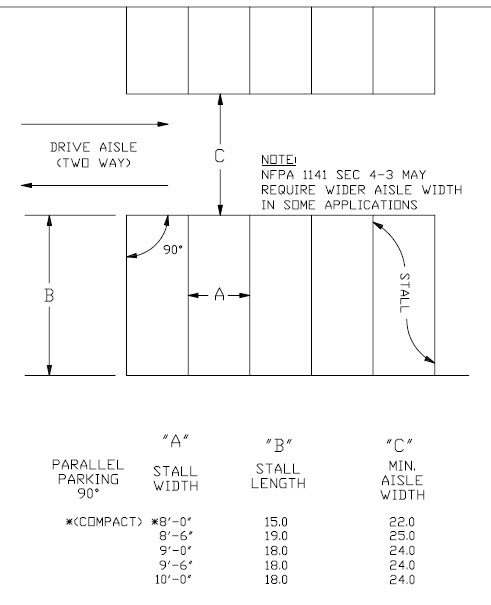

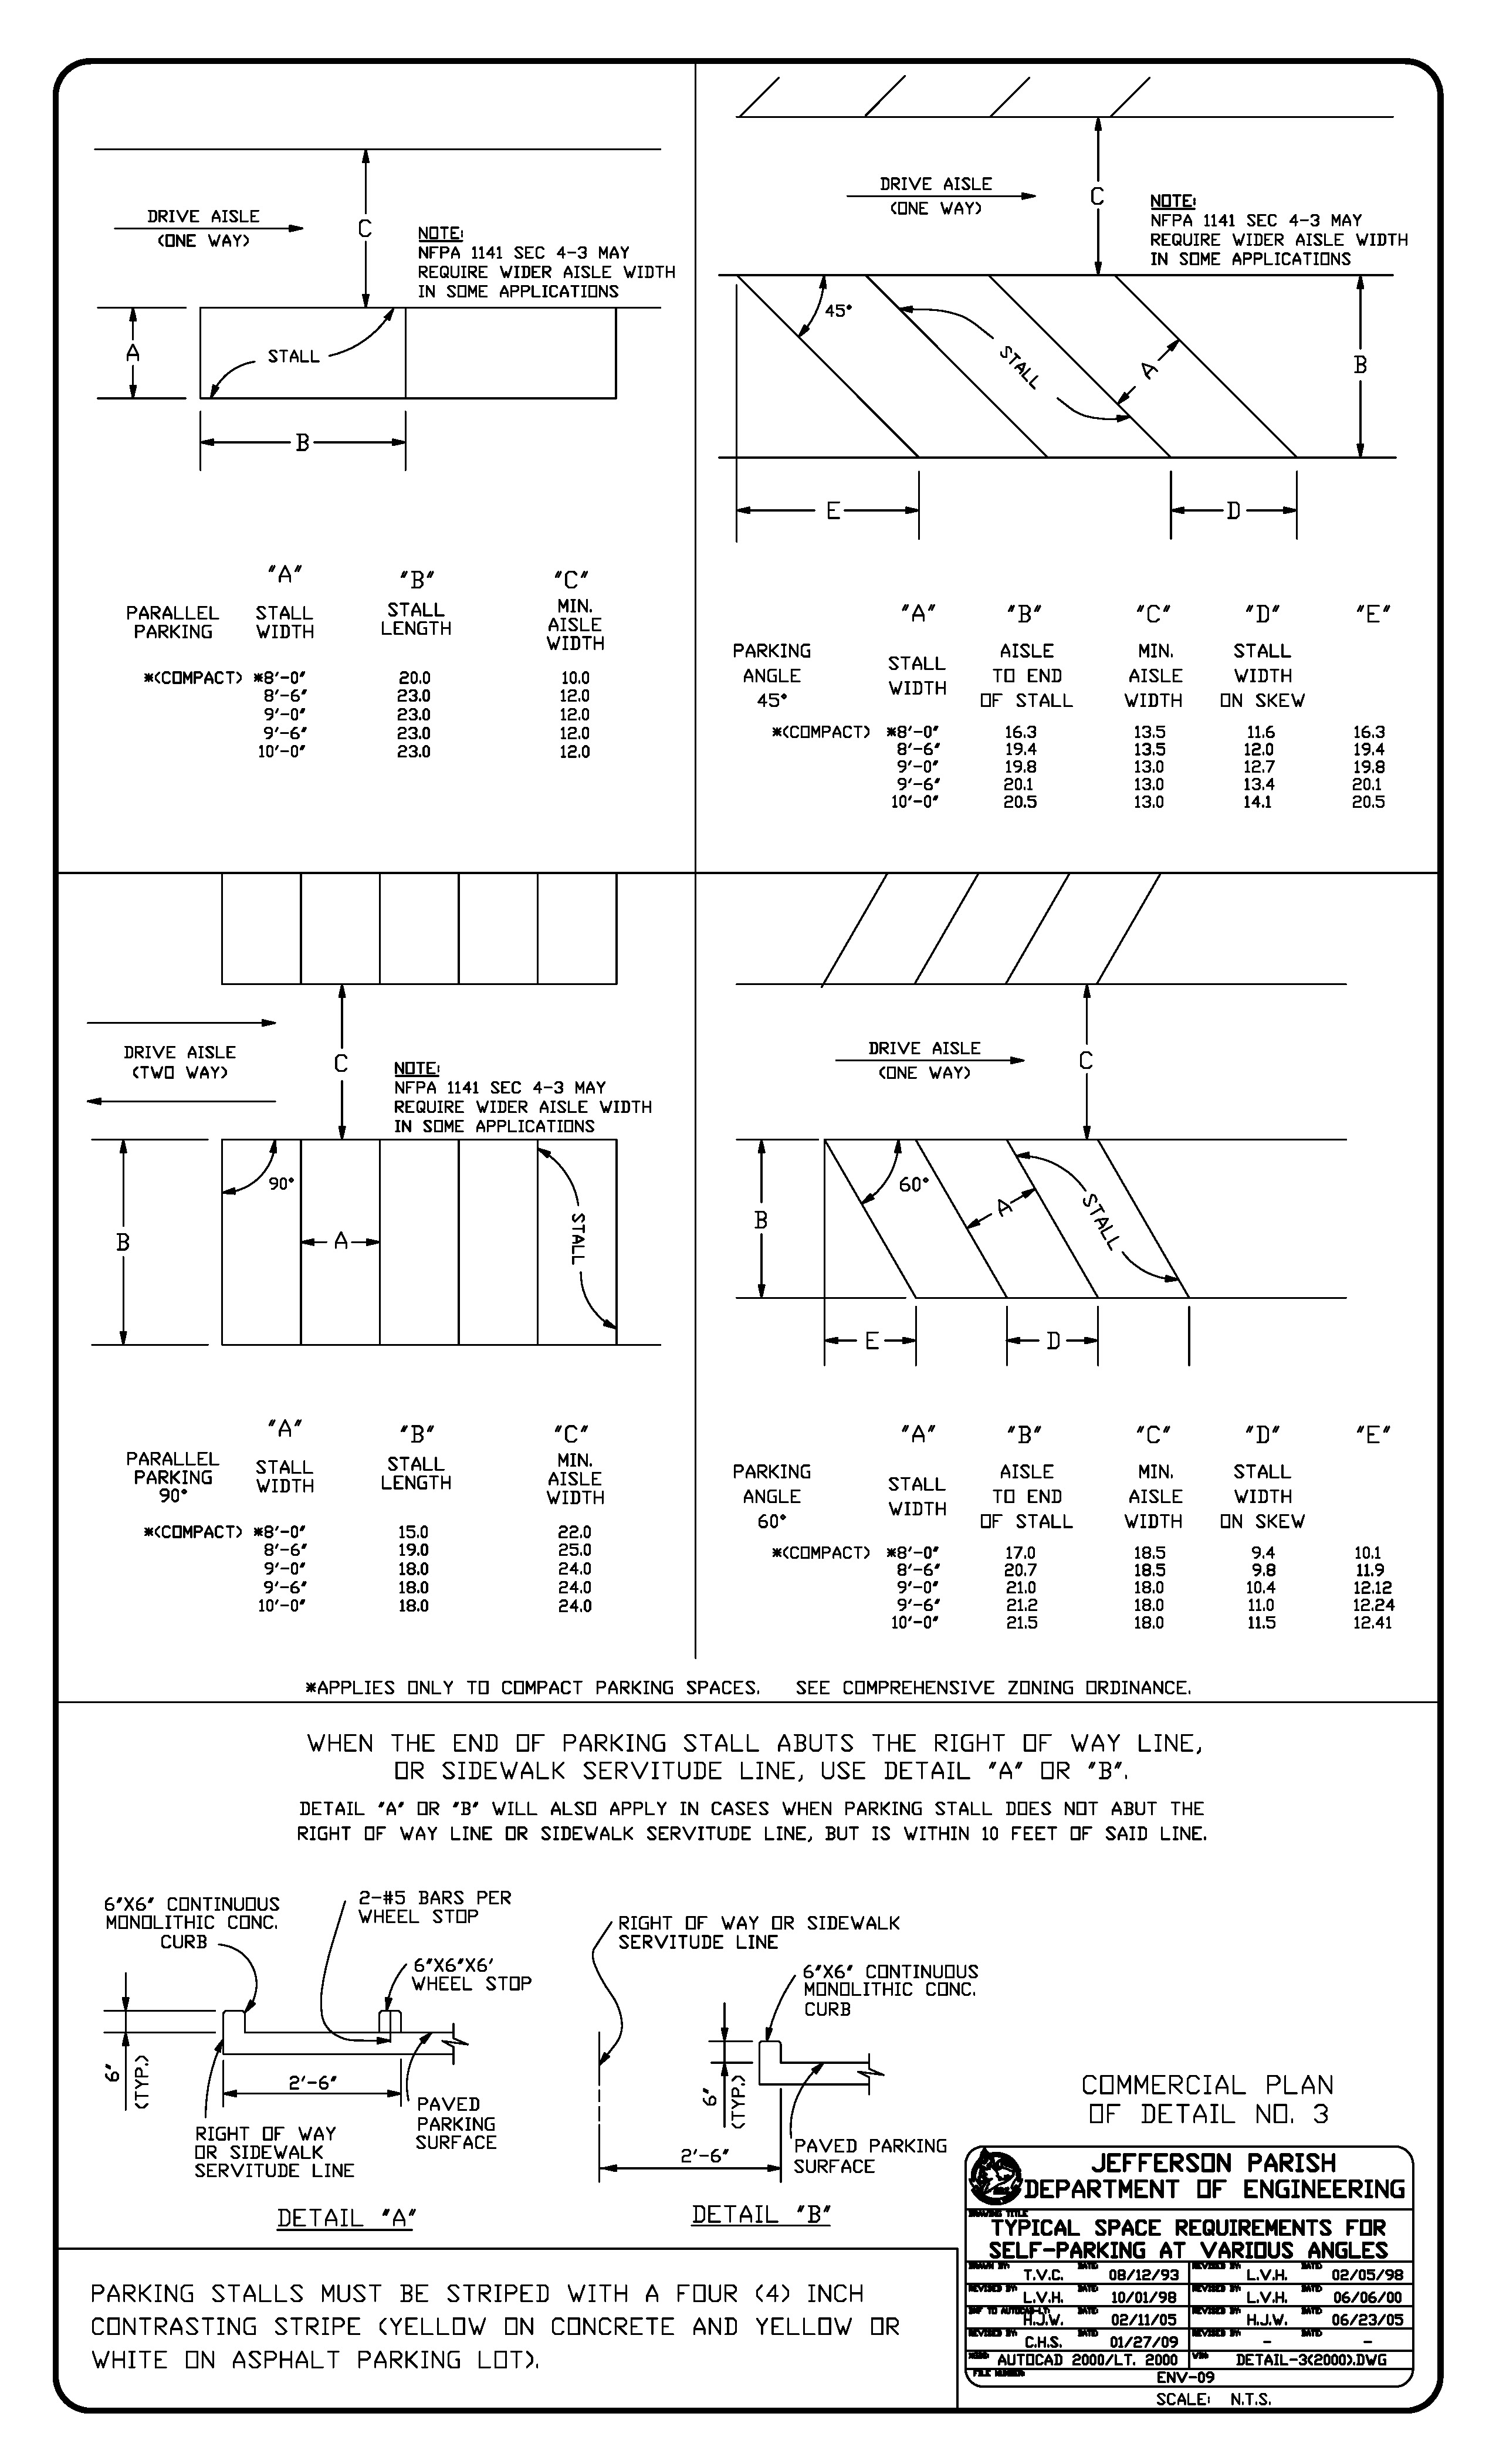
 There is guidance for home inspectors, regulated by the Louisiana State Board of Home Inspectors, who produces a Code of Ethics and a Standard of Practice, which states the inspection report shall include:
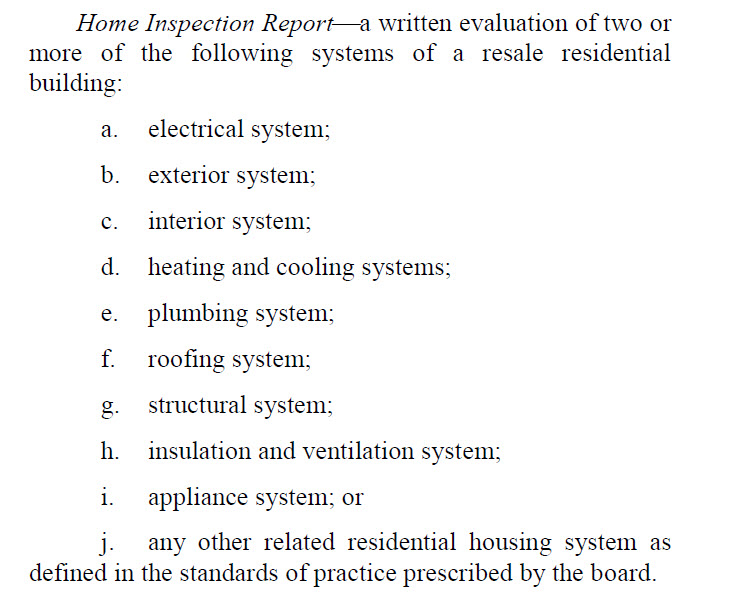
 Any good company CEO, parent of a 4 year old or owner of a chocolate lab knows that in order to change behavior, all you have to do is make sure your incentive creates the behavior that matches your goal. The disconnect is that the incentive for the inspection company is to get hired to produce a report that has language which justifies to the purchaser a renegotiation in the price of the property. The real estate agent is an unknowing participant in this process, especially if they are impassioned about looking out for their client's best interest. The loser is the real estate industry, which suffers from the disappointment by both buyers and sellers at the process, because both are relying on their experts and examine the same situation and come to the insanity of opposite conclusions.
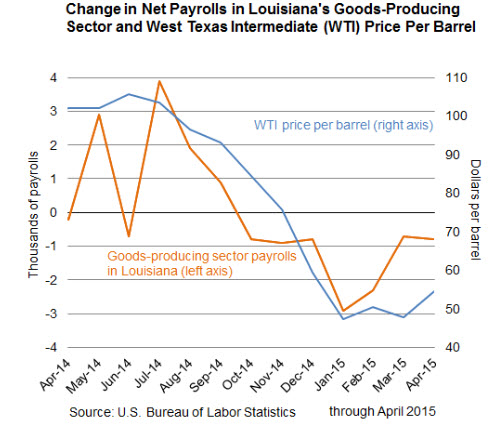

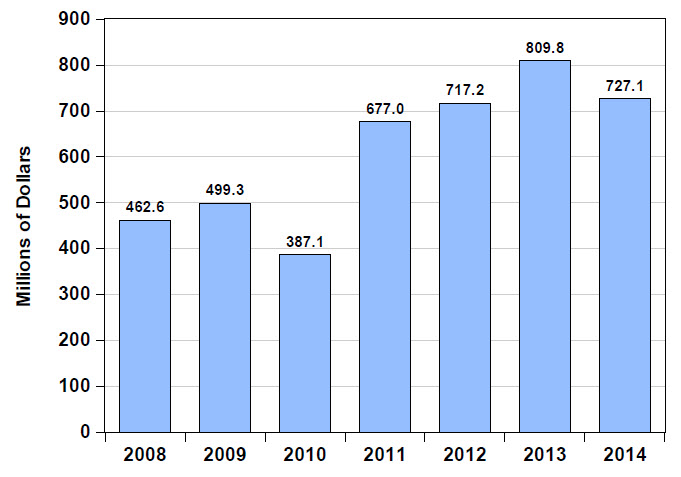
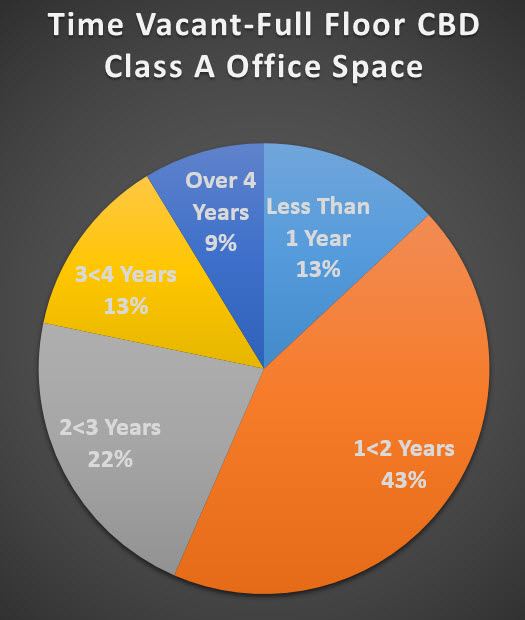
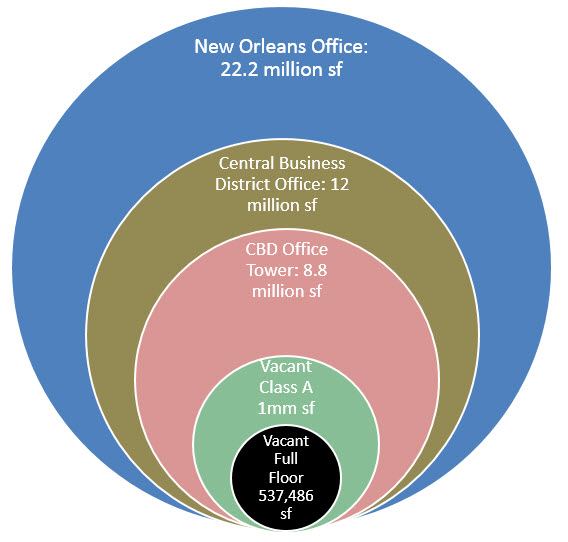
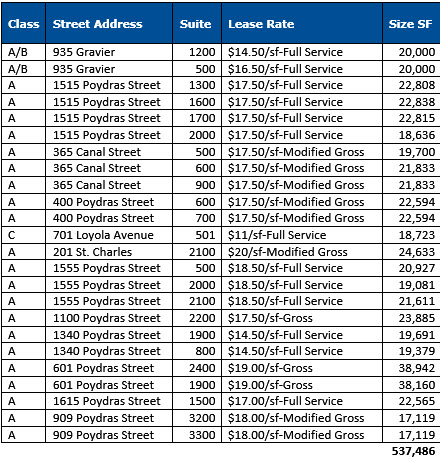
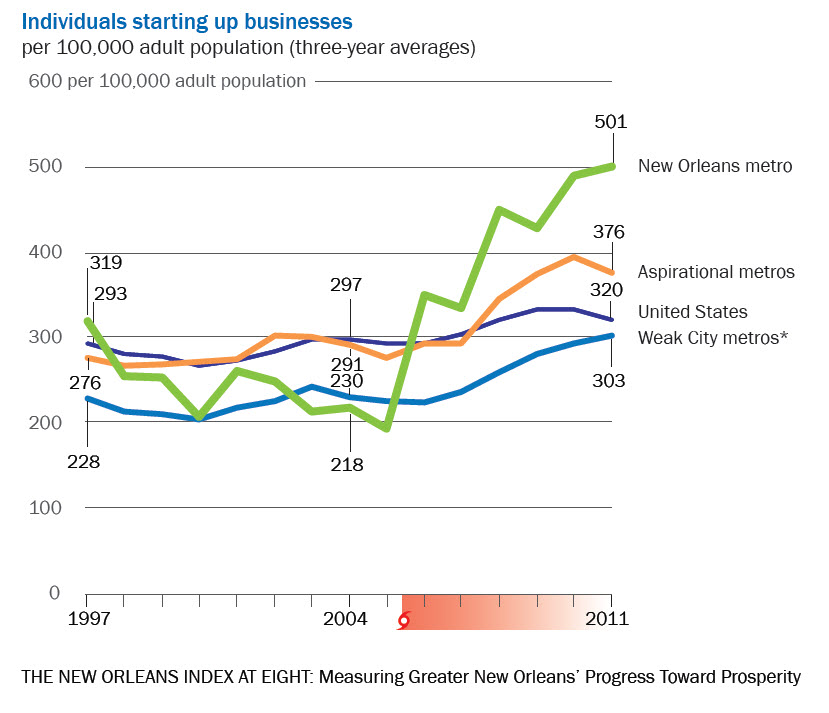
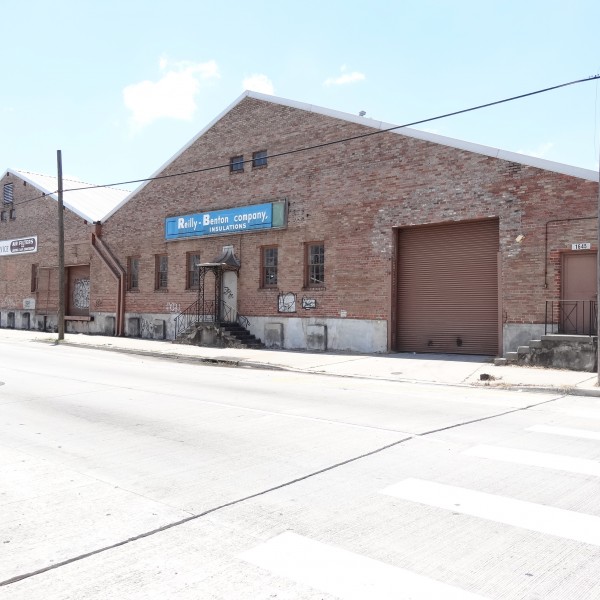 It is a 100 year old well known historic-looking warehouse, steeped in the history of New Orleans as a port city, and the owners have recently hired Louisiana Commercial Realty to market nationwide the 39,042 square foot brick building for lease. The building has been family owned for almost half a century, and recently two family members bought out the remaining family, made improvements and began leasing the building themselves to a movie studio and a metals company for storage.
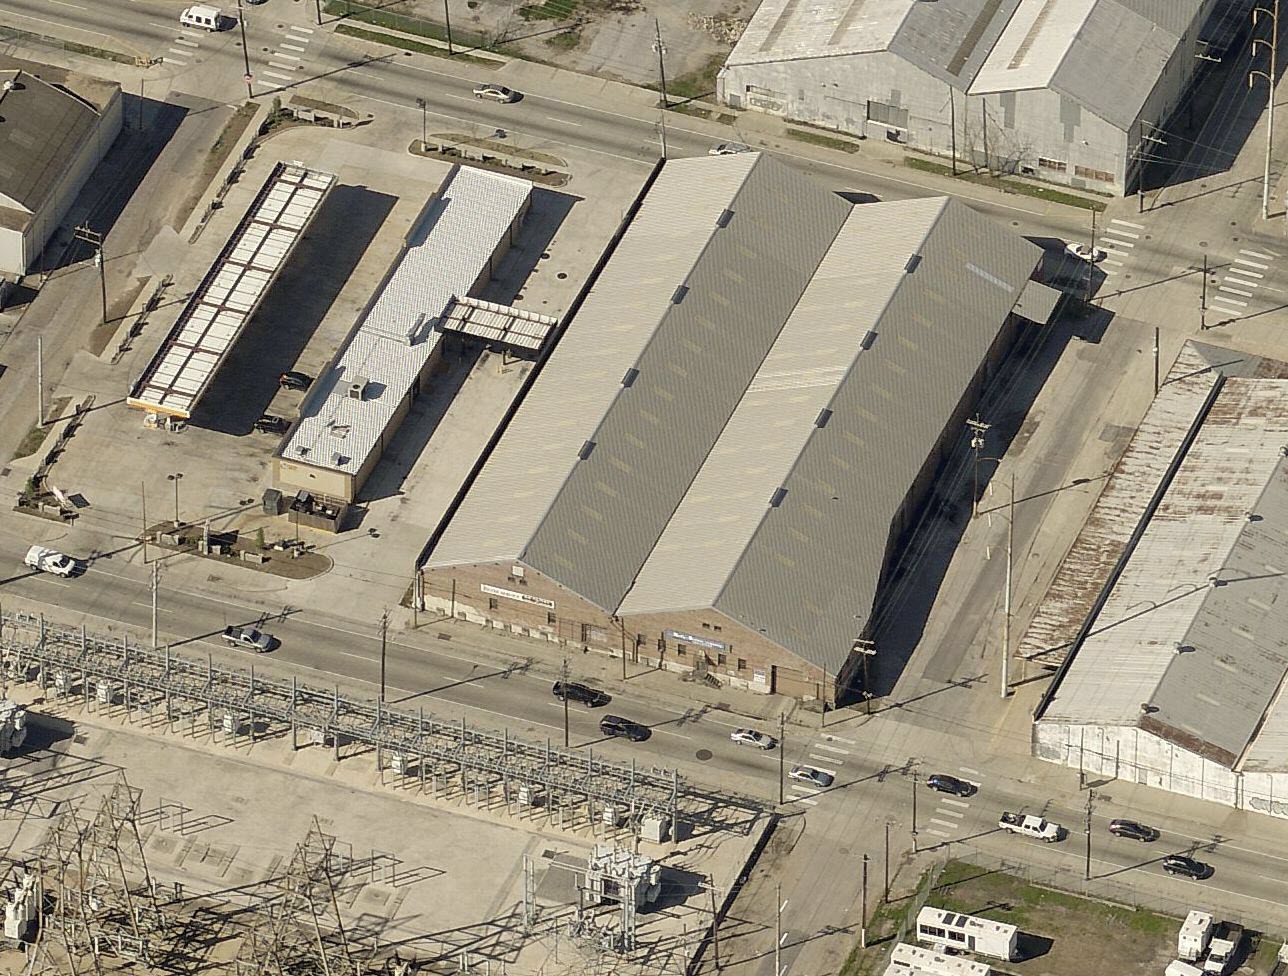
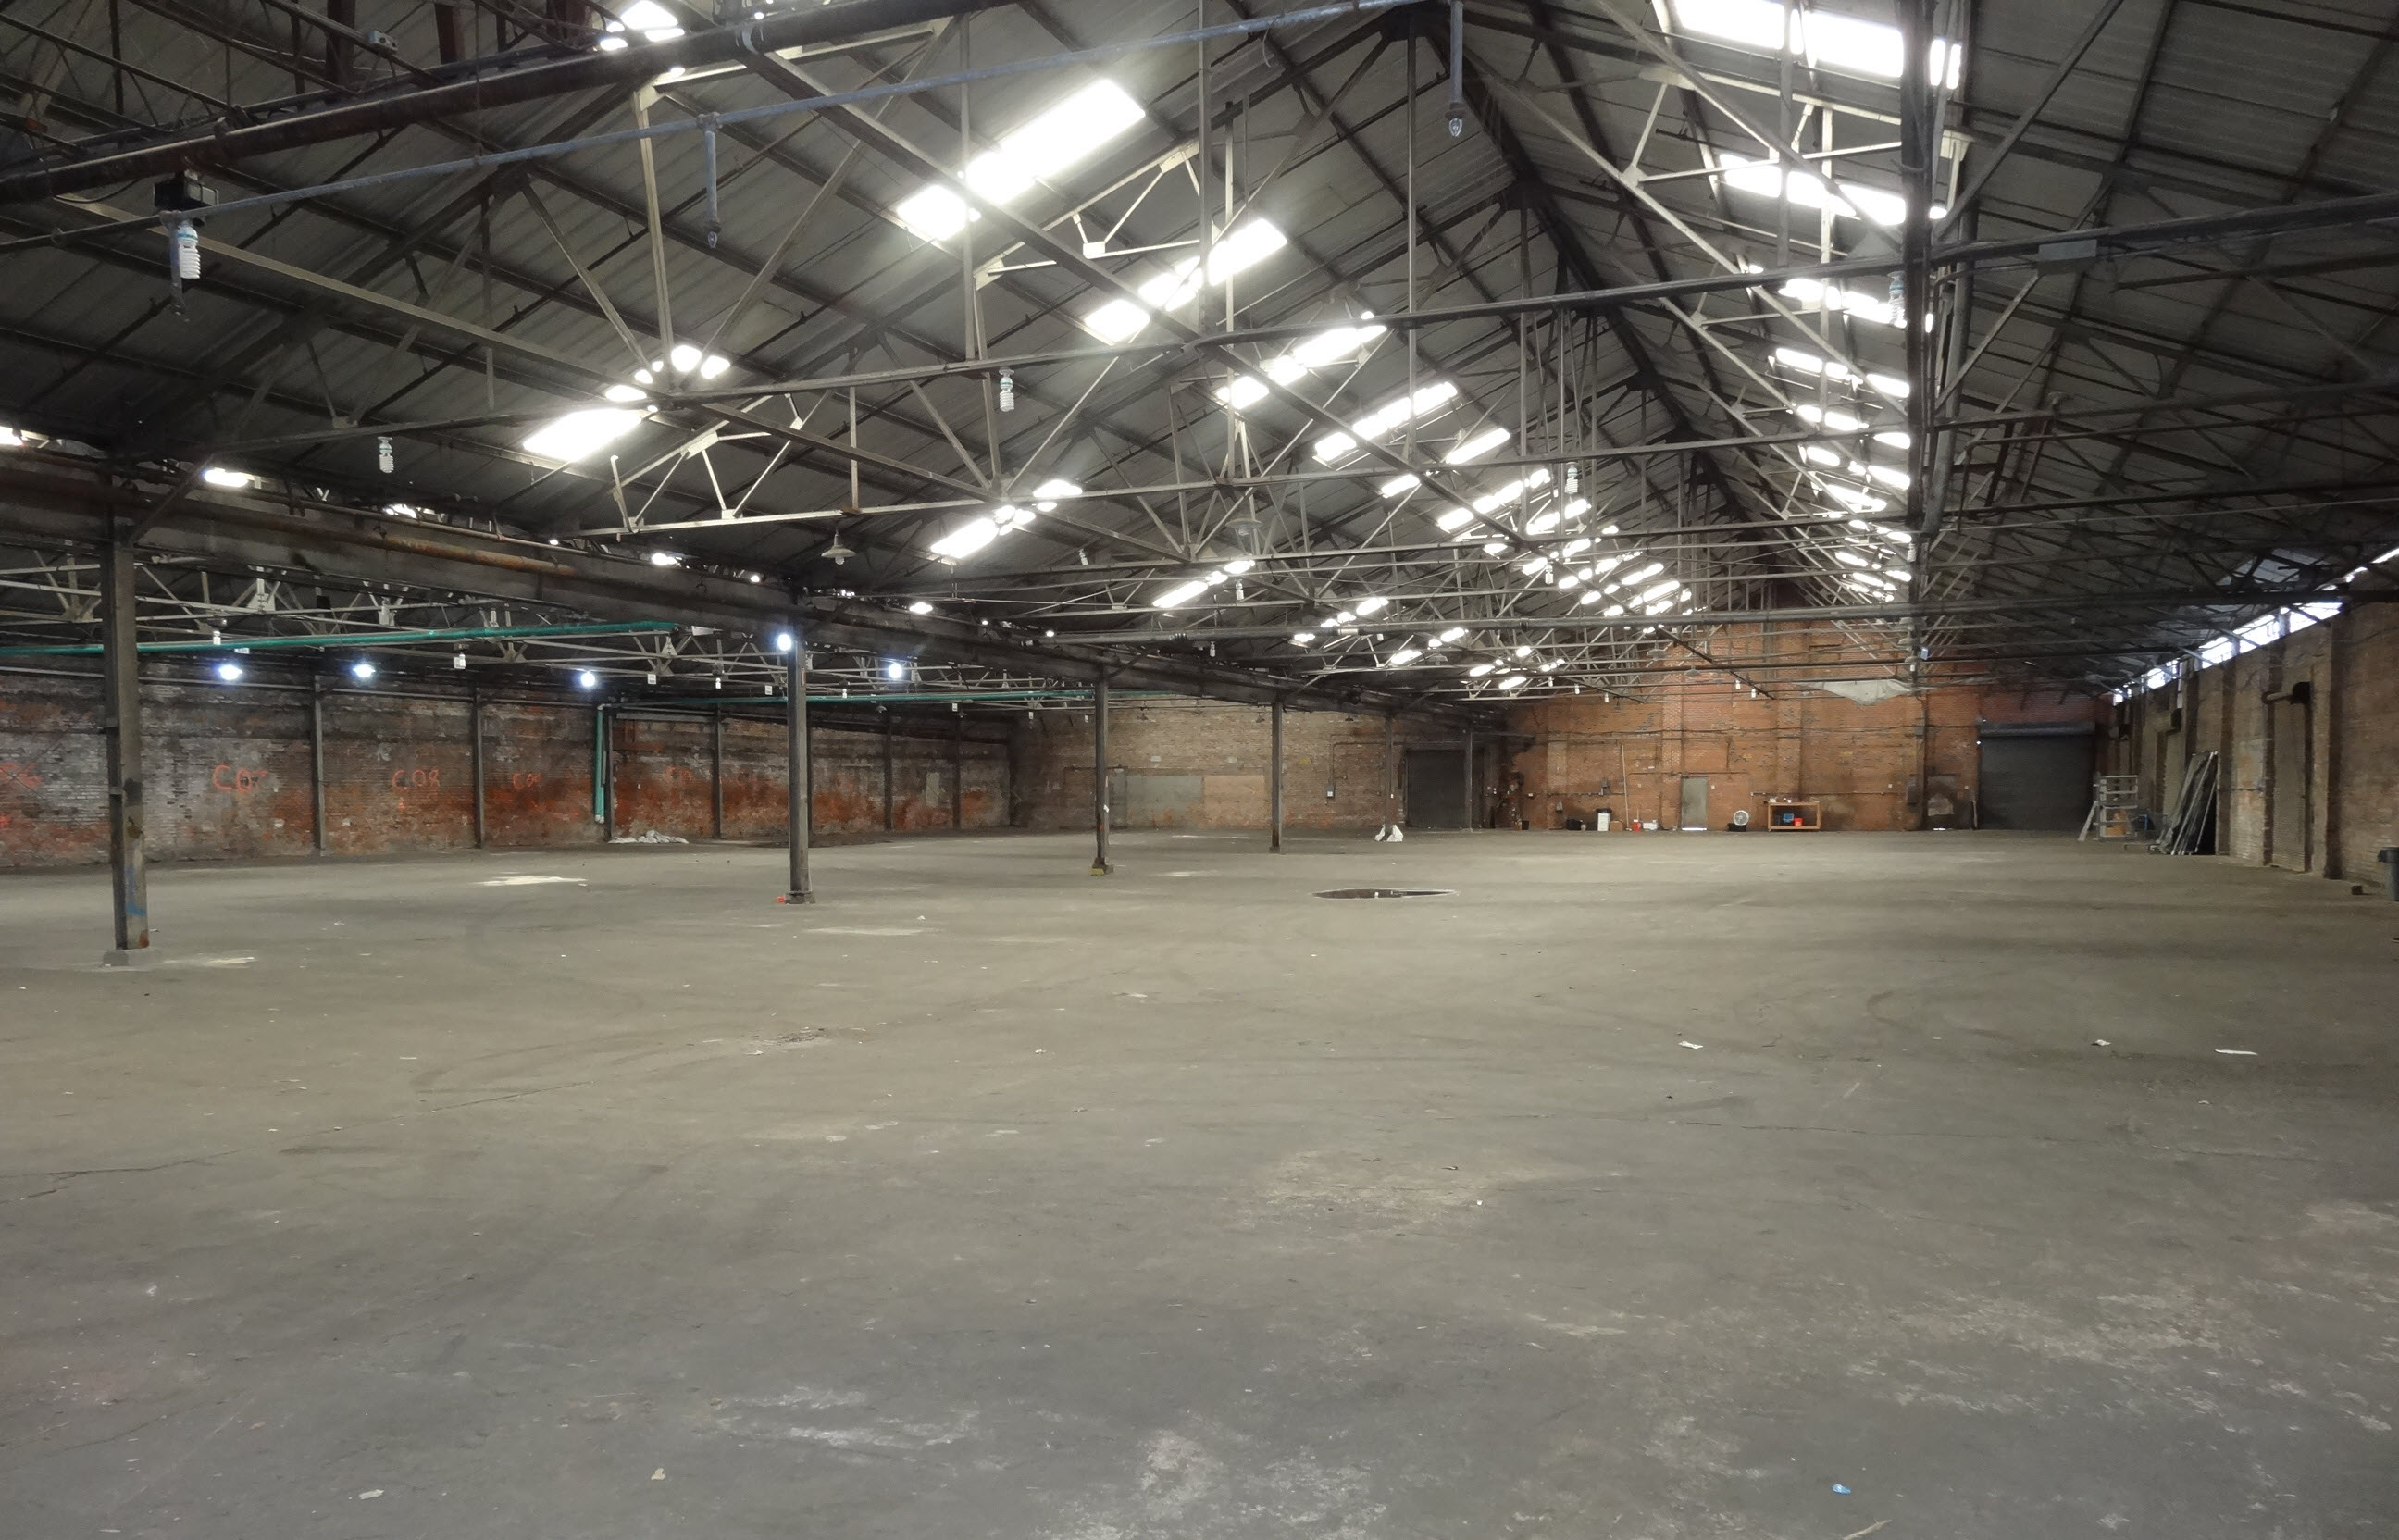
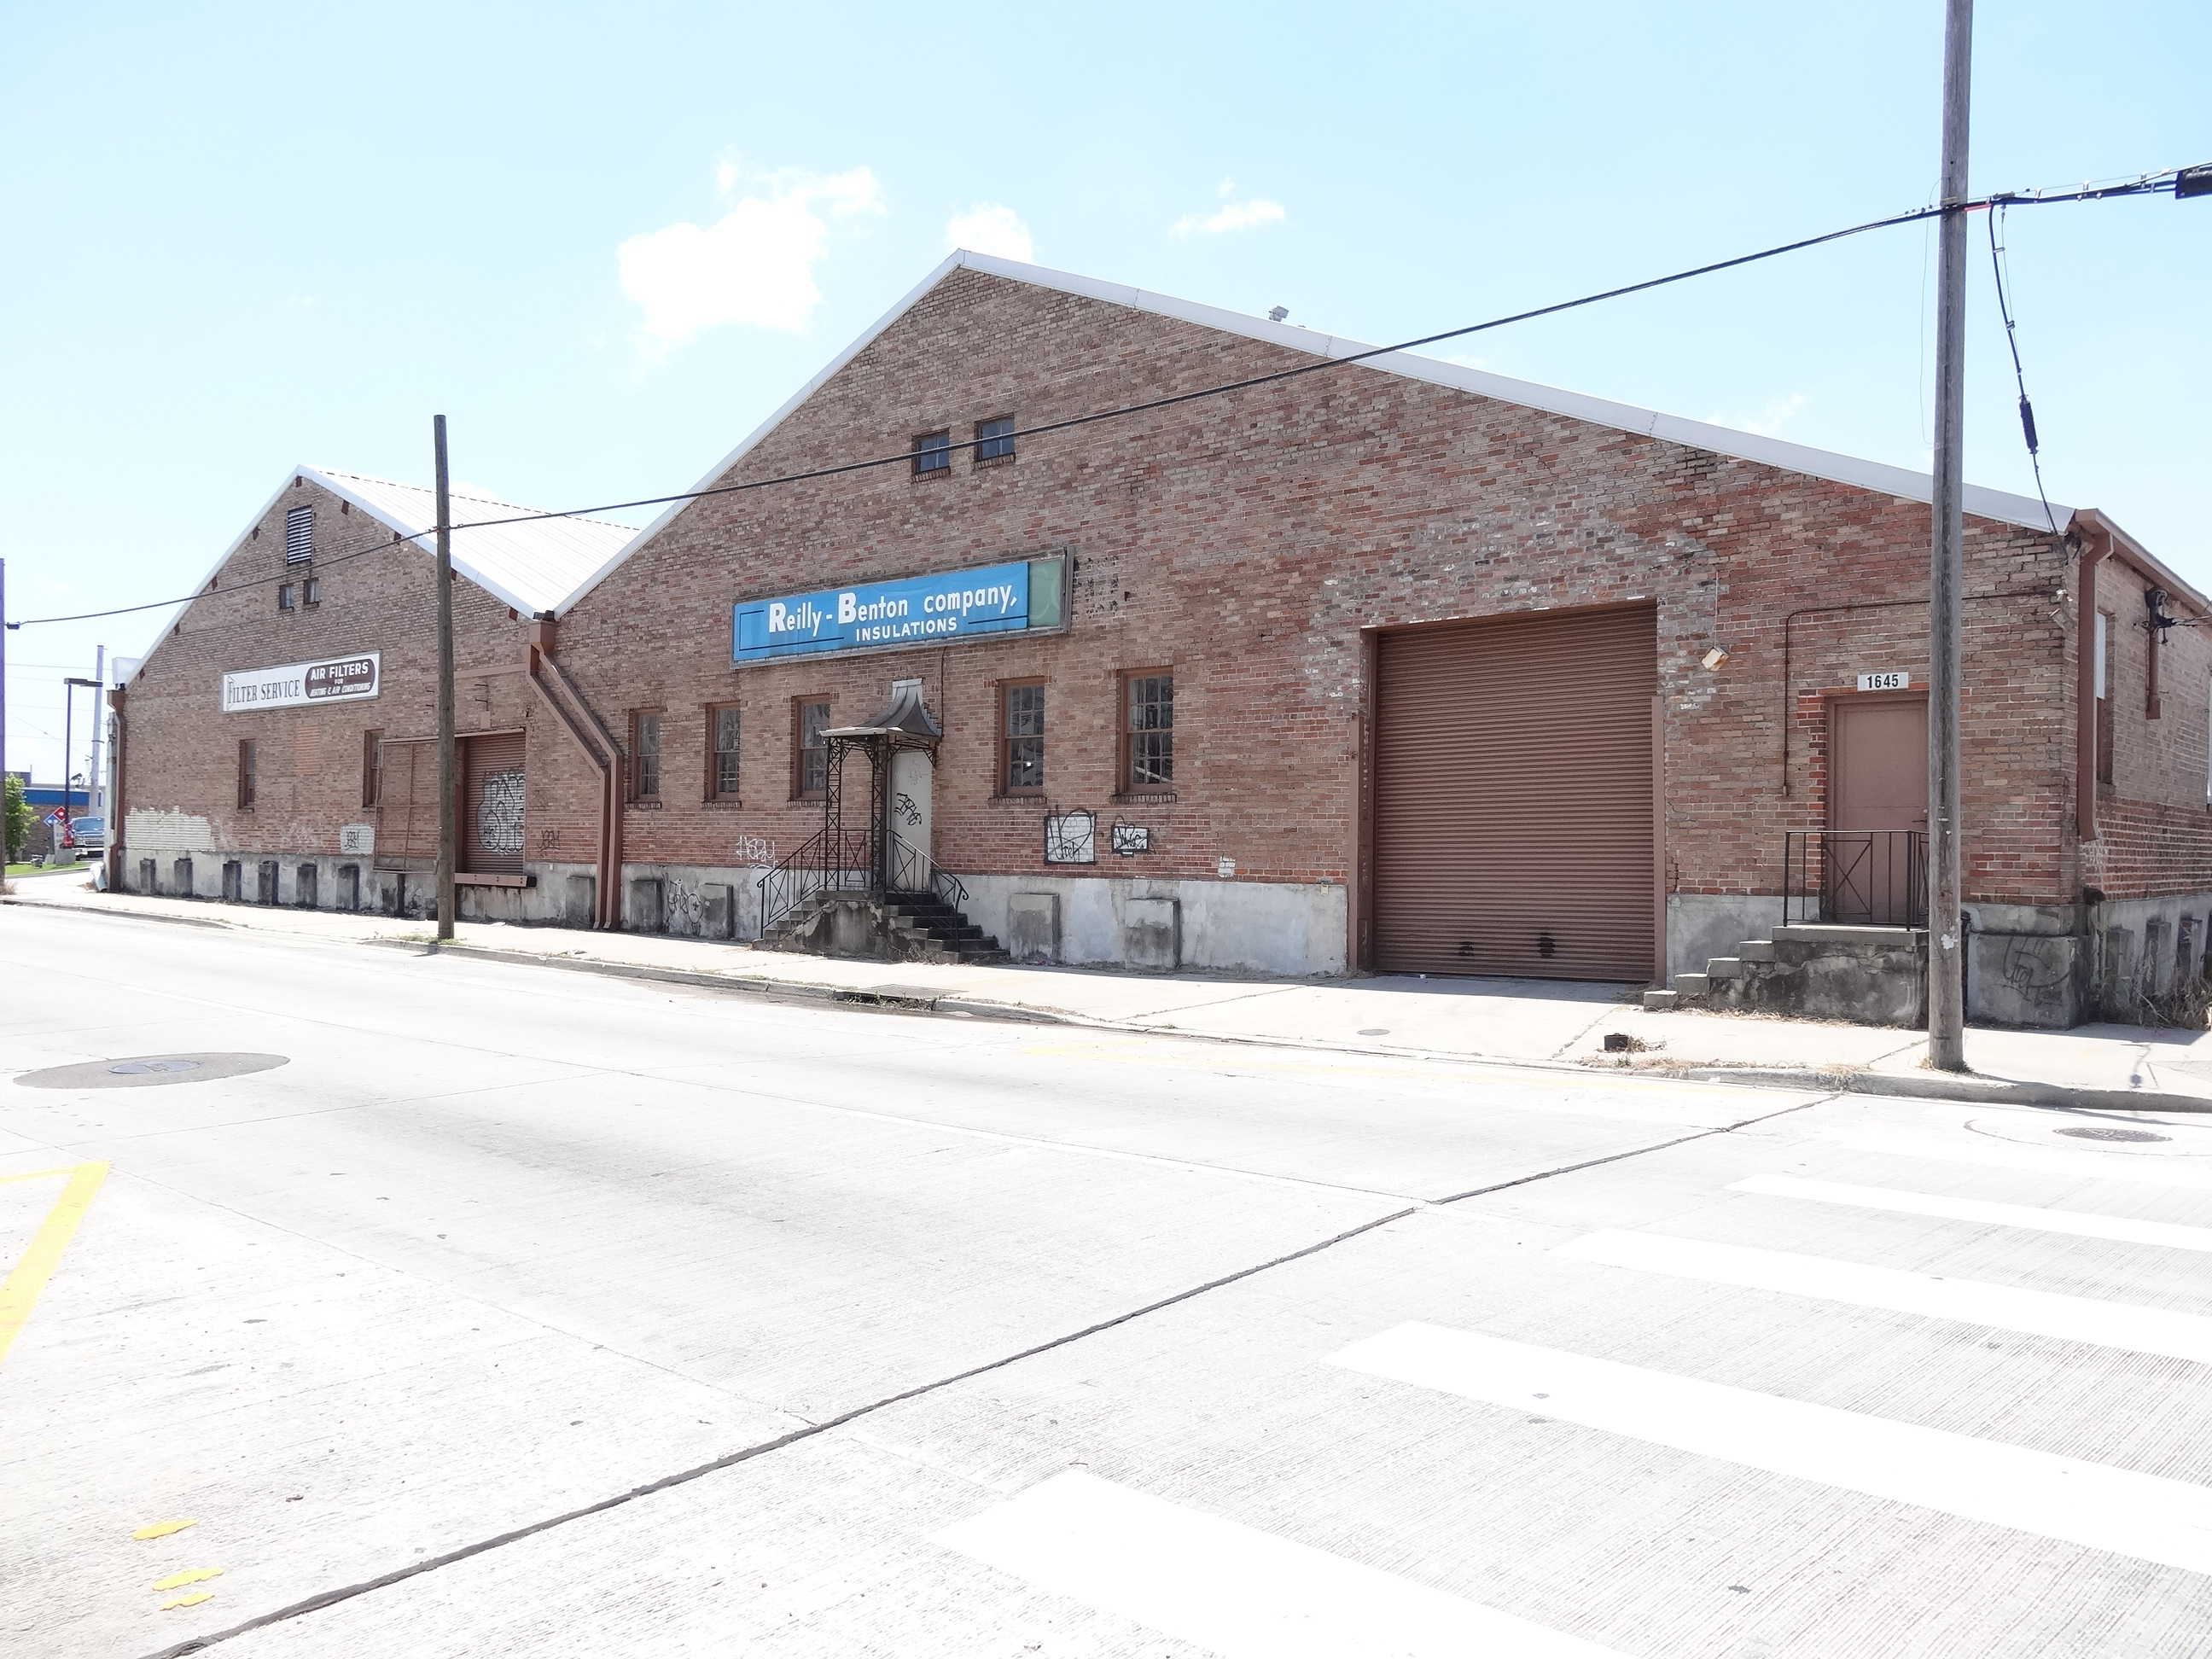
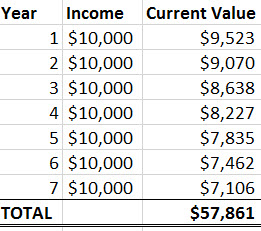

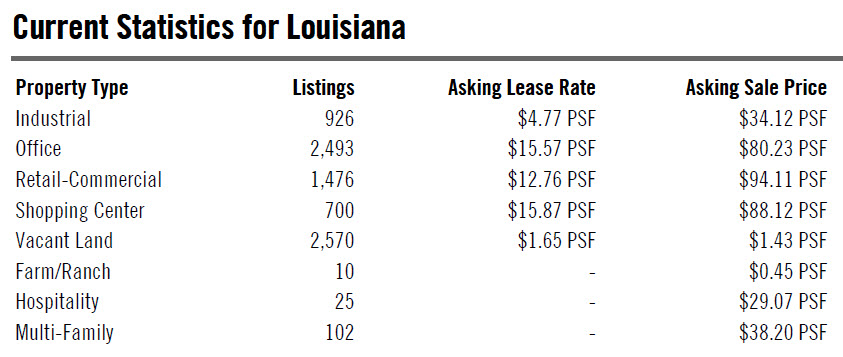


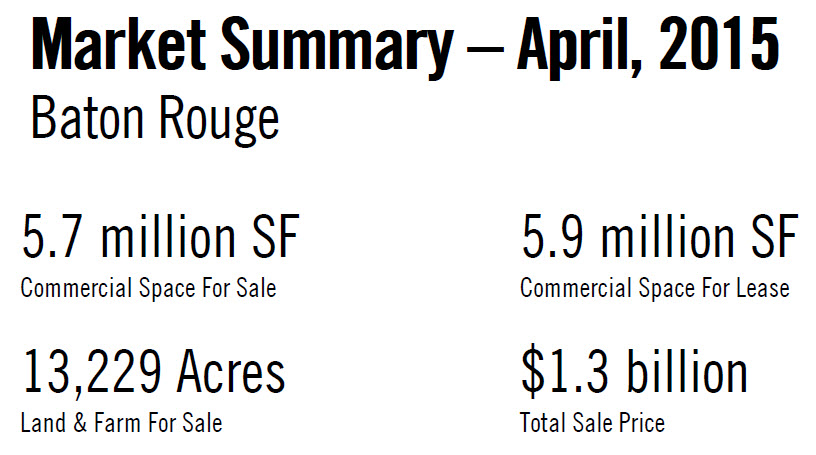
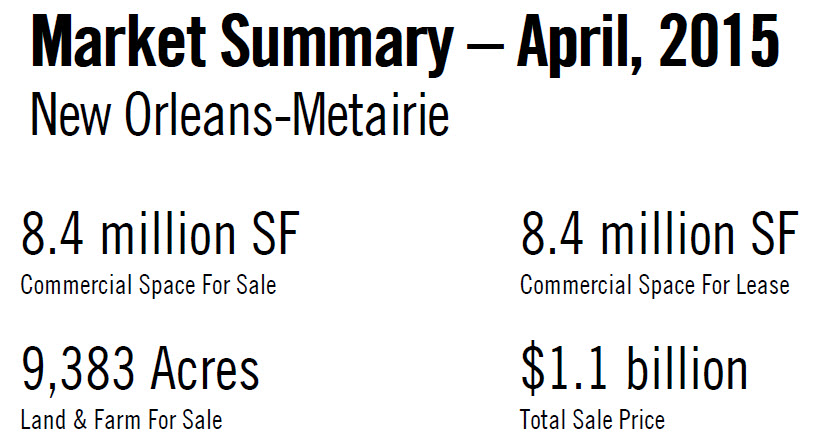
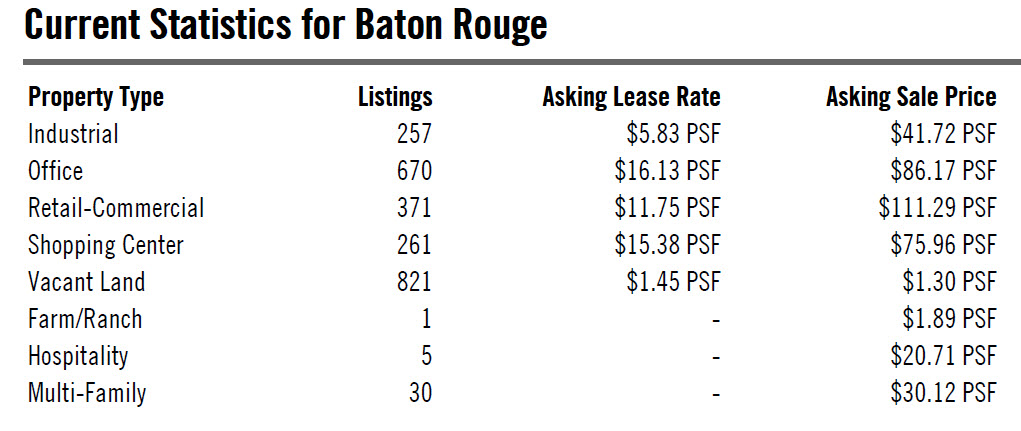
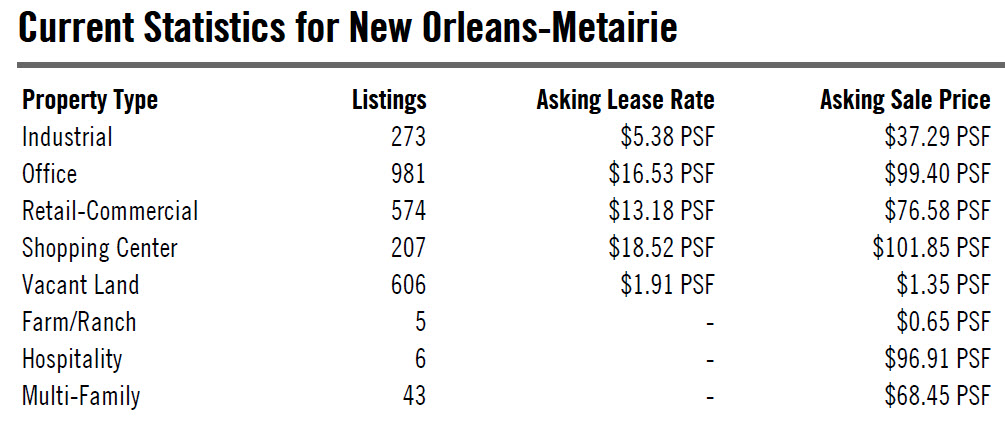
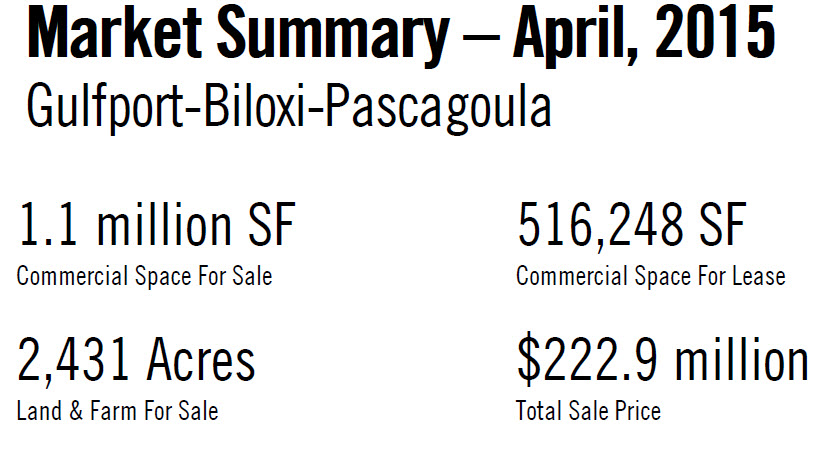
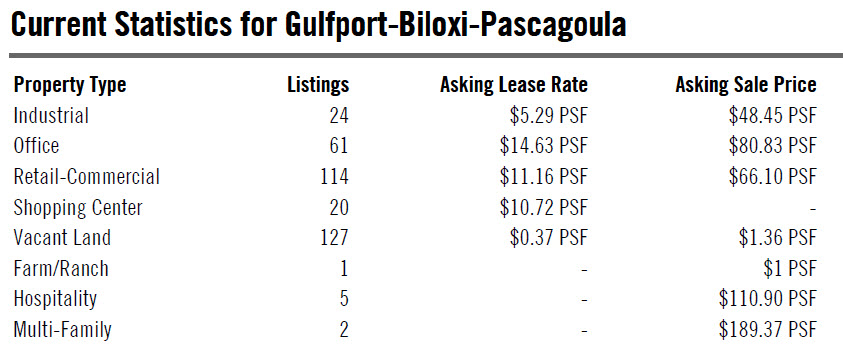
 Industrial Market In Detail
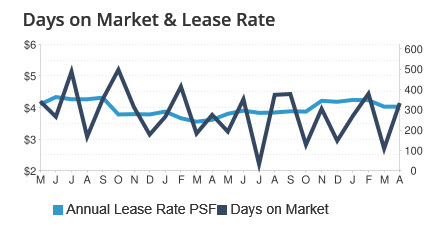
 A vacant hotel property that is among the largest pieces of available real estate along Tulane Avenue recently changed hands after more than three years on the market.