
Normally when people ask if an area floods they are talking about heavy rains causing water to pool in the streets until the city pumps can suck the water down the drains and into the Mississippi River, but since Hurricane Katrina caused the levees to fail and flood the city with water from Lake Pontchartrain, and Harvey soaked Houston with 50 inches for 4 days, and Irma storm-surged from Miami to Tampa, flood insurance has become more than a luxury. Forget about global warming and let's study the foundation of flood insurance called the FEMA flood map; this article discusses everything you need to know, but were afraid to ask, including step-by-step guidance on how to read a flood map and create your own for any location.
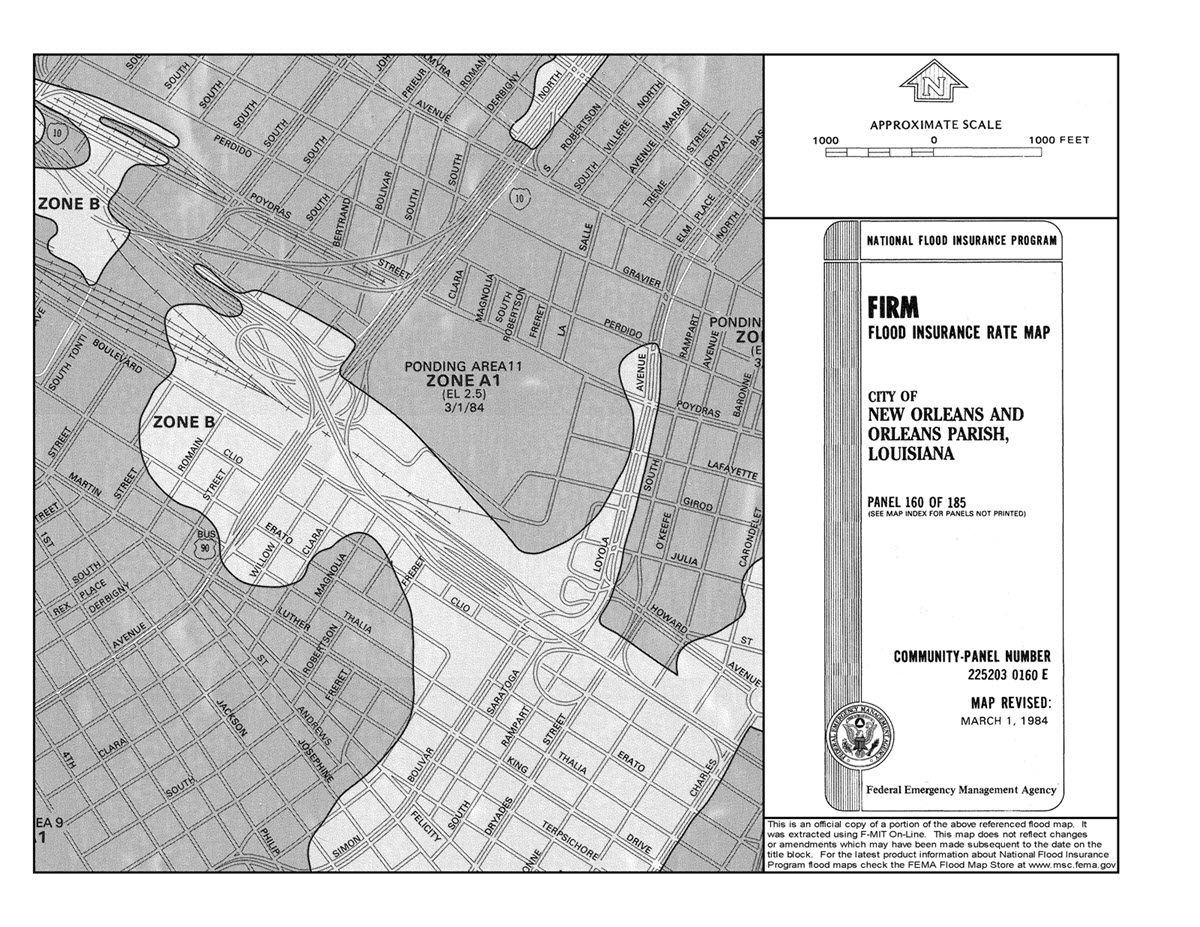
Protecting residents from the financial loss due to flooding, no matter whether it is from heavy rains or levee breaches, dates back to 1968 when Congress created the National Flood Insurance Program, giving the responsibility to the Federal Emergency Management Agency (FEMA) for producing Flood Insurance Rate Maps that show areas subject to flooding based on historic, meteorological, hydrologic, and hydraulic data.
The Flood Map provides information that allows you to identify not only Special Flood Hazard Areas but the Base Flood Elevation at a specific site, as well as areas of undeveloped coastal barriers where flood insurance is not available.
Flood Maps provide a wealth of information, including:
A 100-year flood is not a flood that occurs every 100 years, but one that has a 26 percent chance of occurring during a 30-year period, the length of many mortgages. The 100-year flood is a regulatory standard used by Federal agencies and most states, to administer floodplain management programs, and is used by the National Flood Insurance Program (NFIP) as the basis for insurance requirements nationwide. Special Flood Hazard Areas (SFHA) are those areas having at least a 1 percent chance of flooding during any one year. Flood Maps are easy to get and are found online at FEMA's Map Service Center, http://www.msc.fema.gov.
To discover the flood risk in your vicinity and use the Interactive Web Mapping Portal, first start with the general area such as the target property's parish or county. For example, in New Orleans, choose a Parish from the list below by clicking the a link:
Jefferson Parish, Orleans Parish, Plaquemines Parish, St. Bernard Parish, St. Charles Parish
Let's say we want flood zoning information on the Mercedes Benz Superdome in New Orleans, so we click on Orleans Parish, and when the map opens up, type in the target address in the box at the top left. The address for our target property, the Superdome, is 1500 Sugar Bowl Dr, New Orleans, LA 70112.
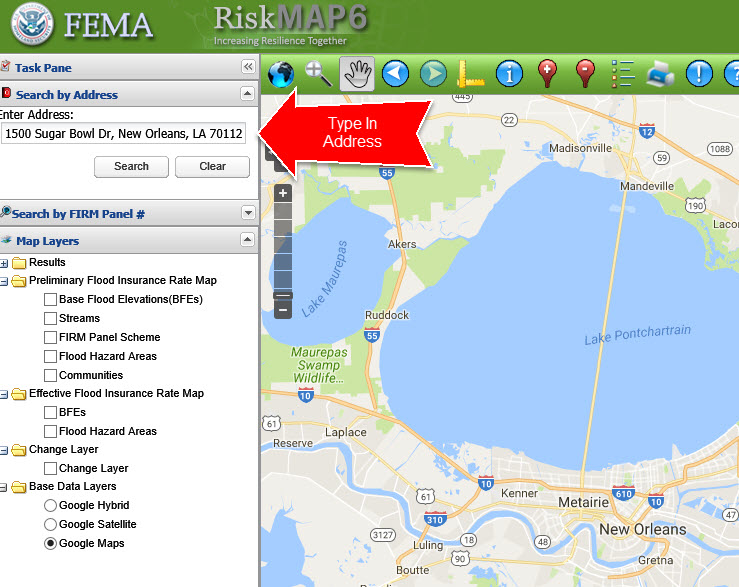
Since the map is interactive, you can select a variety of options including satellite view, preliminary or effective map and panel or address view. Uncheck any pre-checked boxes in the panel on the left, and check Address Search Result, Flood Hazard Areas and select the radio button Google Hybrid as shown below:

Click the Identify icon at the top of the screen. It looks like a white (i) in a blue circle. If you hover over it, the function will pop up.
![]()
Then click on your target site to generate a pop-up box showing the Base Flood Elevation, Flood Zone, Panel Number.
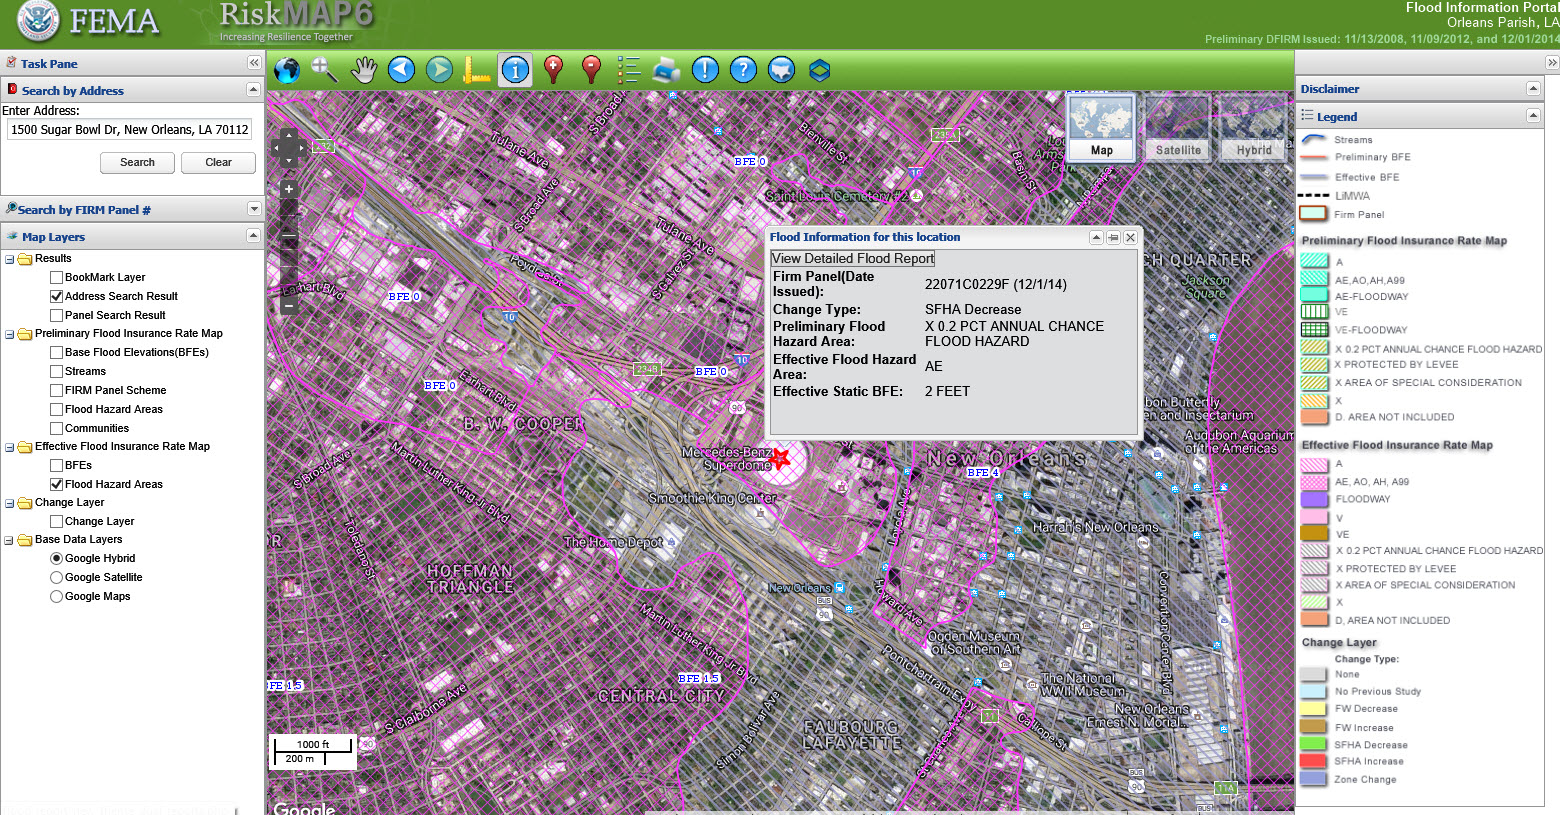
The box details the flood map panel number, the Special Flood Hazard Area (SFHA) chance of increase or decrease, the Preliminary and Effective Flood Hazard Area (AE) and the Effective Base Flood Elevation (2 Feet).

Zone A: This zone has a low risk of erosion and can experience breaking waves less than 1.5 feet. No base flood elevations are calculated.
Coastal Zone A: This zone is subject to erosion, fast and strong water movement, and wave heights of 1.5 to 3 feet during storm events. Base flood elevations are calculated for these zones and displayed on flood maps. Communities have the option of adopting more stringent building codes (up to V Zone standards) in this zone, which would give them points in the Community Rating System. This zone is relatively new, so it may not be applicable to your community’s current flood maps. On the new maps, the landward edge of the zone is marked by the LiMWA line (Line of Moderate Wave Action). An elevation certificate is required to accurately calculate insurance rates in this zone.
These zones make up the Special Flood Hazard Area and are in the 100-year-flood zone. They have at least a 1% chance of flooding each year and at least a 26% chance of flooding over the lifetime of a 30-year mortgage. Structures located in these zones with a federally-backed mortgage are required to purchase flood insurance. On a flood map these zones are referred to as the letters below or, collectively, as the 1% annual chance or 100-year-flood zone.
Zone AE or Zone A1-30: This zone has a low risk of erosion and can experience breaking waves less than 1.5 feet. Base flood elevations are calculated and displayed on flood maps. AE zones are present on newer maps; zones A1-30 are present on older maps. An elevation certificate is required to accurately calculate insurance rates in these zones.
Zones AH, AO, AR, A99: See FEMA’s Map Service Center definitions. The flood insurance rate zone that corresponds to areas of the 100-year floodplains that will be protected by a Federal flood protection system where construction has reached specified statutory milestones. No Base Flood Elevations or depths are shown within this zone. Mandatory flood insurance purchase requirements apply.
Zone V: This zone faces an additional hazard from erosion, fast and strong water movement, and waves that may be 3 feet or greater during storm events.
Zone VE or V1-V30: These zones face an additional hazard from storm waves, and can experience waves greater than 3 feet. Base flood elevations are calculated for these zones and displayed on flood maps. VE zones are present on newer maps; zones V1-30 are present on older maps. An elevation certificate is required to accurately calculate insurance rates in these zones.
Zone X (shaded) and Zone B: The area between the extent of the 100-year-flood (1% annual chance flood) and the 500-year-flood (0.2% annual chance flood). There is no base flood elevation calculated for these zones, so elevation certificates are not necessary. Flood insurance could be much cheaper in these zones because of the lower risk. These areas are not subject to the mandatory purchase of flood insurance.
Zone X (unshaded) and Zone C: The area outside of the extent of the 500-year-flood with minimal flood risk. If a structure is located in this zone, however, it does not mean that it is out of harm’s way. The risk determination is based on probability, and the probability of a flood reaching this area is low, but it is not impossible. There is no base flood elevation calculated for these zones, so elevation certificates are not necessary. Flood insurance could be as much as 50% cheaper in these zones because of the lower risk. These areas are not subject to the mandatory purchase of flood insurance.
Zone D: Areas classified as Zone D have not had a flood hazard analysis performed. These are often areas with very low population counts.

and click the View Map icon as shown below.
![]()
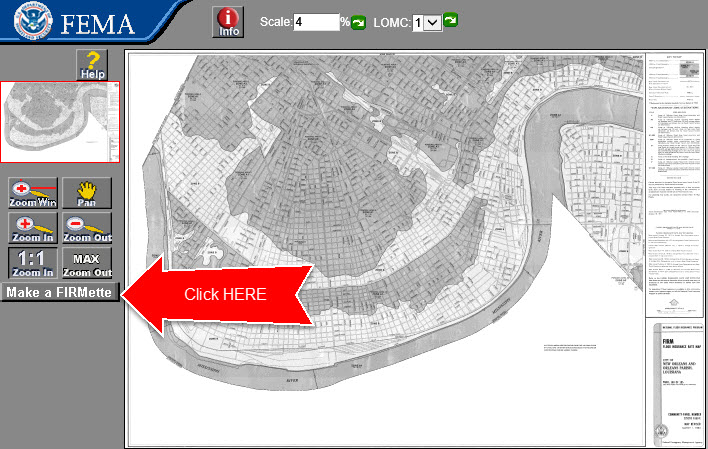
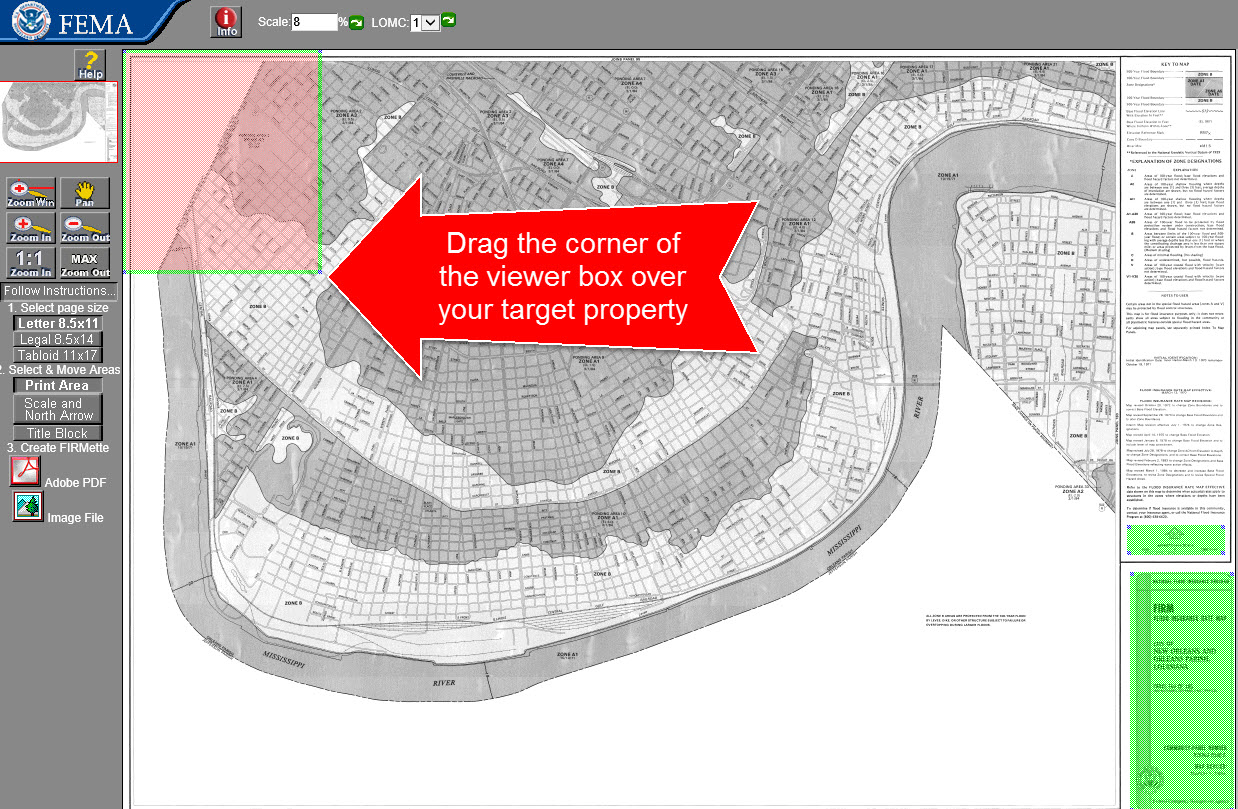
Drag the green viewer box over your target area, and click Create FIRMette Adobe PDF.
For more information on flood maps, read our article Flood Zoning For Dummies, and choose from over 150 articles on commercial real estate.
This is the boundary of the flood that has a 1-percent chance of being equaled or exceeded in any given year. Also known as the 100-year floodplain.
The height, in relation to the National Geodetic Vertical Datum of 1929 (or other datum, where specified), of the flood having a 1-percent chance of being equaled or exceeded in any given flood year (also known as the 100-year flood or the base flood).
The flood having a 1-percent chance of being equaled or exceeded in any given year; also known as the base flood. The 1-percent annual chance flood, which is the standard used by most Federal and state agencies, is used by the National Flood Insurance Program (NFIP) as the standard for floodplain management and to determine the need for flood insurance. A structure located within a special flood hazard area shown on an NFIP map has a 26 percent chance of suffering flood damage during the term of a 30-year mortgage.
This is the boundary of the flood that has a 1-percent chance of being equaled or exceeded in any given year. Officially termed the 1-percent annual chance floodplain.
This is the boundary of the flood that has a 0.2-percent chance of being equaled or exceeded in any given year. Officially termed the 0.2-percent annual chance floodplain.
The effect of downstream flow on the water-surface profile.
The height of the base flood, usually in feet, in relation to the National Geodetic Vertical Datum of 1929, the North American Vertical Datum of 1988, or other datum referenced in the Flood Insurance Study report, or depth of the base flood, usually in feet, above the ground surface.
Points that identify the extreme limits of the natural stream channel. These stations are typically assigned at locations along a cross section where a relatively flat area exists outside of the channel.
A location where two streams or rivers meet.
A line on a map joining points of equal altitude.
The depth of flow at which, for a given discharge at a given location, the total energy is the minimum value possible for flow to occur.
A fixed starting point of a scale.
An independent agency of the Federal government, founded in 1979, which reports directly to the President. FEMA is responsible for identifying and mitigating natural and man-made hazards. The agency's mission is: to reduce loss of life and property and protect our nation's critical infrastructure from all types of hazards through a comprehensive, risk- based, emergency management program of mitigation, preparedness, response and recovery.
A general and temporary condition of partial or complete inundation of normally dry land areas. For flood insurance claim purposes, two or more structures must be inundated before flood damage will be covered.
A pre-Map Initiatives floodplain management map that delineates the 100-year (1% annual chance) and 500-year (0.2% annual chance) floodplains, floodway, and cross sections.
A map on which the 100-year (1% annual chance) and 500-year (0.2% annual chance) floodplains, Base Flood Elevations, and risk premium zones (and floodway information on Map Initiatives FIRMs) are delineated to enable insurance agents to issue accurate flood insurance policies to homeowners in communities participating in the National Flood Insurance Program.
An examination, evaluation, and determination of flood hazards and, if appropriate corresponding water-surface elevations. The resulting reports are used to develop Flood Insurance Rate Maps. Also know as a flood elevation study.
The operation of a program of corrective and preventative measures for mitigating flood damage, including, but not limited to, emergency preparedness plans, flood-control works, and floodplain management regulations. Floodway Channel of a stream plus any adjacent floodplain areas that must be kept free of encroachment so that the 100-year flood discharge can be conveyed without increasing the elevation of the 100-year flood by more than a specified amount (1 foot in most states).
Area inundated by the base (1-percent annual chance) flood, identified on the Flood Insurance Rate Map as Zones A, AE, AH, AO, AR, V, VE, or A99.
The height, in relation to the National Geodetic Vertical Datum of 1929 (or other datum, where specified) of floods of various magnitudes and frequencies in the identified floodplains of coastal or riverine areas.
Additional information can be found at:
Federal Emergency Management
Agency Map Service Center
P.O. Box 1038
Jessup, Maryland 20794-1038
Telephone: (800) 358-9616
Fax: (800) 358-9620
http://www.msc.fema.gov