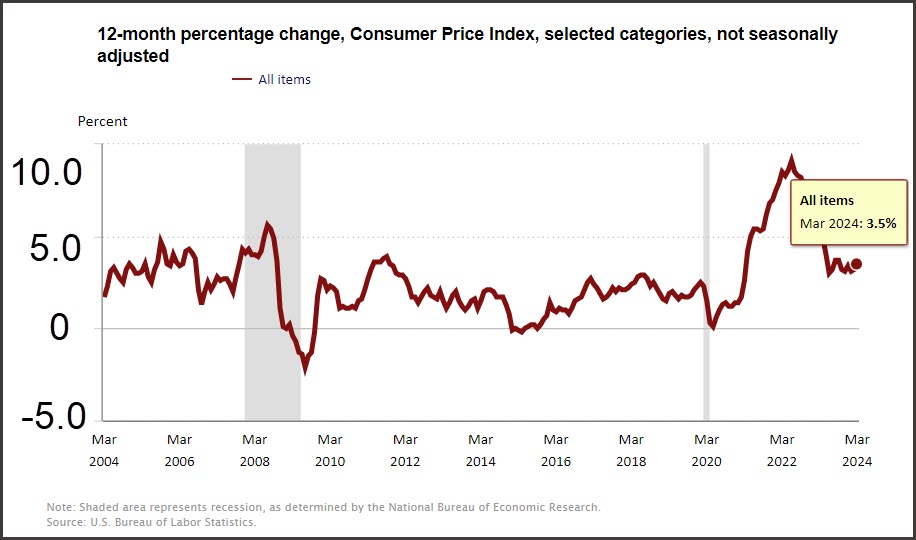
Just out today: inflation the last 12 months has not gotten worse and at 3.5% is below the 4.0% average for the last 5 years. Inflation for the last 12 months stands unchanged from last month. That is the good news, but it doesn’t tell the entire story. This article drills down into the components of inflation and exposes how smoking products are driving the crazy train.
Inflation is called the Consumer Price Index (CPI) which is calculated by the Bureau of Labor who examines how consumers spend their money. There are two populations measured: the All Urban Consumer Group which represent 90% of the total population, and the Urban Wage Earners which includes clerical workers but only covers 30% of the population. Not included in the CPI are people in rural areas, farms, military, prisons and mental hospitals.
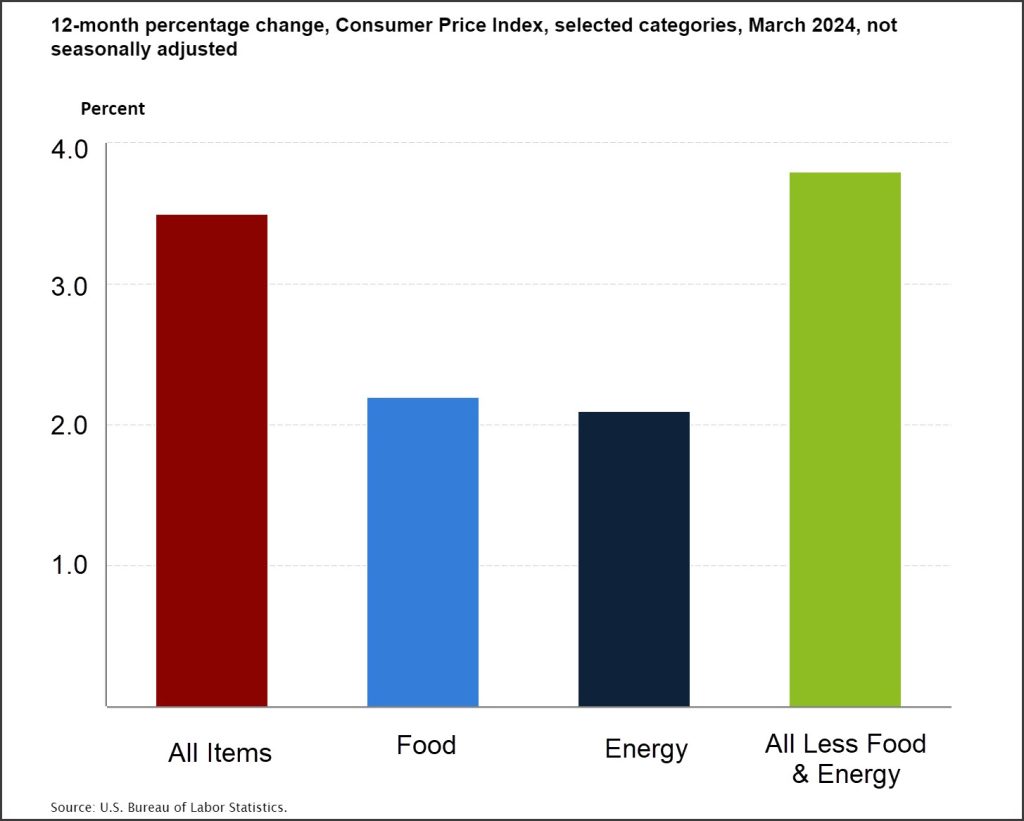
The major categories are Food and Energy but, like any government agency, there is a 3rd category called All Items Less Food & Energy. It includes apparel, vehicles, medical care, beverages and smoking products.
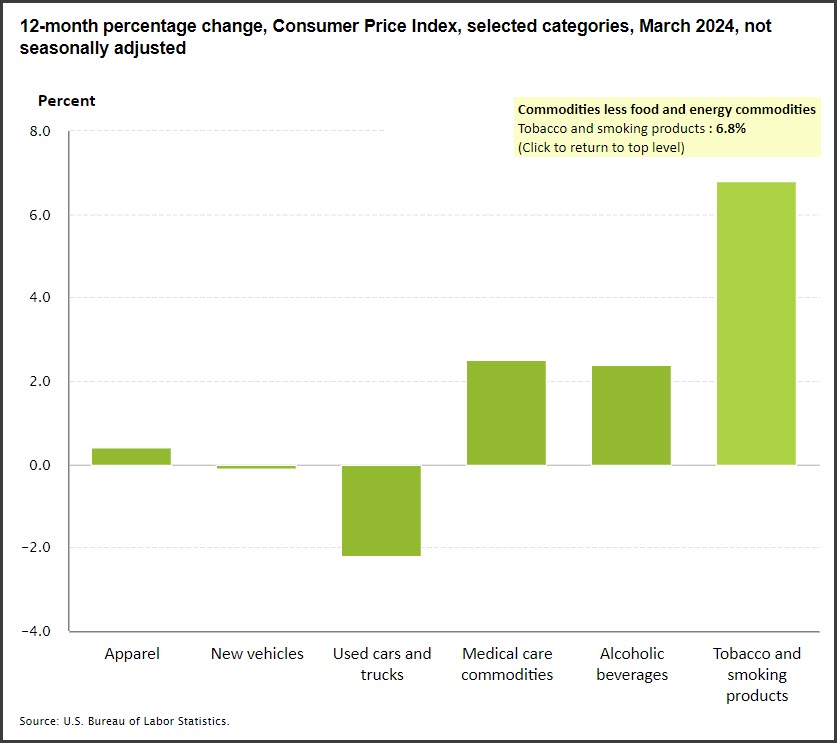
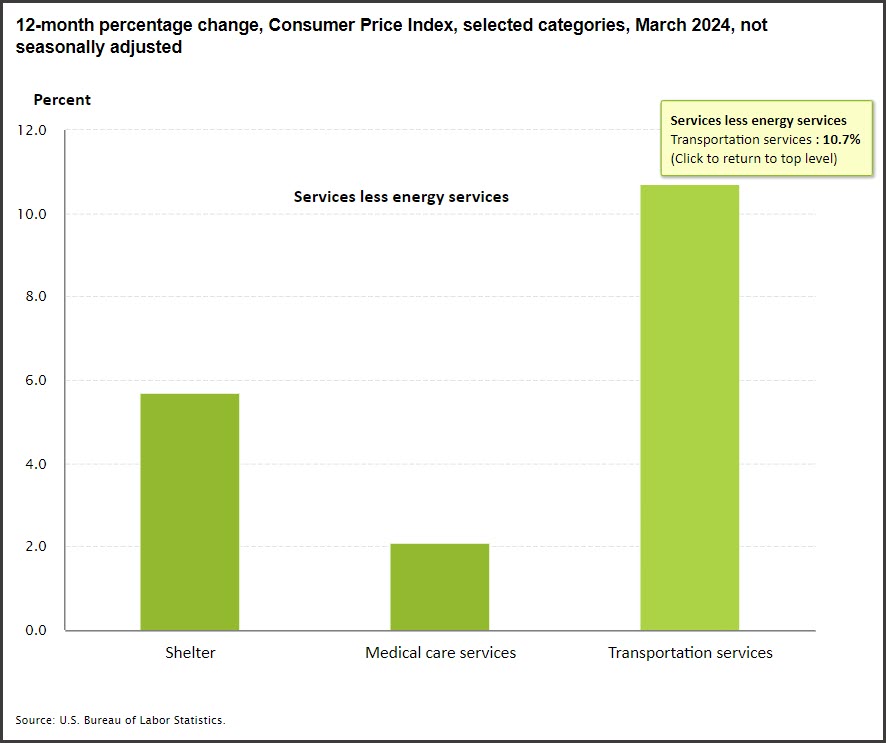
While inflation averaged 3.5% over the last 12 months, both the Food and the Energy sectors only increased 2%, which means the real driver of inflation is everything else. The highest increase in prices were the Smoking Products category at 6.8%, Shelter at 5.8% and Transportation at 10.7%.
Look for egg prices to skyrocket and Biden had nothing to do with it. Here are some finicky price changes:
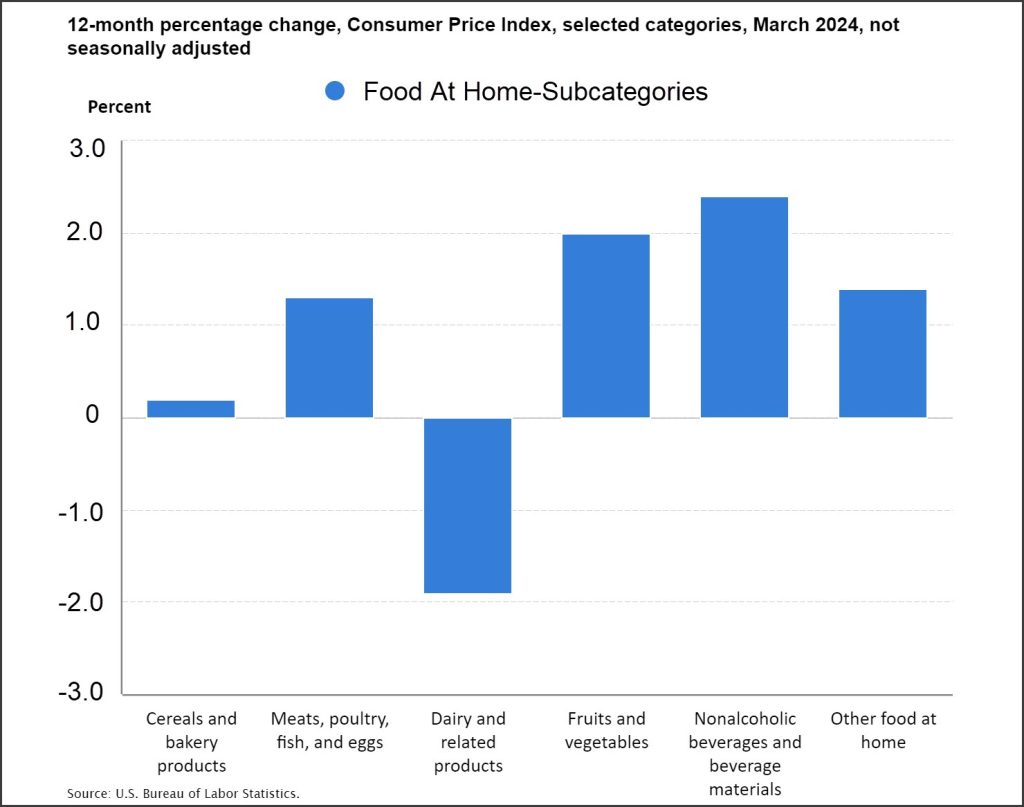
Data used to calculate the CPI is collected monthly from 75 cities, including 6,000 homes and 22,000 retailers, for prices people pay for goods and services purchased for everyday living. The conclusion is that inflation is not just one number that applies to everything because goods and services have prices that increase but also decline, and each item has its own supply and demand curve.
For more insights into inflation and, most importantly, how inflation affects your lease, read our blogs: