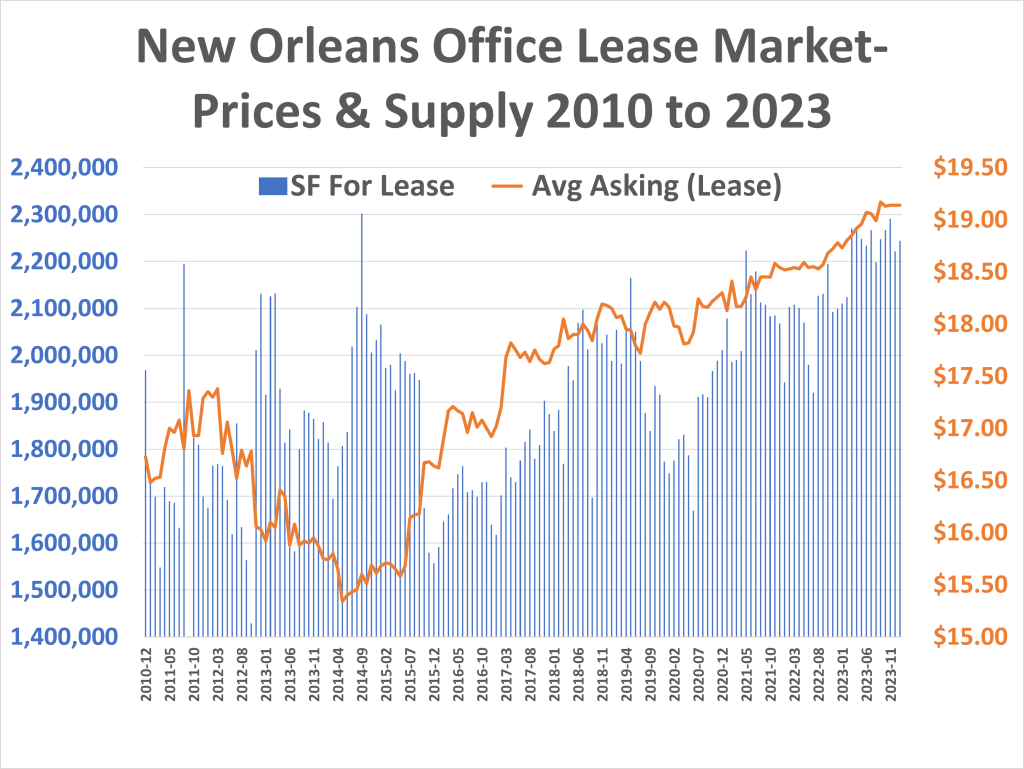
We examined 300,000,000 square feet of New Orleans office space for lease since 2010, comprised of 57,000 listings and 1,500 lease transactions, looking for trends and insight to why lease prices have increased the last 13 years despite the fact that supply has increased in the number of square feet for lease. Let's get started.
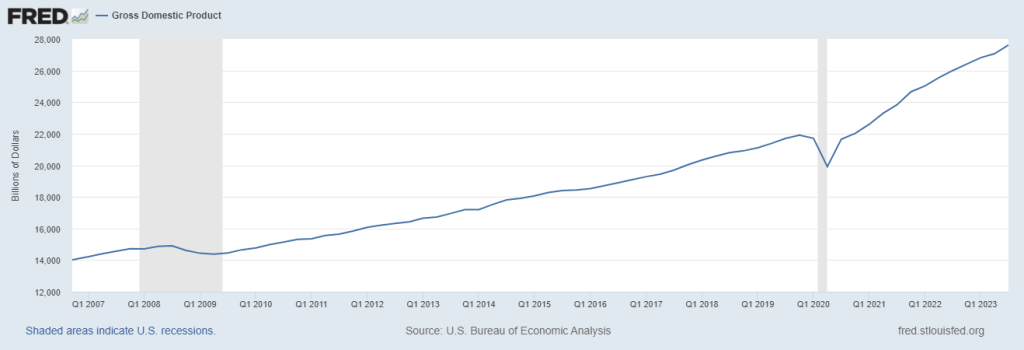
First let's look at the averages for the last 13 years. We start in 2010, at the tail end of the nasty 2008 recession where the economy stagnated for 2 years due to the mortgage crisis. Finally by 2011, GDP got back on track.
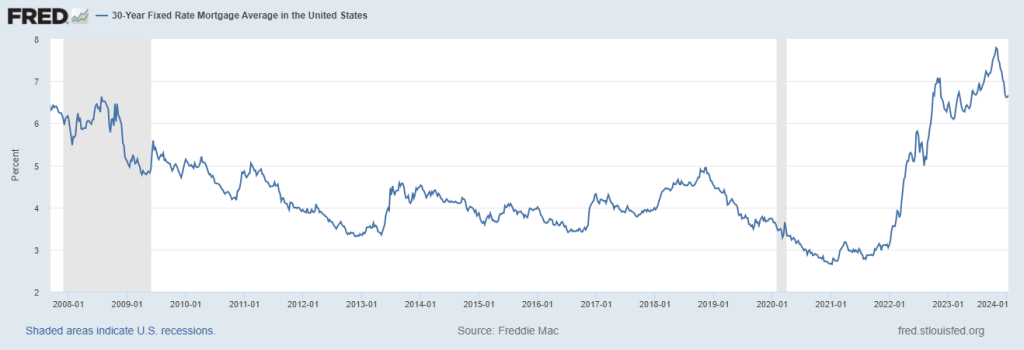
From 2010 to 2022, 30 year mortgage rates declined, then skyrocketed from 3% to 7% in just 2 years.
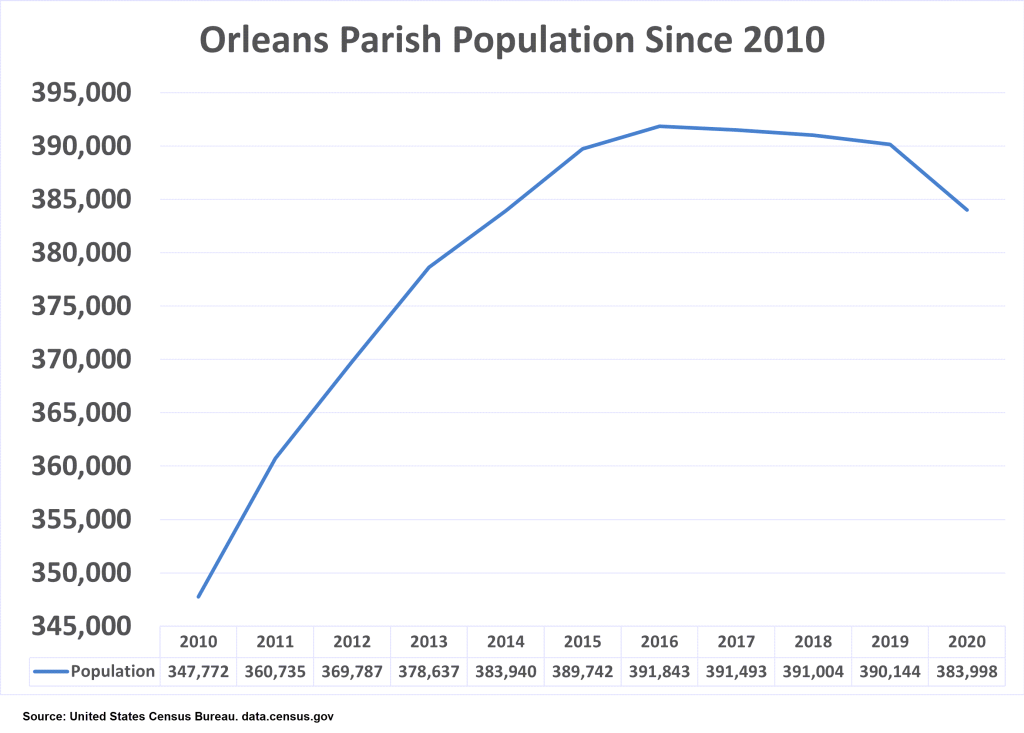
Given declining rates and a slow growth economy in Orleans Parish, population increased 20% over 6 years then peaked in 2016. A declining population should mean less demand for offices in which to house them.
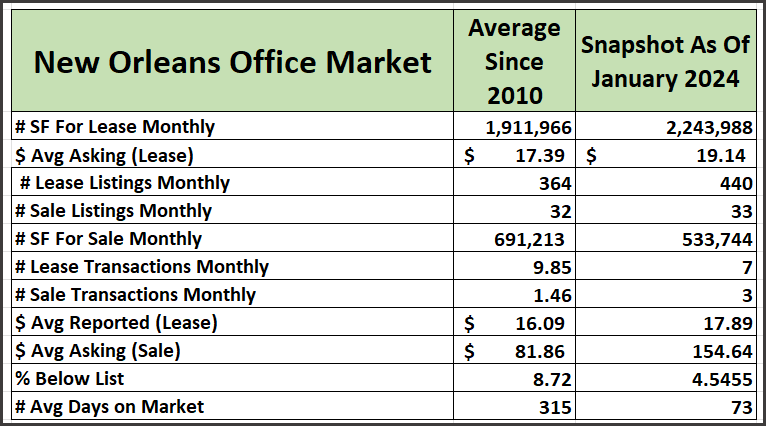
Since 2010, the average monthly supply of office space for lease has been 1,911,000 square feet, compared to 2024 of 2,243,000. There has been a monthly average of 364 listings for lease averaging 5,250 SF at $17.30/SF but only 10 actually leased averaging $16.09/SF.
Office properties for sale totaled 110,000,000 SF since 2010 and averaged 690,000 SF monthly comprised of 32 listings at 21,000 SF at a price of $81/SF.
Since 2010, supply for lease, measured by square footage, has decreased 5 times but always rallied back stronger. The anomaly is that those times where supply fell, prices fell twice but rose 3 times.
In 2011, supply fell 525,000 SF but prices increased from $16.80 to $17.35/SF. The number of listing for lease fell 24%. In 2015, supply fell 450,000 SF within 6 months, but lease prices increased from $15.58/SF to $16.64/SF.
The lowest lease price was May 2014 at $15.34/SF, followed by the lowest monthly SF for lease during December 2015, and prices have increased steadily since then to the 2024 all time highs of $19.14/SF and 2,250,000 SF listed for lease.
So how can prices increase even though supply has increased and population has declined? The answer is a shift in the demand curve. Despite more space for lease on the market, there has been enough demand to soak up the available space and pay the higher lease rates because there are few alternatives.
No new office buildings have been built in New Orleans since 2010 and several hundred thousand square feet has been taken off the market, including the 485,000 SF Plaza Tower and the 1250 Poydras conversion of office to hotel space.
For more information on office prices, see our blog: Prices For Office, Industrial, Retail & Shopping Centers In Major Cities In Louisiana