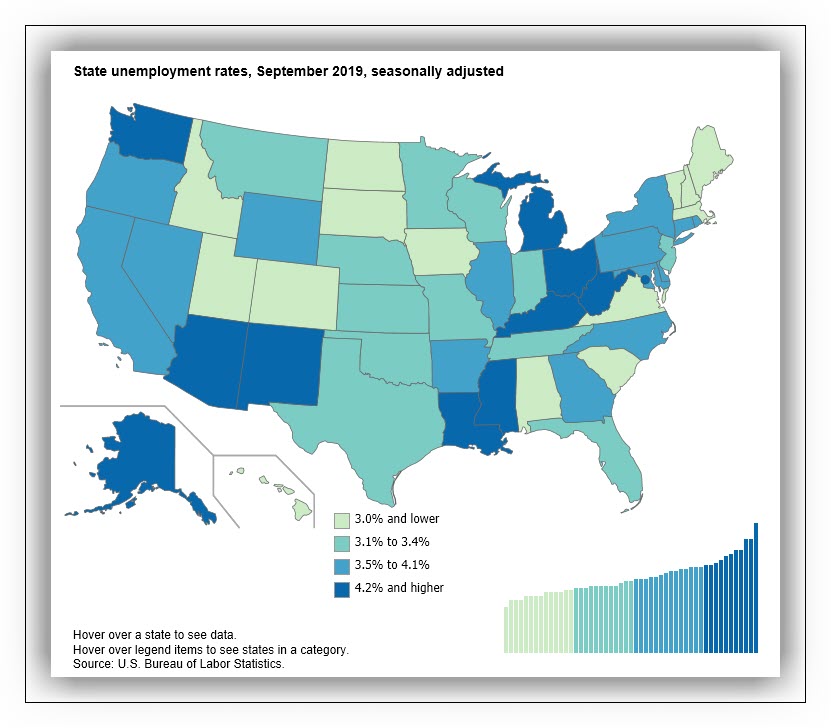
Not all states are enjoying the benefits of September's 3.5% national average unemployment rate; in fact, 50% of the states have worse unemployment than the average and about 25% have much worse. Only 3 states enjoyed an increase in nonfarm payroll employment: Kentucky, Idaho and Hawaii.

Alaska is suffering the highest unemployment at 6.2%, with Mississippi next in line at 5.4%. Louisiana ranks 9th from bottom at 4.3%. Michigan and Ohio also fall in this category, voting their dissatisfaction.

California is a $3 trillion dollar economy, ranked the 5th largest in the world, so it's 4% unemployment puts a drag on the national average. Pennsylvania and New York are also strategic voting states and fall in the slightly worse job category.
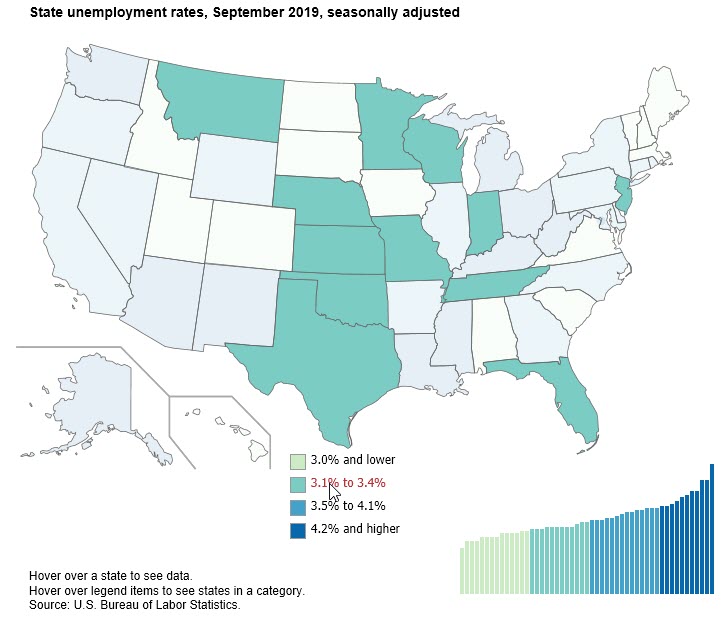
Texas has no state income tax and is business friendly which helps increase population which leads to jobs. When you add in Florida, Minnesota and Wisconsin plus the middle America states, you can see why better off voters can vote Trump another 4 years.
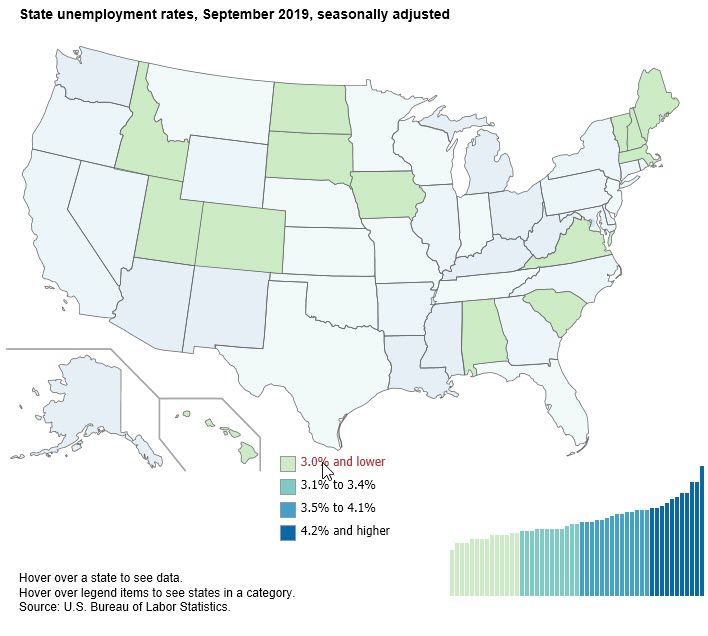
Vermont had the lowest unemployment rate in September 2019, at 2.2 percent. Something powerful is happening in Alabama, Colorado, and New Jersey which had the largest over-the-year unemployment rate decreases (-0.8 percentage each).

Mississippi's unemployment rate is the 2nd worst in the nation at 5.4%, but it hasn't always been that way. It's been worse. Since 1976 when the Bureau of Labor first reports data, Mississippi only had an unemployment rate below 5% in 2 out of the 43 years: from October 2017 to August 2019.


Mississippi's labor force increased steadily from 1976 at 961,115 to year 2000 at 1,252,180, then stagnated to 1,287,413 in September 2019. That's essentially zero growth in the labor force the last 20 years, even though the unemployment rate is near it's lowest level in 40 years.
Compared to the national labor force which increased 72% from 1976 to 2019, Mississippi sucks hind teat at 30%. Had Mississippi kept pace with the national average, the labor force would be higher by 365,000, or 30% more workers. Mississippi just need more people moving into the state.
In summary, the unemployment rate is a misleading indicator of health. A steadily growing labor force is a better indicator since it means the population is increasing which leads to more jobs, higher production of goods and services, higher tax revenue for government spending and higher wages which leads to higher consumer spending which further drives new business formation and continues the domino effect.